NEIROCTO Impulse Watcher (Alert Ready)//@version=5
indicator("NEIROCTO Combo Watcher (Pump vs Dump)", overlay=true)
// === RSI и его производные ===
rsi = ta.rsi(close, 14)
rsi_sma = ta.sma(rsi, 5)
rsi_up = rsi > rsi_sma
rsi_down = rsi < rsi_sma
// === Волатильность ===
volatility = math.abs(close - close ) / close * 100
volatility_trigger = volatility > 3
// === Объёмы ===
volume_sma = ta.sma(volume, 20)
volume_up = volume > volume_sma
// === Условие пампа ===
pump_condition = rsi > 45 and rsi_up and volatility_trigger and volume_up
// === Условие отката ===
dump_condition = rsi < 40 and rsi_down and volatility_trigger and volume_up
// === Фон ===
bgcolor(pump_condition ? color.new(color.green, 85) : na)
bgcolor(dump_condition ? color.new(color.red, 85) : na)
// === Метки ===
plotshape(pump_condition, title="🚀 PUMP Signal", location=location.belowbar, color=color.green, style=shape.labelup, text="🚀")
plotshape(dump_condition, title="⚠️ DUMP Signal", location=location.abovebar, color=color.red, style=shape.labeldown, text="⚠️")
// === Алерты ===
alertcondition(pump_condition, title="🚀 NEIROCTO: Возможен памп!", message="🚀 RSI ↑, Волатильность >3%, Объёмы высокие — возможен памп!")
alertcondition(dump_condition, title="⚠️ NEIROCTO: Возможен откат!", message="⚠️ RSI ↓, Волатильность >3%, объёмы растут — возможен откат!")
Volume

VPOC [cem_trades]This indicator highlights the price level with the highest traded volume within a defined session — known as the Volume Point of Control (VPOC). It's a powerful tool for identifying key support and resistance zones. Fully customizable with session times, timezones, and trading hours (RTH/ETH), making it suitable for both day and swing trading. More information at cem_trades.

NEIROCTO Impulse Watcher (Alert Ready)//@version=5
indicator("NEIROCTO Combo Watcher (Pump vs Dump)", overlay=true)
// === RSI и его производные ===
rsi = ta.rsi(close, 14)
rsi_sma = ta.sma(rsi, 5)
rsi_up = rsi > rsi_sma
rsi_down = rsi < rsi_sma
// === Волатильность ===
volatility = math.abs(close - close ) / close * 100
volatility_trigger = volatility > 3
// === Объёмы ===
volume_sma = ta.sma(volume, 20)
volume_up = volume > volume_sma
// === Условие пампа ===
pump_condition = rsi > 45 and rsi_up and volatility_trigger and volume_up
// === Условие отката ===
dump_condition = rsi < 40 and rsi_down and volatility_trigger and volume_up
// === Фон ===
bgcolor(pump_condition ? color.new(color.green, 85) : na)
bgcolor(dump_condition ? color.new(color.red, 85) : na)
// === Метки ===
plotshape(pump_condition, title="🚀 PUMP Signal", location=location.belowbar, color=color.green, style=shape.labelup, text="🚀")
plotshape(dump_condition, title="⚠️ DUMP Signal", location=location.abovebar, color=color.red, style=shape.labeldown, text="⚠️")
// === Алерты ===
alertcondition(pump_condition, title="🚀 NEIROCTO: Возможен памп!", message="🚀 RSI ↑, Волатильность >3%, Объёмы высокие — возможен памп!")
alertcondition(dump_condition, title="⚠️ NEIROCTO: Возможен откат!", message="⚠️ RSI ↓, Волатильность >3%, объёмы растут — возможен откат!")

Stochastic Money Flow IndexThe Stochastic Money Flow Index (or Stochastic MFI ), is a momentum indicator that combines the Money Flow Index (MFI) and the Stochastic Oscillator to identify overbought and oversold conditions in a market.
It is a variation of the classic Stochastic RSI that uses the MFI rather than the Relative Strength Index (RSI) in its calculation. While the RSI focuses solely on price momentum, the MFI is a volume-weighted indicator, meaning it incorporates both price and volume data.
The Stochastic MFI is intended to provide a more precise and sensitive reading of the MFI by measuring the level of the MFI relative to its range over a specific period.
Settings
Stochastic Settings
%K Length : The number of periods used to calculate the Stochastic. (Default: 14)
%K Smoothing : The SMA length used to 'smooth' the %K line. (Default: 3)
%D Smoothing : The SMA length used to 'smooth' the %D line. (Default: 1)
Money Flow Index Settings
MFI Length : The number of periods used to calculate the Money Flow Index. (Default: 14)
MFI Source : The source used to calculate the Money Flow Index. (Default: close)
Additional Settings
Show Overbought/Oversold Gradients? : Toggle the display of overbought/oversold gradients. (Default: true)

RSI Rising Over 50this is part of some pine script testing I'm doing to begin both dabbling in trading and the UI.

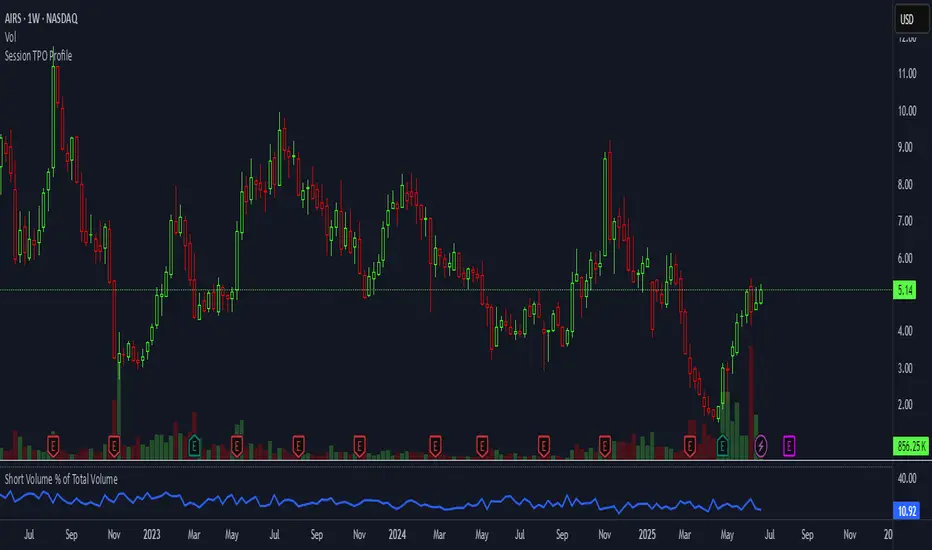
Short Volume % of Total VolumeShort Volume % of Total Volume
This indicator plots the daily short volume as a percentage of total volume for a specific U.S. stock. The short volume is sourced from FINRA’s reported short sale data and is compared against the stock’s total trading volume for the same day.
📊 Use Cases:
Monitor short-selling pressure over time.
Identify spikes in short volume % that may signal increased bearish positioning.
Use in conjunction with price action to gauge sentiment shifts or potential short squeezes.
⚠️ Note: FINRA data reflects activity from FINRA-regulated trading venues only and may not represent full market-wide short activity.
FINRA Short Volume (Daily)FINRA Short Volume (Daily)
This indicator displays the daily short sale volume reported by FINRA for a specific U.S. stock.
🔍 Key Features:
Pulls official FINRA short volume using FINRA: _SHORT_VOLUME
Updates daily, regardless of chart timeframe
Useful for tracking short-selling activity over time
📈 Use Cases:
Identify spikes in short volume that may precede price volatility
Monitor persistent shorting pressure
Combine with price action or other sentiment indicators for squeeze potential
⚠️ Note: This data only includes short sales reported to FINRA — it may not reflect total market-wide short interest. For broader context, use this with other data sources like short interest as a % of float or borrow rates.

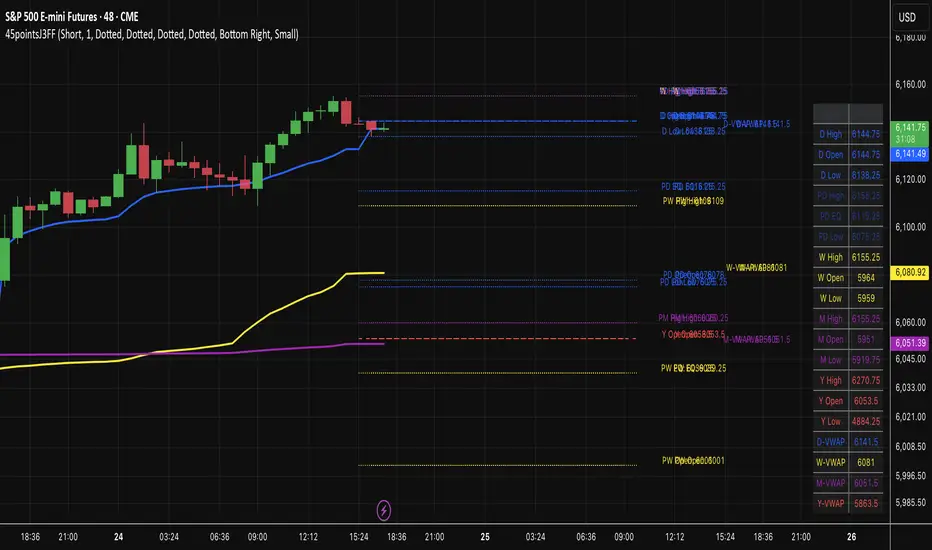
45pointsJ3FF Enhanced# 45pointsJ3FF Enhanced Pine Script Indicator
This is a comprehensive multi-timeframe support and resistance indicator for TradingView that displays key price levels and VWAP (Volume Weighted Average Price) across different time periods.
## 🎯 **Core Functionality**
The indicator plots critical price levels from multiple timeframes simultaneously on your chart, helping traders identify key support/resistance zones and volume-based price levels.
## 📊 **Key Levels Displayed**
### **Multi-Timeframe Levels:**
- **Daily**: Open, High, Low + Previous Day levels
- **Weekly**: Open, High, Low + Previous Week levels
- **Monthly**: Open, High, Low + Previous Month levels
- **Yearly**: Open, High, Low + Previous Year levels
### **Equilibrium Levels:**
- **50% Retracement** levels for previous periods (midpoint between high and low)
- Helps identify potential reversal zones
### **VWAP Levels:**
- **Daily VWAP**: Volume-weighted average for current day
- **Weekly VWAP**: Custom calculation for current week
- **Monthly VWAP**: Custom calculation for current month
- **Yearly VWAP**: Custom calculation for current year
## ⚙️ **Customization Options**
### **Display Controls:**
- **Individual toggles** for each timeframe (Daily/Weekly/Monthly/Yearly)
- **Previous period toggles** to show/hide historical levels
- **Line extension options**: Short, Right, Both
- **Adjustable line width** (1-3 pixels)
### **Visual Customization:**
- **Custom colors** for each timeframe
- **Individual line styles** (Solid, Dashed, Dotted) for each timeframe
- **Price labels** can be toggled on/off for lines and VWAPs
### **Price Table Features:**
- **Comprehensive side table** showing all active level prices
- **4 position options**: Top/Bottom + Left/Right corners
- **3 size options**: Small, Normal, Large
- **Color-coded entries** matching chart lines
- **Auto-filtering**: Only shows enabled levels
## 🔧 **Technical Implementation**
### **VWAP Calculations:**
- **Daily**: Uses built-in `ta.vwap()` function
- **Weekly/Monthly/Yearly**: Custom accumulative calculations using volume-weighted price averaging
- **Timeframe Detection**: Higher timeframe VWAPs only show on intraday charts
### **Higher Timeframe Data:**
- Uses `request.security()` to fetch OHLC data from higher timeframes
- **Lookahead enabled** for real-time updates
- **Previous period data** accessed using ` ` historical referencing
### **Drawing System:**
- **Dynamic line drawing** with customizable extension
- **Smart labeling system** with price formatting
- **Tick-rounded prices** for clean display
- **Performance optimized** with conditional drawing
## 📈 **Trading Applications**
### **Support & Resistance:**
- **Previous day/week/month highs and lows** act as key S/R levels
- **Opening levels** often serve as pivot points
- **Equilibrium levels** (50% retracements) are common reversal zones
### **VWAP Trading:**
- **Daily VWAP**: Intraday trend direction and mean reversion
- **Higher timeframe VWAPs**: Longer-term trend bias
- **Multiple VWAP confluence** creates stronger levels
### **Multi-Timeframe Analysis:**
- **Level confluence**: Multiple timeframes aligning creates stronger zones
- **Trend context**: Higher timeframe levels provide broader market context
- **Entry/Exit planning**: Previous period levels help plan trades
## 🎨 **Visual Organization**
### **Color Coding:**
- **Blue**: Daily levels (default)
- **Yellow**: Weekly levels (default)
- **Purple**: Monthly levels (default)
- **Red**: Yearly levels (default)
- **Transparency**: Previous period levels shown in lighter shades
### **Line Styles:**
- **Solid lines**: Current period highs/lows
- **Dashed lines**: Opening levels
- **Dotted lines**: Previous period levels
- **Thick lines**: VWAP plots (2px width)
## 🔍 **Unique Features**
1. **Custom VWAP calculations** for weekly/monthly/yearly periods
2. **Intelligent table display** that only shows active levels
3. **Comprehensive customization** without overwhelming interface
4. **Performance optimized** with conditional rendering
5. **Professional presentation** with watermark and clean styling
This indicator is particularly valuable for traders who use multiple timeframe analysis and want a clean, organized way to visualize key price levels and volume-based averages all in one tool.
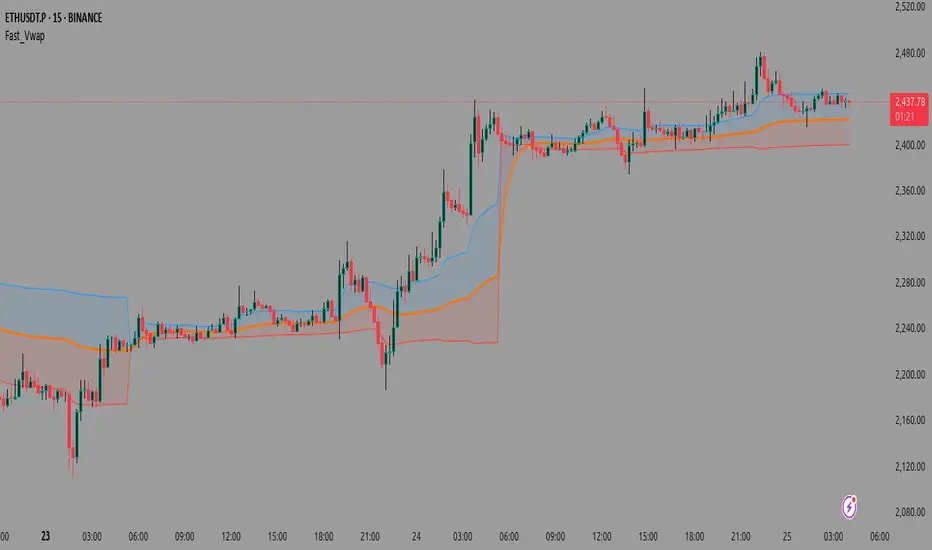
Fast_VwapThis is a Pine Script indicator that calculates and displays Volume Weighted Average Price (VWAP) with several advanced features, including multiple anchoring methods, deviation bands, and optional machine learning enhancements.
Core Components
1. VWAP Calculation
The indicator calculates VWAP using the standard formula:
text
VWAP = Σ(Price × Volume) / Σ(Volume)
Where price can be customized (default is HLC3 - the average of high, low, and close).
2. Anchoring Methods
The indicator offers four ways to reset/start the VWAP calculation:
Session: Resets at the start of each new trading day (most common)
Lowest Low: Resets when a new 10-bar low occurs
Highest High: Resets when a new 10-bar high occurs
Fixed Length: Resets after a specified number of bars (default 20)
3. Deviation Bands
The indicator can show standard deviation bands around the VWAP:
Upper band = VWAP + (Standard Deviation × Multiplier)
Lower band = VWAP - (Standard Deviation × Multiplier)
4. Machine Learning Enhancements
Two optional ML methods can be applied to smooth the VWAP:
Simple Average: Uses an EMA (Exponential Moving Average) of the VWAP
KNN (K-Nearest Neighbors): A simplified implementation that looks at recent values to adjust the current VWAP
How It Works
Inputs: The user can configure all parameters including price source, anchoring method, band settings, and ML options.
Anchoring: The script first determines when to reset the VWAP calculation based on the selected anchoring method.
VWAP Calculation: Using the anchoring points, it calculates the cumulative price×volume and total volume to compute the VWAP and standard deviation bands.
ML Processing: If enabled, the raw VWAP value is smoothed using either a simple EMA or a KNN algorithm that looks at the most similar recent values.
Visualization: The final VWAP line is plotted along with optional deviation bands and colored fills between the bands and VWAP line.
Use Cases
Intraday Trading: When anchored to session, helps identify fair value during the trading day
Swing Trading: When using fixed length or high/low anchoring, can identify support/resistance
Trend Confirmation: Deviation bands help identify overbought/oversold conditions relative to volume-weighted price
The combination of traditional VWAP with machine learning smoothing makes this a unique tool that can potentially reduce noise while maintaining the volume-weighted price information that makes VWAP valuable.
A deviation band is a statistical tool that creates upper and lower boundaries around a central line (in this case, the VWAP) based on how much prices typically vary from that average.
How It Works
Standard Deviation Calculation
The indicator calculates how much prices deviate from the VWAP:
Measures the "spread" or volatility of prices around the VWAP
Uses the mathematical formula for standard deviation
Creates bands at a specific distance from the VWAP line
What Deviation Bands Tell You
Statistical Significance
~68% of price action typically stays within 1 standard deviation
~95% stays within 2 standard deviations
When price touches the bands, it's statistically "unusual"
Trading Signals
Price hits upper band: Potentially overbought, consider selling
Price hits lower band: Potentially oversold, consider buying
Price stays within bands: Normal price action
Price breaks outside bands: Strong momentum move
Dynamic Adjustment
High volatility periods: Bands automatically widen
Low volatility periods: Bands automatically narrow
Volume changes: Affects both VWAP and band calculations
Orange Line (Default)
What it is: The main VWAP line with machine learning enhancement
Purpose: This is the core signal line - the Volume Weighted Average Price that's been processed through your selected ML method (Simple Average, KNN, or None)
Blue Line (Default)
What it is: Upper deviation band
Purpose: Shows potential resistance level - when price reaches this band, it may indicate overbought conditions
Red Line (Default)
What it is: Lower deviation band
Purpose: Shows potential support level - when price reaches this band, it may indicate oversold conditions
High–Low Range % Rolling Countshows the average daily % range of a fund.
note/disclaimer - I'm new to trading, Pinescripts and tradingview. If using this, exercise caution.

DTC_SVVolume is the footprint of smart money.
This indicator helps you track it with surgical precision. DTC_SV is a powerful, all-in-one volume intelligence tool built for traders who rely on volume expansion, institutional candle footprints, and relative strength logic.
Inspired by the Traders Reality framework, this script detects and color-codes vector candles (high-volume momentum candles), provides real-time stats in a clean dashboard, and offers bar-by-bar context for smart money involvement.
🧠 Core Features
📊 Smart Vector Candle Detection
Automatically highlights candles with 1.5x or 2x relative volume.
Dynamic color coding (Green, Red, Blue, Purple) to indicate type and strength.
🟦 Live Volume Histogram with MA
Volume bars show strength and weakness with clarity.
20-period volume moving average line included for trend context.
💬 Volume Labels on Bars
Real-time labels on each vector candle showing absolute volume and % above average.
Helps you see the punch behind every candle.
📈 Advanced Dashboard Panel (Top/Bottom Corner)
Stay data-aware without clutter. The live table shows:
✅ RVOL % – Relative Volume of the current bar.
📈 Daily Trend – Based on position vs 10 & 20 EMA (from daily timeframe).
🔍 Distance to Daily EMA 10/20 – % deviation from mean.
♻️ Avg Recovery of Last 5 Vectors – A key signal for mean reversion plays.
📊 Session RVOL – How current volume stacks up within today’s session.
🧮 Avg Volume of Last 10 Vector Candles – Measures momentum strength.
🔁 Today vs Previous Day Total Volume – Real-time market participation pulse.
🚀 Use Cases
Identify true institutional candles during fake retail moves.
Measure when liquidity is being injected, not just price pushing.
Gauge whether current moves are sustainable or manipulated.
Time your entries using volume spikes + price action confluence.
Track vector candle recovery zones and exhaustion potential.

Rolling VWAP LevelsRolling VWAP Levels Indicator
Overview
Dynamic horizontal lines showing rolling Volume Weighted Average Price (VWAP) levels for multiple timeframes (7D, 30D, 90D, 365D) that update in real-time as new bars form.
Who This Is For
Day traders using VWAP as support/resistance
Swing traders analyzing multi-timeframe price structure
Scalpers looking for mean reversion entries
Options traders needing volatility bands for strike selection
Institutional traders tracking volume-weighted fair value
Risk managers requiring dynamic stop levels
How To Trade With It
Mean Reversion Strategies:
Buy when price is below VWAP and showing bullish divergence
Sell when price is above VWAP and showing bearish signals
Use multiple timeframes - enter on shorter, confirm on longer
Target opposite VWAP level for profit taking
Breakout Trading:
Watch for price breaking above/below key VWAP levels with volume
Use 7D VWAP for intraday breakouts
Use 30D/90D VWAP for swing trade breakouts
Confirm breakout with move beyond first standard deviation band
Support/Resistance Trading:
VWAP levels act as dynamic support in uptrends
VWAP levels act as dynamic resistance in downtrends
Multiple timeframe VWAP confluence creates stronger levels
Use standard deviation bands as additional S/R zones
Risk Management:
Place stops beyond next VWAP level
Use standard deviation bands for position sizing
Exit partial positions at VWAP levels
Monitor distance table for overextended moves
Key Features
Real-time Updates: Lines move and extend as new bars form
Individual Styling: Custom colors, widths, styles for each timeframe
Standard Deviation Bands: Optional volatility bands with custom multipliers
Smart Labels: Positioned above, below, or diagonally relative to lines
Distance Table: Shows percentage distance from each VWAP level
Alert System: Get notified when price crosses VWAP levels
Memory Efficient: Automatically cleans up old drawing objects
Settings Explained
Display Group: Show/hide labels, font size, line transparency, positioning
Individual VWAP Groups: Color, line width (1-5), line style for each timeframe
Standard Deviation Bands: Enable bands with custom multipliers (0.5, 1.0, 1.5, 2.0, etc.)
Labels Group: Position (8 options including diagonal), custom text, price display
Additional Info: Distance table, alert conditions
Technical Implementation
Uses rolling arrays to maintain sliding windows of price*volume data. The core calculation function processes both VWAP and standard deviation efficiently. Lines are created dynamically and updated every bar. Memory management prevents object accumulation through automatic cleanup.
Best Practices
Start with 7D and 30D VWAP for most strategies
Add 90D/365D for longer-term context
Use standard deviation bands when volatility matters
Position labels to avoid chart clutter
Enable distance table during high volatility periods
Set alerts for key VWAP level breaks
Market Applications
Forex: Major pairs during London/NY sessions
Stocks: Large cap names with good volume
Crypto: Bitcoin, Ethereum, major altcoins
Futures: ES, NQ, CL, GC with continuous volume
Options: Use SD bands for strike selection and volatility assessment

MA of TurnoverThis indicator helps in low liquity markets.
Very simple formula: Volume MA * price * %
Last day results is max suggested entry value.


LVN/HVN Auto Detection [PhenLabs]📊 PhenLabs - LVN/HVN Auto Detection
Version: PineScript™ v6
📌 Description
The PhenLabs LVN/HVN Auto Detection indicator is an advanced volume profile analysis tool that automatically identifies Low Volume Nodes (LVN) and High Volume Nodes (HVN) across multiple trading sessions. This sophisticated indicator analyzes volume distribution patterns to pinpoint critical support and resistance levels where price is likely to react, providing traders with high-probability zones for entries, exits, and risk management.
Unlike traditional volume indicators that only show current activity, this tool builds comprehensive volume profiles from historical sessions and intelligently filters the most significant levels. It combines real-time volume analysis with dynamic level detection, offering both visual bubbles for immediate volume activity and persistent horizontal lines that act as ongoing support/resistance references.
🚀 Points of Innovation
Multi-Session Volume Profile Analysis - Automatically calculates and analyzes volume profiles across the last 5 trading sessions
Intelligent Level Separation Logic - Prevents overlapping signals by maintaining minimum separation between LVN and HVN levels
Dynamic Timeframe Adaptation - Automatically adjusts session lengths based on chart timeframe for optimal level detection
Real-Time Activity Bubbles - Shows volume activity strength through different bubble sizes at key levels
Persistent Line Management - Creates horizontal lines that extend until price crosses them, providing ongoing reference points
Dual Threshold System - Independent percentage-based thresholds for both LVN and HVN identification
🔧 Core Components
Volume Profile Engine : Builds 20-row volume profiles for each analyzed session, distributing volume across price levels
Level Identification Algorithm : Uses percentage-based thresholds to classify volume distribution patterns
Separation Logic : Ensures minimum distance between conflicting levels, prioritizing HVN when overlap occurs
Line Management System : Tracks active support/resistance lines and removes them when price crosses through
Volume Activity Monitor : Compares current volume to 13-period moving average for activity classification
🔥 Key Features
Customizable Thresholds : LVN threshold (5-35%, default 20%) and HVN threshold (65-95%, default 80%) for precise level filtering
Volume Activity Multiplier : Adjustable volume threshold (0.5+, default 1.5) for bubble and line creation sensitivity
Flexible Display Modes : Choose between Lines only, Bubbles only, or Both for optimal chart clarity
Smart Level Separation : Minimum separation percentage (0.1-2%, default 0.5%) prevents conflicting signals
Color Customization : Independent color controls for LVN (red) and HVN (blue) elements
Performance Optimization : Processes every 15 bars with maximum 500 active lines for smooth operation
🎨 Visualization
Colored Bubbles : Three sizes (large, medium, small) indicate volume activity strength at key levels
Horizontal Lines : Persistent support/resistance lines with width corresponding to volume activity
Dual Color System : Semi-transparent red for LVN areas, semi-transparent blue for HVN zones
Information Tooltip : Optional table showing usage guidelines and optimization tips
📖 Usage Guidelines
Volume Thresholds
LVN Threshold
○ Default: 20.0%
○ Range: 5.0-35.0%
○ Description: Price levels with volume below this percentage are marked as LVNs. Lower values create fewer, more significant levels. Typical range 15-25% works for most instruments.
HVN Threshold
○ Default: 80.0%
○ Range: 65.0-95.0%
○ Description: Price levels with volume above this percentage are marked as HVNs. Higher values create fewer, stronger levels. Range 75-85% is optimal for most trading.
Display Controls
Volume Threshold
○ Default: 1.5
○ Range: 0.5+
○ Description: Multiplier for volume significance (High=2+threshold, Medium=1+threshold, Low=0+threshold). Higher values require more volume for signals.
✅ Best Use Cases
Swing Trading : Identify key levels for position entries and exits over multiple days
Scalping : Use bubbles for immediate volume activity confirmation at critical levels
Risk Management : Place stops beyond LVN levels where price moves quickly
Breakout Trading : Monitor HVN levels for potential breakout or rejection scenarios
Multi-Timeframe Analysis : Combine with higher timeframe levels for confluence
⚠️ Limitations
Timeframe Sensitivity : Lower timeframes may produce too many levels; higher timeframes recommended for cleaner signals
Volume Data Dependency : Accuracy depends on reliable volume data from your data provider
Historical Analysis : Uses past volume data which may not predict future price behavior
Performance Impact : High number of active lines may affect chart performance on slower devices
💡 What Makes This Unique
Automated Session Analysis : No manual drawing required - automatically analyzes multiple sessions
Intelligent Filtering : Advanced separation logic prevents overlapping and conflicting signals
Adaptive Processing : Adjusts to different timeframes automatically for optimal level detection
Dual Visualization System : Combines persistent lines with real-time activity indicators
🔬 How It Works
1. Volume Profile Construction :
Analyzes the last 5 trading sessions with dynamic session length based on timeframe
Divides each session’s price range into 20 equal levels for volume distribution analysis
2. Level Classification :
Calculates volume percentage at each price level relative to session maximum
Identifies LVN levels below threshold and HVN levels above threshold
3. Signal Generation :
Creates bubbles when volume activity exceeds thresholds at identified levels
Draws horizontal lines that persist until price crosses through them
💡 Note : For optimal results, increase your chart timeframe if you see too many levels. The indicator performs best on 15-minute and higher timeframes where volume patterns are more meaningful and less noisy.

Deviation between Quantity and Price - Event Contract Quantitative strategy is a strategy developed based on trading volume and price behavior, mainly to capture the deviation between trading volume strength and price behavior in the short term, and set it as a unique fixed position of two K-lines. Therefore, this strategy is only applicable to event contract trading!!!
Note: The indicators and parameters of this strategy are specifically selected for the 5-minute cycle of ETH contracts, so they are not applicable to other varieties and cycles!
This strategy combines multiple technical indicators, quantitative analysis, and market trend filters to identify high probability trading opportunities and support both long and short trades.
Its core features include:
Quantitative analysis: Focus on the surge in trading volume, and confirm market momentum through indicators such as net trading volume (OBV) and cash flow (CMF).
Price behavior: Analyze the K-line pattern (such as long/short breaks) and its entity to full range ratio to ensure the reliability of price movements.
Trend filtering: Use exponential moving averages (EMA), average trend indices (ADX), and custom benchmark moving averages (Base MA) to confirm trend direction and strength.
External market environment: Introduce Bitcoin (BTC/USDT) trend data to align with broader market sentiment.
Risk management: Manage risks through controlling position size, trading direction, and cooling off periods after losses.
Performance tracking: Provide a detailed statistical panel to monitor transaction frequency, win rate, and continuous profit/loss records.
Those who need a strategy can contact me for authorization.

US30 Stealth StrategyOnly works on US30 (CAPITALCOM) 5 Minute chart
📈 Core Concept:
This is a trend-following strategy that captures strong market continuations by entering on:
The 3rd swing in the current trend,
Confirmed by a volume-verified engulfing candle,
With adaptive SL/TP and position sizing based on risk.
🧠 Entry Logic:
✅ Trend Filter
Uses a 50-period Simple Moving Average (SMA).
Buy only if price is above SMA → Uptrend
Sell only if price is below SMA → Downtrend
✅ Swing Count Logic
For buy: Wait for the 3rd higher low
For sell: Wait for the 3rd lower high
Uses a 5-bar lookback to detect highs/lows
This ensures you’re not buying early — but after trend is confirmed with structure.
✅ Engulfing Candle Confirmation
Bullish engulfing for buys
Bearish engulfing for sells
Candle must engulf previous bar completely (body logic)
✅ Volume Filter
Current candle volume must be greater than the 20-period volume average
Ensures trades only occur with institutional participation
✅ MA Slope Filter
Requires the slope of the 50 SMA over the last 3 candles to exceed 0.1
Avoids chop or flat trends
Adds momentum confirmation to the trade
✅ Session Filter (Time Filter)
Trades only executed between:
2:00 AM to 11:00 PM Oman Time (UTC+4)
Helps avoid overnight chop and illiquidity
📊 Position Sizing & Risk Management
✅ Smart SL (Adaptive Stop Loss)
SL is based on full size of the signal candle (including wick)
But if candle is larger than 25 points, SL is cut to half the size
This prevents oversized risk from long signals during volatile moves.

The Dow Theory - Linear Regression Channel - Minor TrendI've seen many indicators using the linear regression channel. However, their main drawback is that they average price over a fixed number of candles. The channel lines themselves are based on smoothed prices and a smoothed calculation of the width.
I didn’t want to follow the same approach — I wanted something that doesn’t rely on price averages. Something that can read the market segment by segment.
So I switched to a different approach, and that’s when I discovered Dow Theory.
I began by analyzing the smallest wave that can be meaningfully studied — and this is it: the minor trend of Dow Theory.
All market phases are present, even within a minor trend.
Accumulation and distribution phases are represented by black lines, while wave up or down movements are marked with orange or blue (you can customize these colors).
Main Features:
Continuous linear regressions with no gaps. No repainting. No price smoothing used.
Customizable colors for uptrend, downtrend, and sideways phases.
Can be used to identify structure alignment across minor, intermediate, and primary trends.
Enjoy.

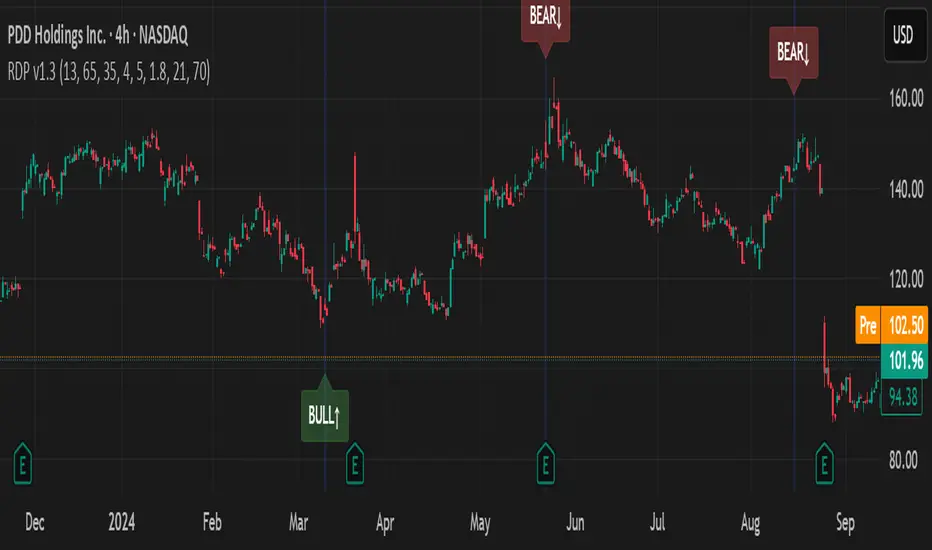
RSI Divergence Pro+ VolumeRSI Divergence Pro+ Volume
What It Does:
RSI Divergence Pro+ Volume is a non-repainting indicator that helps traders spot potential bullish and bearish reversal zones using a classic technical analysis concept—RSI divergence—combined with advanced volume confirmation. The script highlights moments when price and RSI disagree, filtering for signals only when there is a significant volume spike, which helps reduce false positives in quiet or illiquid markets.
How It Works:
Bullish Divergence: Triggered when price makes a lower low but RSI forms a higher low, suggesting possible exhaustion in selling pressure.
Bearish Divergence: Triggered when price makes a higher high but RSI forms a lower high, signaling potential buying exhaustion.
Volume Confirmation: Signals only appear when trading volume exceeds a dynamic threshold (based on a user-defined moving average and multiplier), making alerts more reliable.
Visual Features: Customizable labels and optional gradient highlights mark the exact bars where divergence with volume confirmation occurs, making signals easy to see.
Alert System: Built-in alerts for both bullish and bearish divergences so traders can receive instant notifications.
How to Use:
Apply the script to any timeframe or liquid asset (15m–4H recommended for best results).
Watch for green “BULL↑” labels below bars (bullish divergence) and red “BEAR↓” labels above bars (bearish divergence).
Blue/violet background highlights confirm volume-verified signals.
Combine with your own risk management and confirmation tools for trade entries/exits.
Adjust lookback and volume settings to match your asset and style.
Originality & Usefulness:
This indicator stands out by combining traditional RSI divergence with advanced volume filtering, giving more credible and actionable reversal alerts. All logic is non-repainting and calculated on closed bars only. Settings are fully grouped and customizable, with professional visuals for clarity.
Limitations & Disclaimers:
Not every divergence results in a major reversal—use with other analysis.
More effective in trending or volatile markets; may produce more false signals in choppy/range conditions.
Signals are generated on bar close and do not repaint.
No indicator is a substitute for proper trading discipline and risk management.
FVG Candle TYHE42This indicator highlights potential Fair Value Gaps by applying a color change to the body of the candle that aligns with an imbalance in price movement.
When such a gap is detected in the price structure, the corresponding candle is visually marked using a customizable color, allowing for easy identification without cluttering the chart.
Users can adjust the highlight color from the settings to better match their chart style or personal preference.

Previous Daily High/LowUnderstanding Previous Daily High and Low in Trading
The previous day’s high and low are critical price levels that traders use to identify potential support, resistance, and intraday trading opportunities. These levels represent the highest and lowest prices reached during the prior trading session and often act as reference points for future price action.
Why Are Previous Daily High/Low Important?
Support & Resistance Zones
The previous day’s low often acts as support (buyers defend this level).
The previous day’s high often acts as resistance (sellers defend this level).
Breakout Trading
A move above the previous high suggests bullish momentum.
A move below the previous low suggests bearish momentum.
Mean Reversion Trading
Traders fade moves toward these levels, expecting reversals.
Example: Buying near the previous low in an uptrend.
Institutional Order Flow
Market makers and algos often reference these levels for liquidity.
How to Use Previous Daily High/Low in Trading
1. Breakout Strategy
Long Entry: Price breaks & closes above previous high → bullish continuation.
Short Entry: Price breaks & closes below previous low → bearish continuation.
2. Reversal Strategy
Long at Previous Low: If price pulls back to the prior day’s low in an uptrend.
Short at Previous High: If price rallies to the prior day’s high in a downtrend.
3. Range-Bound Markets
Buy near previous low, sell near previous high if price oscillates between them.

Smart Money Gap [Algo Seeker]Introduction – Originality and usefulness
It is important for traders to diversify their strategies, and having a few approaches for different situations is key to increasing their odds of success.
These days, substantial information and important events happen so fast and so often that all the noise created afterward makes people forget the events that were actually worth remembering.
The same can be said about trading and investing. Every day, there seems to be something new happening and new price action unfolding, which can make it difficult for traders to filter out the noise and stay focused on relevant events. But for every problem, a solution can be born.
🟠 Unique Features & Trading Benefits
The SMG aims to be a system that helps traders filter out what it deems to be irrelevant noise and stay focused on what matters most. In addition, SMG provides multiple plans and ways to act on that information.
The reason it’s called “Smart Money Gap” is because this algorithm is designed to identify the most relevant price action—whether it's earnings, an economic calendar event, a stock-specific development, major news, or institutional activity. It determines which of these situations is the most current and relevant, and it keeps the focus on that. This means that day in and day out, traders and investors can rely on a consistent plan and framework that is automatically drawn up for them, helping them trade with confidence that they’re acting on meaningful price levels. When the algorithm identifies a new event as more important, it will switch focus and build a new system around that.
SMG also goes a step further—it understands that different types of traders, such as scalpers, swing traders, or investors, have different time horizons and risk tolerance regarding how long they plan to hold a position and how much space and time they are willing to give a move. With that in mind, SMG provides different trading modes for these personas, selecting events that match the criteria needed for that specific trader.
For instance, a scalper may benefit from a smaller, more recent event that provides quick entry and exit opportunities—whereas an investor might focus on something more significant and long-term. SMG takes this into consideration and builds its entire framework accordingly.
🟠 Description of the Unique SMG (Continued) – How It Works Together as One System
The true power of SMG begins once a relevant event is identified, and the entire system is automatically displayed on the user’s chart. From that single event, SMG generates a structured framework that produces three distinct strategies. Each of these strategies takes inspiration from fundamentals within trading but gives it our own unique twist inside the SMG system. These strategies can be used individually or in combination, depending on the trader’s style and market context.
🟢 1. Filling the Smart Money Gap
One of the key opportunities is to trade the SMG itself—the “gap” created by the specific event. Gap fills are a strategy that traders and investors like to use. SMG continuously tracks how much of this unique gap has been filled, so users are never confused about how much remains. They can reference the shaded region or the percentage-left box for clarity.
🟢 2. Targeting SMG-Based Extensions and Retracements
When the SMG zone is created, the algorithm simultaneously generates extension and retracement levels tied to that event. These levels remain anchored to the original structure, providing consistent, event-driven targets. Unlike the constantly redrawn lines many traders adjust throughout the day, these levels stay fixed and reflect meaningful price action—not noise.
🟢 3. Executing Trades Based on SMG Volume
Because SMGs are tied to meaningful events, they often remain valid for an extended time. This is where Anchored VWAP becomes critical. From the moment the event occurs, SMG begins calculating volume-based data. The longer the event goes unchanged, the more powerful and influential the Anchored VWAP and its deviation bands become—due to the increasing accumulation of volume over time. These volume layers not only help refine entries and exits—they also serve as additional points of confluence where traders can place stops, take profits, or re-enter trades with greater context and confidence.
In conclusion:
SMG is designed to help traders diversify their portfolio of strategies even further. It creates an entire system that filters out noise and builds a strategy around a key event—and it will stay focused on that event until another becomes more relevant. SMG gives traders the ability to react calmly, with a plan that is automatically laid out for them. This is a special algorithm that we’ve incorporated into our approach for over three years, and we hope users will find it to be a valuable aid in their trading journey.
🟠 How to Use
Initial Setup
🟢 1. Select Trading Mode:
Choose from six built-in personas—Scalp 1, Scalp 2, Swing 1, Swing 2, Invest 1, and Invest 2—based on your trading style. Each persona adjusts the SMG logic to fit the risk profile and time horizon of that specific persona.
1. Scalp: For intraday movements (minutes to hours)
• Best used on faster charts (1-minute to 30-minute)
2. Swing: For medium-term positions (days to weeks)
• Best used on 1-hour to daily charts
3. Investor: For longer-term positions (weeks to months)
• Best used on 1-hour to daily charts
🟢 2. Choose SMG Update Behavior: Bar Close vs Live Update:
By default, SMG waits until all conditions are met and the bar closes before updating. This ensures confirmed structure and helps avoid noise or repainting.
If “Update Before Bar Closes?” is selected, the algorithm updates as soon as all conditions are met — even if the bar hasn’t closed yet. This allows earlier updates but may result in elements that repaint if the conditions don’t hold through the close.
Keep this setting unchecked if you prefer confirmed, non-repainting elements.
🟢 3. Visual Customization:
Customize the appearance of SMG zones, extension labels, and volume-derived levels via the “SMG Zone” and “Anchored VWAP” settings groups. This includes:
1. Zone colors and opacity
2. Label positions
3. Retracement display toggle
4. Anchored VWAP and ±1, ±2, ±3 deviation bands
Extra Notes on User Customization:
• Bull Box Color – the color used when SMG retracement is active
• Final Bull Box Color – the color used when SMG retracement is finished
• Same logic applies to Bear Box Color and Final Bear Box Color
• Retracement % Label – If the label is hard to see, it may be overlapping with the Fib labels depending on your chart zoom. To adjust, bring the Retracement % Label Indent closer to 1 to shift it left. Then increase the Fib Label Indent value to move those labels further right.
🟠 Strategic Execution
Strategy Usage Example
🟢 1. Entry & Exit Tactics Within the SMG
Use the shaded Smart Money Gap as a decision-making framework. Traders may choose to:
1. Fade a retracement (shorting or exiting as price retraces into the SMG)
2. Enter on signs of continuation (rejoining the move after a partial retrace)
3. Wait for the gap to fill completely and reverse
Volume-weighted Anchored VWAP levels add an additional layer—helping assess whether price is entering or rejecting volume consensus zones.
🟢 2. Extension Targeting:
When price resumes in the original direction, SMG plots potential extension levels. These can be used to:
1 Set take-profit or stop-loss targets
2. Spot exhaustion areas
3 Evaluate whether to scale in, take partial profits, or re-enter a position
🟢 3. Volume-Based Execution via Anchored VWAP:
For traders looking to incorporate volume into execution—especially when an SMG has remained active for an extended period—Anchored VWAP and its deviation bands can be used to:
1. Confirm direction or momentum via VWAP slope and interaction
2. Enter or fade positions at volume-backed levels
3. Set dynamic entries or exits as volume builds or thins across deviations
⚠️Optional Update Behavior: Bar Close vs Live Update
By default, SMG waits until all conditions are met and the bar closes before updating. This ensures confirmed structure and helps avoid noise or repainting.
If “Update Before Bar Closes?” is selected, the algorithm updates as soon as all conditions are met — even if the bar hasn’t closed yet. This allows earlier updates but may result in elements that repaint if the conditions don’t hold through the close.
Keep this setting unchecked if you prefer confirmed, non-repainting elements.
⚠️ Interpreting Anchored VWAP Behavior
Anchored VWAP and its deviation bands become more relevant with time as they widen and separate. While tight and accumulating near price, it may be worth holding off on using VWAP for entries or exits until expansion begins.
🟠 Additional Description – SMG Table Overview
The SMG table presents four key pieces of information to help traders quickly understand the current setup at a glance:
1) If the Algo is set for dynamic or bar close
2) Which trading mode they currently have selected
3) What type of SMG gap is displayed
4) how much of the Retracement is done
🟠 Additional Benefits:
🟢 1. Risk Profile Options
Trading personas allow users to instantly switch between different risk profiles—Scalp, Swing, or Investor—at the click of a button. This helps traders quickly align the system to their preferred holding period and risk tolerance without reconfiguring inputs.
🟢 2. Time Efficiency
SMG saves traders time by creating a complete system around each Smart Money Gap. From gap logic to retracement tracking, extension targets, and volume levels—everything needed to trade the SMG is generated at once, eliminating the need for manual setup or separate tools.
The Smart Money Gap represents years of development and refinement aimed at creating a unified, event-driven trading system. It was designed to help traders manage through the constant noise of the market, and we hope that traders benefit from having an additional tool to support and diversify their trading strategy.

80% Rule Indicator (ETH Session + SVP Prior Session)I created this script to show the 80% opportunity on chart if setting lines up.
"80% rule: Open outside the vah or Val. Spend 30 mins outside there then break back inside spend 15 mins below or above depending which way u broke. Then come back and retest the vah/val and take it to the poc as a first target with the final target being the other Val/vah "
📌 Script Summary
The "80% Rule Indicator (ETH Session + SVP Prior Session)" overlays your chart with prior session value area levels (VAH, VAL, and POC) calculated from extended-hours 30-minute data. It tracks when the price reenters the value area and confirms 80% Rule setups during your chosen trading session. You can optionally trigger alerts, show/hide market sessions, and fine-tune line appearance for a clean, modular workflow.
⚙️ Options & Settings Breakdown
- Use 24-Hour Session (All Markets)
When checked, the indicator ignores time zones and tracks signals during a full 24-hour period (0000-0000), helpful if you're outside U.S. trading hours or want consistent behavior globally.
- Market Session
Dropdown to select one of three key market zones:
- New York (09:30–16:00 ET)
- London (08:00–16:30 local)
- Tokyo (09:00–15:00 local)
Used to gate entry signals during relevant hours unless you choose the 24-hour option.
- Show PD VAH/VAL/POC Lines
Toggle to show or hide prior day’s levels (based on the 30-min extended session). Turning this off removes both the lines and their white text labels.
- Extend Lines Right
When enabled, the VAH/VAL/POC lines extend into the current day’s session. If disabled, they appear only at their anchor point.
- Highlight Selected Session
Adds a soft blue background to help visualize the active session you selected.
- Enable Alert Conditions
Allows TradingView alerts to be created for long/short 80% Rule entries.
- Enable Audible Alerts
Plays an in-chart sound with a popup message (“80% Rule LONG” or “SHORT”) when signals trigger. Requires the chart to be active and sounds enabled in TradingView.
