Bitcoin - Downtrend will continue to 109,000! Alt-season OctoberBitcoin and altcoins have been crashing in the past 2 weeks! Is there any hope for a bull market, or has the bullish cycle ended? In this analysis I will tell you my personal opinion, and if you haven't seen my previous very successful analysis on Bitcoin, you can do it right now! Because it's highl
About Bitcoin / Tether USD
Bitcoin, the first and most popular cryptocurrency, is known for its price volatility driven by institutional demand, regulations, and global events, while Tether (USDT) is widely used as a stable trading pair to avoid converting back to fiat. Together, Bitcoin and Tether play a central role in crypto markets, with Tether’s stability supporting Bitcoin trading and influencing investor behavior.
Related pairs

Bitcoin Monthly Update + Top Altcoins Choice, Your PickThis is a monthly Bitcoin chart and is really interesting, it supports without a shadow of doubt a strong continuation and bullish bias.
First, the month started red but is now green. This is always a strong signal when the action starts bad but recovers quickly during the month just to end up good

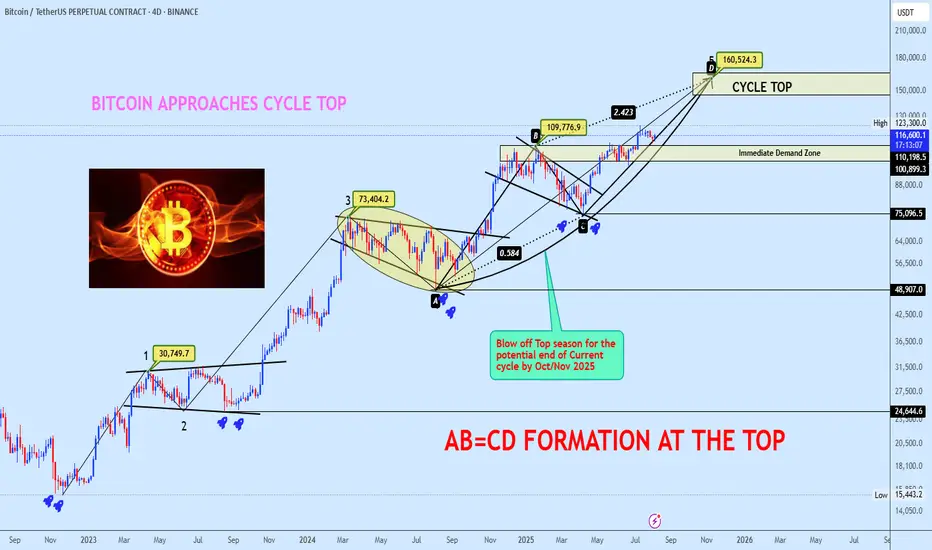
Bitcoin Approaches Cycle Top with AB=CD Completion in SightBTCUSDT continues its bullish macro structure, now advancing towards the projected cycle top zone at $160,524, completing a textbook AB=CD harmonic formation. The BC leg retraced precisely 0.584 of AB, aligning with a 2.423 CD extension, confirming a strong harmonic symmetry.
Price is currently tra
TradeCityPro | Bitcoin Daily Analysis #145👋 Welcome to TradeCity Pro!
Let’s get into Bitcoin analysis. Yesterday, Bitcoin was rejected from the zone I had mentioned, and today it will probably begin its new downward move.
⏳ 4-Hour Timeframe
In yesterday’s analysis, I told you that a pullback to SMA25 and the 0.5 Fibonacci zone was possible

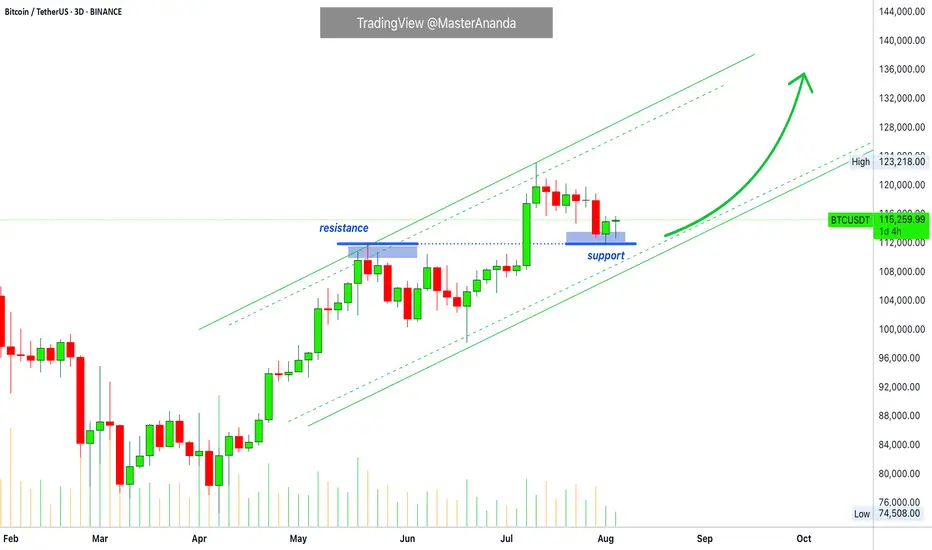
Bitcoin Update • Resistance Turned Support · TOP Altcoins ChoiceTraders hedge for a Bitcoin drop below $100,000?
Meanwhile, Bitcoin is rising trading above 115K. Resistance turned support.
The last all-time high turned out to work as support this time.
The retrace from 123,000 to 115,000 amounts to a 6.5% decline, which simply means that Bitcoin is trading at
Bitcoin Near $125K Resistance — Is the Rally Over?Bitcoin ( BINANCE:BTCUSDT ) increased to $120,000 after breaking resistances , as I expected in my previous idea .
Bitcoin has already managed to break the Resistance zone($121,000-$119,000) and is moving near the Potential Reversal Zone(PRZ) .
According to Elliott Wave theory , Bitcoin

BTC - Short Setup at 0.702 Fibonacci & Fair Value GapMarket Context
Bitcoin recently rejected from a major resistance area and has since been retracing downward, finding temporary support inside a bullish Fair Value Gap. The market is currently in a corrective phase, with buyers attempting to defend lower levels while sellers look for optimal positio

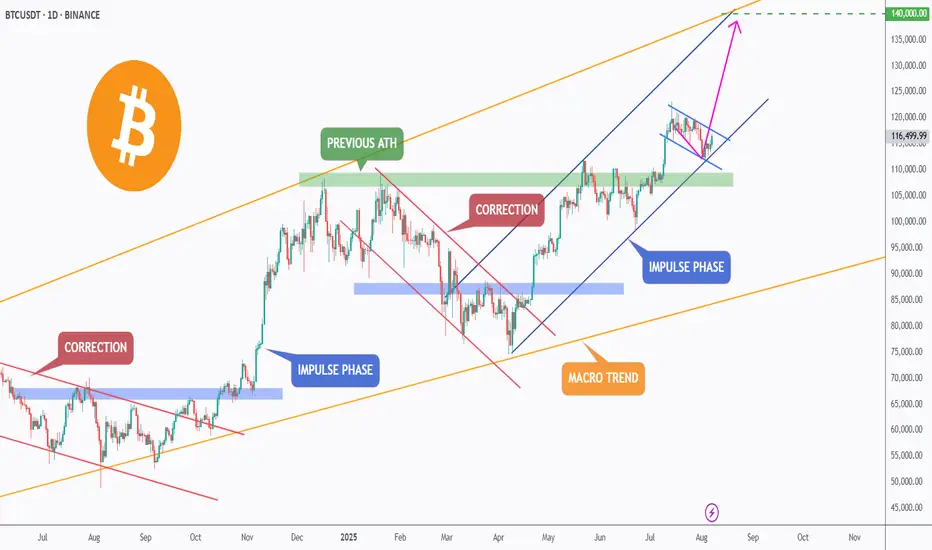
BTC – Breakout Loading?Bitcoin continues to respect its macro bullish trend (🟠), trading within a large ascending channel that has guided price action for over a year.
After breaking above the previous ATH 🟢, BTC entered a correction phase 🔻, retesting the green zone — a key structure now acting as support.
The bulls s
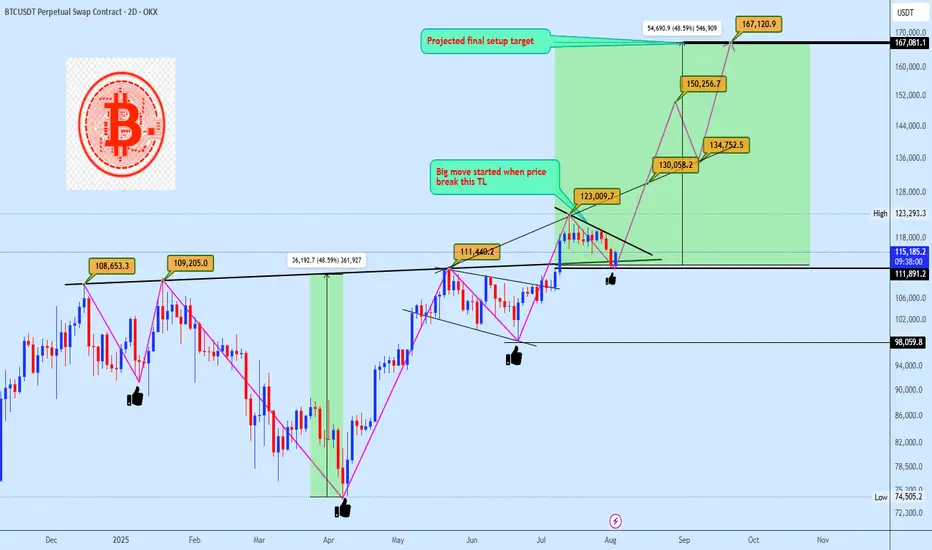
Bitcoin Preparing for Explosive Breakout Toward $167KBitcoin is currently respecting a clean trendline resistance following a bullish pennant formation. Price is holding firmly above the neckline breakout from the inverse head and shoulders (ISHS), confirming demand strength around the $111K–$113K region. The structure implies another 48% rally projec
BITCOIN → Retest of resistance in the bearish trading rangeBINANCE:BTCUSDT.P is consolidating in the range of 115,600 - 113,500. The price is testing resistance, relative to which a huge pool of liquidity has formed, which bears are likely to defend quite aggressively...
Idea from July 22: expectation of a decline from 120K to 112K. Target achieved

See all ideas
Summarizing what the indicators are suggesting.
Oscillators
Neutral
SellBuy
Strong sellStrong buy
Strong sellSellNeutralBuyStrong buy
Oscillators
Neutral
SellBuy
Strong sellStrong buy
Strong sellSellNeutralBuyStrong buy
Summary
Neutral
SellBuy
Strong sellStrong buy
Strong sellSellNeutralBuyStrong buy
Summary
Neutral
SellBuy
Strong sellStrong buy
Strong sellSellNeutralBuyStrong buy
Summary
Neutral
SellBuy
Strong sellStrong buy
Strong sellSellNeutralBuyStrong buy
Moving Averages
Neutral
SellBuy
Strong sellStrong buy
Strong sellSellNeutralBuyStrong buy
Moving Averages
Neutral
SellBuy
Strong sellStrong buy
Strong sellSellNeutralBuyStrong buy
Displays a symbol's price movements over previous years to identify recurring trends.
Frequently Asked Questions
The current price of Bitcoin / Tether USD (BTC) is 119,920.00 USDT — it has fallen −0.88% in the past 24 hours. Try placing this info into the context by checking out what coins are also gaining and losing at the moment and seeing BTC price chart.
Bitcoin / Tether USD price has risen by 3.87% over the last week, its month performance shows a 1.84% increase, and as for the last year, Bitcoin / Tether USD has increased by 99.18%. See more dynamics on BTC price chart.
Keep track of coins' changes with our Crypto Coins Heatmap.
Keep track of coins' changes with our Crypto Coins Heatmap.
Bitcoin / Tether USD (BTC) reached its highest price on Jul 14, 2025 — it amounted to 123,195.96 USDT. Find more insights on the BTC price chart.
See the list of crypto gainers and choose what best fits your strategy.
See the list of crypto gainers and choose what best fits your strategy.
Bitcoin / Tether USD (BTC) reached the lowest price of 3,155.00 USDT on Dec 15, 2018. View more Bitcoin / Tether USD dynamics on the price chart.
See the list of crypto losers to find unexpected opportunities.
See the list of crypto losers to find unexpected opportunities.
The safest choice when buying BTC is to go to a well-known crypto exchange. Some of the popular names are Binance, Coinbase, Kraken. But you'll have to find a reliable broker and create an account first. You can trade BTC right from TradingView charts — just choose a broker and connect to your account.
Crypto markets are famous for their volatility, so one should study all the available stats before adding crypto assets to their portfolio. Very often it's technical analysis that comes in handy. We prepared technical ratings for Bitcoin / Tether USD (BTC): today its technical analysis shows the buy signal, and according to the 1 week rating BTC shows the strong buy signal. And you'd better dig deeper and study 1 month rating too — it's buy. Find inspiration in Bitcoin / Tether USD trading ideas and keep track of what's moving crypto markets with our crypto news feed.
Bitcoin / Tether USD (BTC) is just as reliable as any other crypto asset — this corner of the world market is highly volatile. Today, for instance, Bitcoin / Tether USD is estimated as 0.95% volatile. The only thing it means is that you must prepare and examine all available information before making a decision. And if you're not sure about Bitcoin / Tether USD, you can find more inspiration in our curated watchlists.
You can discuss Bitcoin / Tether USD (BTC) with other users in our public chats, Minds or in the comments to Ideas.