Bitcoin - Downtrend will continue to 109,000! Alt-season OctoberBitcoin and altcoins have been crashing in the past 2 weeks! Is there any hope for a bull market, or has the bullish cycle ended? In this analysis I will tell you my personal opinion, and if you haven't seen my previous very successful analysis on Bitcoin, you can do it right now! Because it's highly informative, and it can open your closed eyes.
In short, Bitcoin just recently hit the long-term trendline from 2017 - 2021 - 2025, and yes, the market reacted to this trendline and dropped as expected. Because this is a major trendline, we have to expect a strong reaction. I still think the market needs to go lower in the short term because there is an unfilled FVG at 109k, so closing this gap would be appreciated. This GAP is also a strong support because it's in a confluence with this blue parallel channel, and the upward-sloping trendline definitely acts as a support. In the short term we should see a bounce from this trendline.
You probably saw that Ethereum massively pumped, and some specific altcoins as well. We saw a short-term alt season, there is no doubt about it, but will this altcoin season continue or not? Currently I do not see a bottom on altcoins, so BTC.D should go up in the short-term and mid-term, but in October/November/December I think that would be a very good time to buy some altcoins for the upcoming alt season!
Write a comment with your altcoin + hit the like button, and I will make an analysis for you in response. Trading is not hard if you have a good coach! This is not a trade setup, as there is no stop-loss or profit target. I share my trades privately. Thank you, and I wish you successful trades!
BTCUSDT trade ideas

Bitcoin Monthly Update + Top Altcoins Choice, Your PickThis is a monthly Bitcoin chart and is really interesting, it supports without a shadow of doubt a strong continuation and bullish bias.
First, the month started red but is now green. This is always a strong signal when the action starts bad but recovers quickly during the month just to end up good. Starts red to end up closing green.
Bitcoin also closed four consecutive months green. This one will be the fifth month. Since the bears already gave everything trying to push prices lower and failed, we know higher prices are guaranteed next.
We also know this because Ethereum just hit its highest price since December 2021, near the top of the last bull market. Now we have Bitcoin, XRP and Ethereum, the top three Cryptos and the biggest projects, moving forward and doing great.
It is only natural. It is the logical sequence, the smaller pairs/projects will do the exact same.
Just as XRP gained in bullish momentum and hit a new all-time high, to follow Bitcoin, Ether did the same. Then we have Solana and Cardano, Dogecoin, Toncoin, Polkadot, Shiba Inu, Avalanche, Notcoin, Chainlink, Bitcoin Cash, Uniswap and the rest.
They are preparing to grow now and are bullish now. Ready to grow and strong.
No more retraces, no more corrections; the 2025 bull market wave & bull run is getting close.
The next immediate target is $137,206. Notice how the $122,630 target on this chart was hit perfectly. So these numbers are good and work long-term.
» After $137,206, Bitcoin is set to hit $155,000.
(Leave a comment with your Top Altcoins Choice, I will do an analysis for you!)
Thank you for reading.
Namaste.

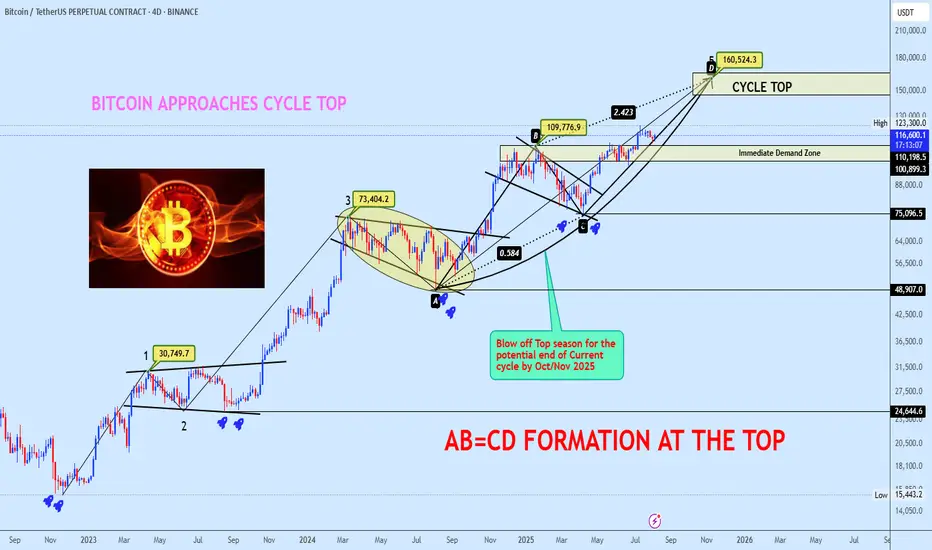
Bitcoin Approaches Cycle Top with AB=CD Completion in SightBTCUSDT continues its bullish macro structure, now advancing towards the projected cycle top zone at $160,524, completing a textbook AB=CD harmonic formation. The BC leg retraced precisely 0.584 of AB, aligning with a 2.423 CD extension, confirming a strong harmonic symmetry.
Price is currently trading around $116,569 after breaking through key resistance levels, with the Immediate Demand Zone resting at $110,198. This zone will act as the first major defense level if a short-term correction occurs.
Market structure suggests a potential blow-off top formation into October/November 2025, marking the probable end of the current cycle. Do check out our Bitcoin lifecycle thread for clarity on the reason for picking cycle top.
POTENTIAL BITCOIN LIFECYCLE
Deciphering Bitcoin's Cyclical Trends & Phases
Momentum remains firmly bullish, with the upward curve indicating buyers remain in control until exhaustion patterns emerge near the cycle projection zone.
Plan: Hold long positions into strength, scale out as BTC approaches the $160K cycle top zone, and prepare for a potential macro reversal as the cycle matures. Monitor lower timeframes for divergence signals as we approach the final leg.
If this structure aligns with your outlook, feel free to share your thoughts in the comments.
You’re also welcome to drop your preferred altcoins for a quick technical review.
Bitcoin Near $125K Resistance — Is the Rally Over?Bitcoin ( BINANCE:BTCUSDT ) increased to $120,000 after breaking resistances , as I expected in my previous idea .
Bitcoin has already managed to break the Resistance zone($121,000-$119,000) and is moving near the Potential Reversal Zone(PRZ) .
According to Elliott Wave theory , Bitcoin is completing the 5th major impulse wave . In my opinion, this is the last bullish wave of Bitcoin, and after that we should wait for the main correction of Bitcoin . Do you agree with me that it is time to run and take profit!?
To get a better view of the main waves , I suggest you look at the idea below .
Also, since Bitcoin is correlated with the S&P500 Index ( SP:SPX ) and since I also foresee the possibility of a correction in the S&P500 Index, it is also possible to expect a decrease in the price of Bitcoin based on the S&P500 Index analysis .
I expect Bitcoin to start declining after entering the Cumulative Short Liquidation Leverage($125,000-$122,580) and Potential Reversal Zone(PRZ) and at least fill the CME Gap($119,100-$117,425) .
Note: There are heavy sell orders around $125,000.
Cumulative Long Liquidation Leverage: $120,866-$119,442
Cumulative Long Liquidation Leverage: $117,743-$115,452
What is your opinion on Bitcoin and its trend? Can it see $130,000, or will a main correction begin?
Please respect each other's ideas and express them politely if you agree or disagree.
Bitcoin Analyze (BTCUSDT), 2-hour time frame.
Be sure to follow the updated ideas.
Do not forget to put a Stop loss for your positions (For every position you want to open).
Please follow your strategy and updates; this is just my Idea, and I will gladly see your ideas in this post.
Please do not forget the ✅' like '✅ button 🙏😊 & Share it with your friends; thanks, and Trade safe.

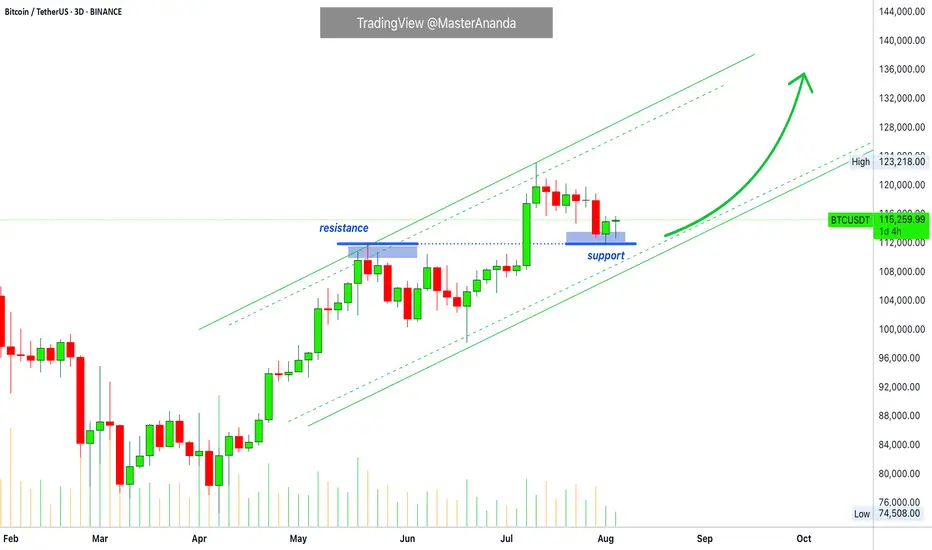
Bitcoin Update • Resistance Turned Support · TOP Altcoins ChoiceTraders hedge for a Bitcoin drop below $100,000?
Meanwhile, Bitcoin is rising trading above 115K. Resistance turned support.
The last all-time high turned out to work as support this time.
The retrace from 123,000 to 115,000 amounts to a 6.5% decline, which simply means that Bitcoin is trading at or near resistance. Staying close to resistance after a new all-time high is major signal of strength. A bearish signal would only become real if a high volume drop develops or Bitcoin closes weekly below 110,000. This isn't happening right now so the bulls win.
Are you a bull? You win.
I am a bull. I win.
👉 As Bitcoin continues bullish the altcoins market will continue to grow. Knowing this, which one is your Top Altcoin Choice ?
👉 Leave a comment with your favorite altcoin.
I will do a full analysis for you and publish in my profile.
If the chart doesn't look great, I might reply right here in the comments section.
Thanks a lot for the continued support. It is appreciated.
Let's play again.
Let's trade again.
Together we can win.
Success, profits and growth long-term.
Namaste.
BTC/USD 1h chart Pateern.From this updated chart, "TARGET POINT" label more clearly.
The horizontal green box you marked is roughly between $122,000 and $123,000 (though this seems like a different scale—possibly a derivative or index, not direct BTC price in USD).
The price is breaking above the descending trendline and heading toward that high-volume resistance zone.
The main targets I see from your own chart markings are:
First target: around $118,991 (blue label) — likely the nearest resistance.
Second target: around $120,137 (yellow label) — next key high-volume node.
Final target (your green box): around $122,000–$123,000.
These seem to be based on volume profile gaps and resistance levels.

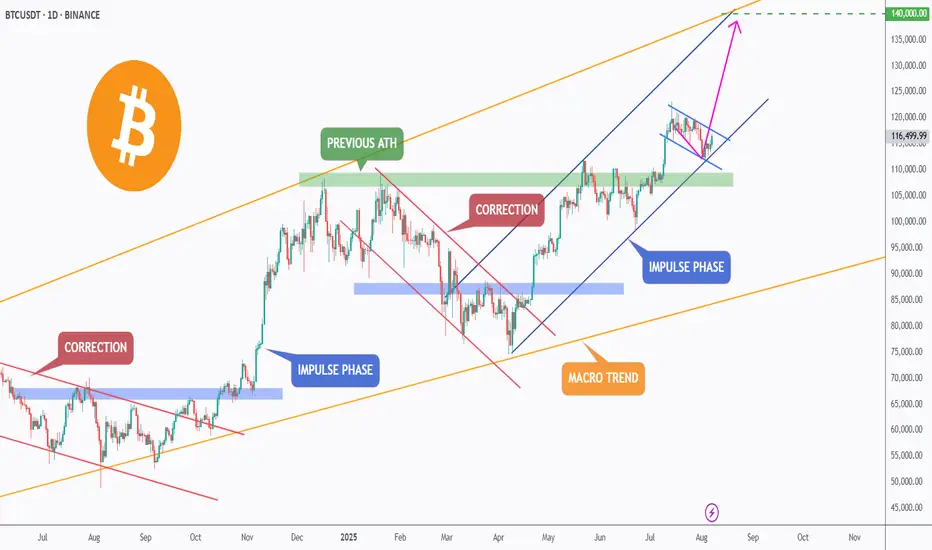
BTC – Breakout Loading?Bitcoin continues to respect its macro bullish trend (🟠), trading within a large ascending channel that has guided price action for over a year.
After breaking above the previous ATH 🟢, BTC entered a correction phase 🔻, retesting the green zone — a key structure now acting as support.
The bulls stepped back in, initiating a new impulse phase 🔵. Currently, BTC is consolidating within a small blue descending channel — forming a classic bullish flag 🏁 pattern.
⚠️ For the bulls to take over and trigger the next impulsive wave toward $140,000 🎯, we need to see a confirmed break above this small blue channel. This would signal trend continuation and open the door to the upper boundary of the macro channel.
✅ Key levels to watch:
- Support: ~$110,000 (green demand zone) 🟩
- Resistance: Top of the blue flag 🟦
- Target: $140,000 💰
A breakout from here could fuel the next major rally — stay sharp and follow the trend!
💬 What’s your bias here? Are you bullish or waiting for a deeper pullback?
📚 Always follow your trading plan regarding entry, risk management, and trade management.
Good luck!
All Strategies Are Good; If Managed Properly!
~Richard Nasr
Mistakes Cost Real Money, In trading world In the crypto market, a mistake is not just a note on paper, it’s money leaving your pocket.
Sometimes you need to lose money to feel the real lesson.
If you learn from it, that loss can make you a better trader.
Hello✌️
Spend 2 minutes ⏰ reading this educational material.
🎯 Analytical Insight on Bitcoin:
BINANCE:BTCUSDT is showing strong volume near solid daily support and a key trendline. A 5% rally toward $124k is anticipated 🚀📈
Now , let's dive into the educational section,
💸 Mistakes You Must Make
Some mistakes are part of the process.
When you hit a stop loss or see a big loss, you understand risk much better.
These mistakes show you why you must always have a plan.
Lessons from losing real money stay in your mind much longer than lessons from books or videos.
🔍 Risk Management and Fundamental Researc h
Spot trading gives you more time to fix mistakes than futures, but losing money here can still teach you a lot.
When you lose some of your capital, you see why stop loss and take profit are important.
Researching the team, roadmap, and trading volume can save you from bad projects.
Managing your capital makes sure one bad trade doesn’t destroy your account.
🪞 How Market Emotions Affect You
Your emotions often reflect the overall mood of the market.
When everyone is greedy, you may feel unjustifiably excited.
When everyone is fearful, you might miss great opportunities.
Learning to separate your mind from crowd emotions is one of the hardest yet most crucial skills.
🧠 Demo Account vs Real Account
In a demo account, you are only playing with numbers.
In a real account, you are dealing with your own emotions, fear, and greed.
When real money is involved, even a small price move can make your heart race.
This is why, after learning and practicing for months, you should start real trading with very small money.
Only then will you know what risk feels like in real life.
🕰 Why Patience Matters
Many losses happen because of rushing, not because of a bad strategy.
Sometimes waiting a few more minutes can give you a clear view of the market.
The market always gives another chance, but lost money is hard to get back.
🎯 Why You Need a Trading Journal
Writing down your entry, exit, and feelings for every trade helps you see your mistakes and strengths.
A trading journal is like a second memory that stops you from making the same mistake again.
📊 Useful Tools in TradingView
One of TradingView’s biggest advantages for traders is its set of tools that can save you from costly mistakes.
For example, with the Price Alert tool, you can get notified before the price reaches critical levels, helping you avoid emotional decisions.
Indicators like the Relative Strength Index (RSI) or Moving Average Convergence Divergence (MACD) help you detect weaknesses in your strategy before execution.
Drawing support and resistance lines repeatedly trains you to know where price might reverse in a crisis.
Fibonacci Retracement is an excellent way to spot potential reversal levels, especially during unexpected corrections.
Volume Profile shows where the highest buying and selling activity has occurred, helping you avoid weak entry zones.
⚖️ Balance Between Learning and Doing
Reading books or watching videos is not enough.
Trading without knowledge is also dangerous.
You must grow your knowledge and experience at the same time.
Summary
In crypto trading, mistakes are normal, but repeating them is your choice.
If you learn from a loss, it is worth it.
Start small, use your tools, and let experience make you stronger.
✨ Need a little love!
We pour love into every post your support keeps us inspired! 💛 Don’t be shy, we’d love to hear from you on comments. Big thanks , Mad Whale 🐋
📜Please make sure to do your own research before investing, and review the disclaimer provided at the end of each post.

BITCOIN → Retest of resistance in the bearish trading rangeBINANCE:BTCUSDT.P is consolidating in the range of 115,600 - 113,500. The price is testing resistance, relative to which a huge pool of liquidity has formed, which bears are likely to defend quite aggressively...
Idea from July 22: expectation of a decline from 120K to 112K. Target achieved
Bitcoin is correcting on D1, the price previously broke through the support level of 115650 and formed another trading range, with the previously broken lower boundary of the consolidation acting as resistance. The market has not yet tested the zones of interest at 110K and 105K, and therefore the possibility of a further decline remains relevant. A liquidity pool has formed relative to the resistance of the trading range at 115678. There is a high probability of a short squeeze before the decline.
Resistance levels: 115678, 116370
Support levels: 113530, 112660, 110K
In the short term, I expect a retest of resistance and a capture of liquidity. If the market is unable to continue its upward momentum and returns the price below the level, a false breakout will form, which may trigger a decline to the indicated areas of interest.
Best regards, R. Linda!

Bitcoin’s Triple Bullish Pole Sequence Next Stop $184K+? Bitcoin’s long-term bull run is unstoppable, powered by a sequence of bullish flag and pole formations. The first pole delivered $63K. The second is still in play, aiming at $198K. The third, born after a breakout above its own flag and the all time high, now eyes $184K with price cruising above $121K.
Since late 2023, a rock solid ascending trendline has been the market’s backbone, holding as dynamic support through every pullback. The immediate demand zone is your prime reload spot if price dips, while the main demand zone is a fortress level support for future positioning.
Momentum is strong, structure is flawless, and the path toward those pole targets remains wide open as long as support holds.
Now’s the time let’s ride this bullish wave! Drop your altcoin requests in the comments like we always do, and smash that like button to keep the energy flowing. 🚀

#BTC #BTCUSD #BTCUSDT #BITCOIN #Analysis #Eddy#BTC #BTCUSD #BTCUSDT #BITCOIN #Analysis #Eddy
I have identified the important supply and demand zones of the higher timeframe for you.
This analysis is based on a combination of different styles, including the volume style with the ict style.
Based on your strategy and style, get the necessary confirmations for this analysis to enter the trade.
Don't forget about risk and capital management.
The responsibility for the transaction is yours and I have no responsibility for your failure to comply with your risk and capital management.
💬 Note: This is just a possibility And this analysis, like many other analyses, may be violated. Given the specific circumstances of Bitcoin, it is not possible to say with certainty that this will happen, and this is just a view based on the ICT style and strategy with other analytical styles, including the liquidity style. (( The fall of Bitcoin may not change the trend of altcoins and money will move out of Bitcoin and into altcoins, and we will see altcoins grow. ))
Be successful and profitable.

BTC Tries To Start Another Upward MoveBTC Tries To Start Another Upward Move
Bitcoin is making another push to start a bullish trend.
This setup was shared earlier, but now BTC has expanded into a larger bullish pattern.
BTC is trying to rise again. If the current breakout holds, we could see further upside, as shown in the chart.
The first key target is around 122,650, a crucial level.
If BTC breaks through this zone, the upward move could continue toward 126,200 and then 130,000.
You may find more details in the chart!
Thank you and Good Luck!
PS: Please support with a like or comment if you find this analysis useful for your trading day

TradeCityPro | Bitcoin Daily Analysis #147👋 Welcome to TradeCity Pro!
Let’s dive into Bitcoin. Today, Bitcoin has made an upward move and is triggering our setups.
⏳ 4-Hour Timeframe
In the 4-hour timeframe, Bitcoin made a bullish move today and activated the trigger I had previously shared with you in the 1-hour timeframe analysis. It has now reached the 116000 zone.
✔️ After breaking above the SMA25, the price has now reached the SMA99, which is forming a PRZ with the 116000 area. At the same time, RSI has reached its resistance zone, and rejection from here could work against this bullish leg.
⭐ On the other hand, the bullish momentum and buyer strength are very strong. The volume of the last two candles strongly favors the buyers, and considering the upward trend in the higher cycles, the probability of breaking the 116000 zone has increased.
📊 If this zone is broken, we can open a long position. The next resistances are 120000 and 122000. I’ll open this position with a wide stop so that it averages with our previous entry. If the market moves up, the position will carry more volume.
✨ In case of rejection from this 116000 zone, the main support trigger we have is 112233. As long as the price doesn’t fall below this area, we can still consider Bitcoin in an uptrend.
⏳ 1-Hour Timeframe
The trigger we had in the 1-hour timeframe was the 115327 zone. I mentioned that if the price touches it once, forms a higher low, and then breaks it, we can open a position on the next breakout.
🔍 That’s exactly what happened. Yesterday, the price hit it once and registered a higher low, but the candle that broke 115327 wasn’t ideal for entry — it was better suited for a stop-buy strategy.
📈 I didn’t open this position myself because I had mentioned that I wasn't actively trading in the 110000-116000 range, so I didn’t place a stop-buy.
💥 Now the price has entered the zone. If we get a pullback, we can open a long position in the next upward wave, which I think is a very good trigger.
🥸 However, since the RSI has entered the Overbuy zone, there's also a chance that this leg may continue without a pullback. In that case, we can use other strategies like candle setups to enter the market.
❌ Disclaimer ❌
Trading futures is highly risky and dangerous. If you're not an expert, these triggers may not be suitable for you. You should first learn risk and capital management. You can also use the educational content from this channel.
Finally, these triggers reflect my personal opinions on price action, and the market may move completely against this analysis. So, do your own research before opening any position.

TradeCityPro | Bitcoin Daily Analysis #146👋 Welcome to TradeCity Pro!
Let’s dive into Bitcoin analysis. In this analysis, I want to take a look at the higher timeframes since conditions in the lower timeframes haven't changed much compared to yesterday, and it’s a good idea to review the broader picture.
📅 Daily Timeframe
In this timeframe, after the completion of the previous corrective leg that extended to the 78,000 zone, Bitcoin started a new uptrend and has managed to climb up to the 122,000 area.
💥 The most important resistance during this move was 110,183, which, as you can see, has been broken, and Bitcoin is still holding above this level.
✔️ The curved trendline we've drawn in the higher timeframes has been broken in this timeframe, but in my view, confirmation of this trendline break comes only after the 110,183 level is broken again to the downside.
⚡️ Currently, the RSI oscillator is sitting on a support level around 38.21. This area is a very important momentum zone for Bitcoin, and if it breaks, the likelihood of downward momentum entering the market increases.
🧩 However, we still need more confirmations for a bearish scenario, and breaking this level on the RSI alone does not confirm a trend reversal.
🔽 If the correction continues, the main support we currently have is at 110,183. The SMA99 also acts as a dynamic support and, if it overlaps with 110,183, will form a very strong PRZ (Potential Reversal Zone).
📈 If the uptrend wants to resume from here, the first trigger confirming trend continuation is the 120,000 high — and breaking the range between 120,000 and 122,000 will start the next bullish leg.
❌ Disclaimer ❌
Trading futures is highly risky and dangerous. If you're not an expert, these triggers may not be suitable for you. You should first learn risk and capital management. You can also use the educational content from this channel.
Finally, these triggers reflect my personal opinions on price action, and the market may move completely against this analysis. So, do your own research before opening any position.

BTCUSDT targeting 137K$ soonAs we can see market is holding strong here and soon we are looking for more rise and pump here like the green arrows on chart also if BTC now here hold strong and play some range that would be perfect and why is that?
because we should say hi to ALT season then after a years of patience and it would be time to see some of the charts of ALTs flying.
DISCLAIMER: ((trade based on your own decision))
<<press like👍 if you enjoy💚

BTC - Short Setup at 0.702 Fibonacci & Fair Value GapMarket Context
Bitcoin recently rejected from a major resistance area and has since been retracing downward, finding temporary support inside a bullish Fair Value Gap. The market is currently in a corrective phase, with buyers attempting to defend lower levels while sellers look for optimal positions to reload shorts. This environment shows a classic tug-of-war between these two forces as price moves between supply and demand zones.
Consolidation and Current Phase
Although the prior consolidation has been broken, the current price action can still be described as corrective, with intraday structure forming lower highs. The bullish Fair Value Gap beneath price has been respected so far, creating a temporary base. However, the path remains complex, as the market has unfilled imbalances both above and below.
Bearish Retest Scenario
One key scenario involves a retracement toward the bearish Fair Value Gap near 117K, which also aligns with the 0.702 Fibonacci retracement level. This confluence makes it a high-probability area for sellers to step in again. A rejection from that zone would likely resume the downtrend, with the next logical target being the deeper unfilled bullish Fair Value Gap around 110K. This zone acts as a magnet for price due to the inefficiency left behind during the last rally.
Bullish Defense Scenario
For bulls to regain control, the current Fair Value Gap at 114K must hold, followed by a strong move that invalidates the lower-high structure. Such a move would need to break above the 117K bearish FVG with conviction. Only then could momentum shift back to the upside, opening the door for another challenge of the higher resistance zones.
Final Words
Patience and precision are key when dealing with setups like this. Let the market come to your level — and react with intent.
If you found this breakdown helpful, a like is much appreciated! Let me know in the comments what you think or if you’re watching the same zones.

BTC Once Bearish Momentum Continue AgainBitcoin is currently testing a key resistance zone where a large pool of liquidity has formed, indicating potential for strong price reactions.
On the daily chart (D1), BTC has recently broken through the 116K level, and a new descending trend line is developing. So far, the market has not yet retested the 110K zone, which is a critical support area.
In the short term, price may retest the resistance, which could trigger a downside move if rejected. A correction is expected if bullish momentum weakens.
Key support levels to watch:
1ST Support 112K
2ND Support 110K
You may find more details in the Chart.
Trade wisely Best of Luck Buddies.
Ps; Support with like and comments for better analysis Thanks.

BTC - Short Trade / Crash Update and DetailsPer my previous post here are the details on my personal trade. Note this is NOT financial advice, and this is my own personal trading plan only. Please use your own judgement.
Entry - 116,300 to 116,600
Stop Loss - 121,800
Target 1 - 95,700
Target 2 - 61,500
Target 3 - 35,000
Target 4 - 8,000
Note that Bitcoin should move up from the 35,000 target to 88,000 making a corrective wave on HTF.
At this point I will post an update and advise my own strategy and if I long 35,000 to 88,000.
Happy trading

BITCOIN DAILY/4HR THE daily trendline and 4hr trendline break out will be watched for forward guidance.
if we break the top layer resistance we buy and target 123k current all time and high and factor the possibility of 135-130k-128k zone for next sell.
And our sell will be on break of steep ascending trendline acting as dynamic support and we will watch 114k and 111.78k zone and further downslide wiill be 90k-100k zone.
zone by zone layer by layer.
the structure of the market is clear ,it will never lie.
trading is 100% probability and you need the mindset of a hunter, dont buy because others are buying.
your risk to reward ratio should be your trade reason.
GOODLUCK

BTC - Key insight you must pay Attention to!📊 This is a weekly Bitcoin chart with a key insight you should pay close attention to:
In a bullish trend, you’ll always notice higher highs being formed. Once price breaks the previous high, it's typically a strong confirmation of bullish continuation, as shown by the BOS (Break of Structure) levels marked in blue on the chart.
🔻 The BOS level must not be broken to the downside — if that happens, it signals a trend reversal from bullish to bearish, just like what occurred at the red zone I highlighted.
✅ Currently, Bitcoin has broken its previous high to the upside, which indicates the bullish trend is continuing.
🎯 Next target: $150K.
⚠️ However, if BTC pulls back for a retest and fails to bounce quickly, it will be considered a strong sell signal. That would likely lead to a correction back down toward the $80K zone.
Best regards:
Ceciliones🎯

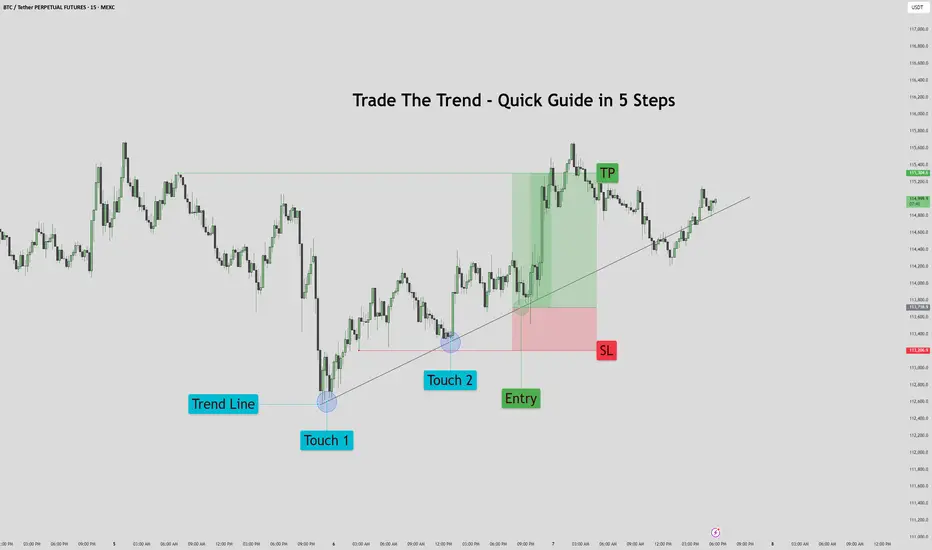
Trade The Trend – Quick Guide In 5 StepsWhat is Trading the Trend?
Trading the trend means buying when the market is going up, and selling when it’s going down.
You're following the direction of the market, not fighting it.
If the trend is up:
Price makes higher highs and higher lows
You look for chances to buy (go long)
If the trend is down:
Price makes lower highs and lower lows
You look for chances to sell (go short)
Why it works:
You’re going with momentum
Simple rule:
Buy in an uptrend, sell in a downtrend — never trade against the flow
1. Assess the chart. Where is it headed? It's headed up.
2. Place your trend line by connecting the first two points.
3. Let the chart play out for a bit. Afterwards prepare your entry on previous failed trend line retest. Set your stop loss below the previous trend line retest, and your TP just before the previous sweep above.
4. Proceed to let the chart play out, then set your pending order.
5. Watch the Trade enter and play out with patience.
This method works for bearish trends as well, just reversed.
If you would like to see more 5 step guides, comment down below.
Thank you!
Bitcoin soon above 123K again enter long near 0.61% Fib support The price can pump without touching our entry because market is gonna start next phase pump ASAP but we put our short-term signal on one of the major support which is 0.61 Fib retracement level and also trade is 1:3(Risk: Reward).
for long-term view and CRYPTOCAP:BTC target which is 137K$ in my mind take a look at daily chart linked below.
DISCLAIMER: ((trade based on your own decision))
<<press like👍 if you enjoy💚

BTC Retest In Progress – Ready for Liftoff?🚀 Bitcoin has been respecting the long-term rising channel (blue) — moving in clear impulsive 📈 and corrective 📉 waves.
After each bullish leg (highlighted in pink), BTC dips into a correction (red), finds support at key demand zones 🟧, and then kicks off a new rally.
🔥 Currently, BTC is hovering near a strong demand zone around the $110,000–$113,000 area, forming a potential higher low within structure.
If this zone holds, the bulls 🐂 could regain control and push price toward the $130,000–$140,000 range — aligning with the upper boundary of the channel 📊.
💡 Continuation soon?
Let the market decide — we’re watching this zone closely for a bullish breakout confirmation ✅
💬 What’s your bias here? Are you bullish or waiting for a deeper pullback?
📚 Always follow your trading plan regarding entry, risk management, and trade management.
Good luck!
All Strategies Are Good; If Managed Properly!
~Richard Nasr
