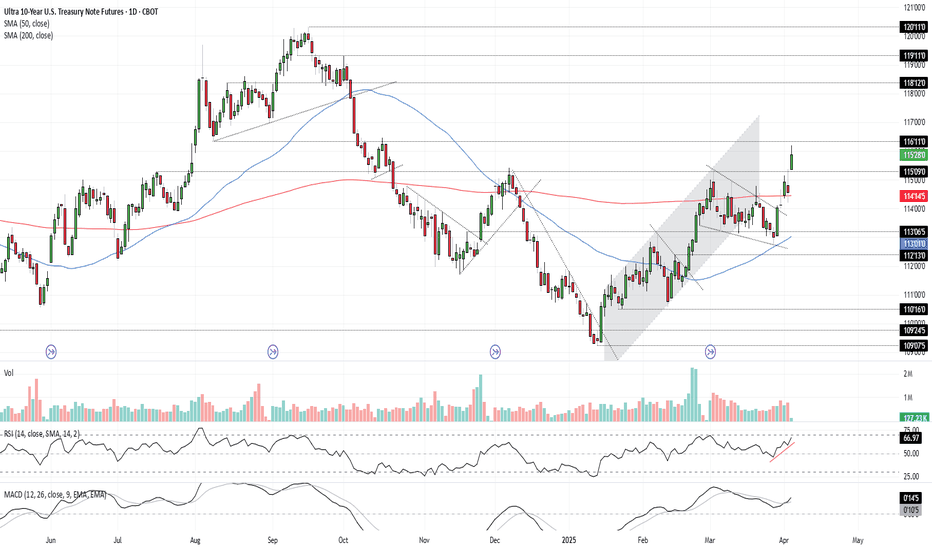
10YR US Treasury Note Chart Fibonacci Analysis 052825Trading Idea
1) Find a FIBO slingshot
2) Check FIBO 61.80% level
3) Entry Point > 112/61.80%
Chart time frame:B
A) 15 min(1W-3M)
B) 1 hr(3M-6M)
C) 4 hr(6M-1year)
D) 1 day(1-3years)
Stock progress: A
A) Keep rising over 61.80% resistance
B) 61.80% resistance
C) 61.80% support
D) Hit the bottom
E
Related futures
US 10 yr Treasury Note Chart Fibonacci Analysis 051925Trading Idea
1) Find a FIBO slingshot
2) Check FIBO 61.80% level
3) Entry Point > 111/61.80%
Chart time frame:B
A) 15 min(1W-3M)
B) 1 hr(3M-6M)
C) 4 hr(6M-1year)
D) 1 day(1-3years)
Stock progress: B
A) Keep rising over 61.80% resistance
B) 61.80% resistance
C) 61.80% support
D) Hit the bottom
E
Bonds Don’t Lie: The Signal is ClearU.S. 10-year Treasuries are a crucial cog in the global financial machine, serving as a benchmark borrowing rate, a tool for asset valuation, and a gauge of the longer-term outlook for U.S. economic growth and inflation.
As such, I keep a close eye on 10-year note futures, as they can offer clues o
10 yr Treasury note Stock Chart Fibonacci Analysis 022825Today's chart analysis uses the Fibonacci fan line and extension.
Today, the 10-year treasury note touches the 114/423.60% of the 1st wave, and then U.S. stock markets rebound from falling in these days. Accordingly, QQQ has a nice 497/61.80% support level.
But if 10-year treasury note go over this
Treasury yields at a crossroads? The implications for marketsThe long end of the US Treasury curve has been influential for FX markets recently. The rolling 10-day correlation between US 10-year yields with the DXY, EUR/USD, GBP/USD, and USD/JPY is either strongly positive or negative. Even gold shows a notable -0.73 correlation, highlighting the influence of
Buying Opportunity in T-Notes? After putting in a bottom in mid-October, T-notes have rallied sharply higher. Patient bulls have been afforded few opportunities to enter the contracts on a pullback, but that may soon change. Pullbacks are a healthy part of any sustained rally, as they allow market participants to take profits fr
See all ideas
A representation of what an asset is worth today and what the market thinks it will be worth in the future.
Displays a symbol's price movements over previous years to identify recurring trends.
Frequently Asked Questions
The nearest expiration date for Ultra 10-Year U.S. Treasury Note Futures (Dec 2021) is Dec 21, 2021.
Traders prefer to sell futures contracts when they've already made money on the investment, but still have plenty of time left before the expiration date. Thus, many consider it a good option to sell Ultra 10-Year U.S. Treasury Note Futures (Dec 2021) before Dec 21, 2021.


