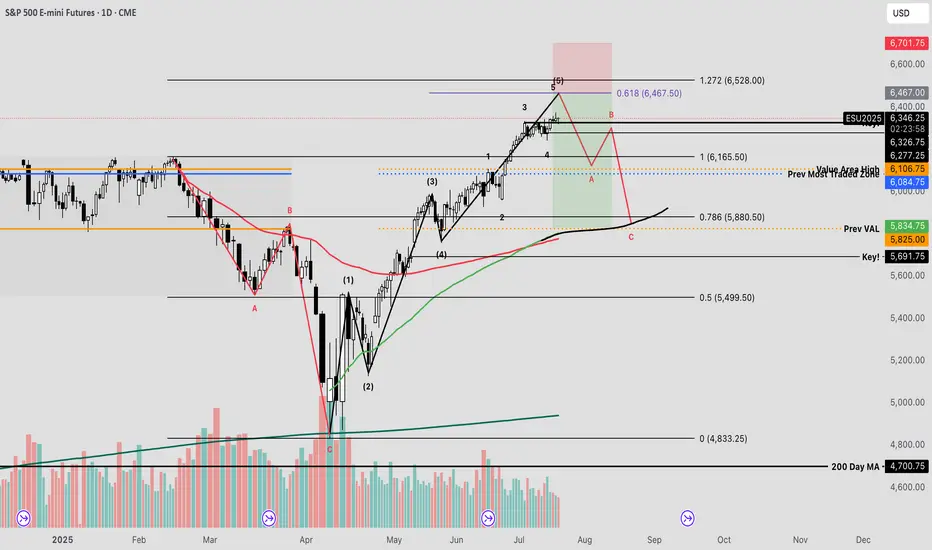
Extended rally off April lows should be completing imminentlyEvery so often, a market move defies conventional expectations of retracement—and the rally off the Liberation Day lows is exactly that. It’s extended longer and climbed higher than even the most bullish forecasts imagined in early April. No one remembers the calls for an imminent recession by most
Related futures
Stop-Loss Strategies in Retail TradingA Comprehensive Scientific Analysis of Risk Management Effectiveness
This essay provides a comprehensive analysis of stop-loss strategies in retail trading environments, synthesizing empirical evidence from behavioral finance and quantitative risk management literature. Through examination of over
Gold silver7.22 2025 gold is at a pivotal Junction and it looks bullish but it's come to ABCD patterns and reversal patterns that indicate that it could go lower and the silver it doesn't look quite the same but it's moving to levels that it hasn't been for a long period of time so this may indicate the pos

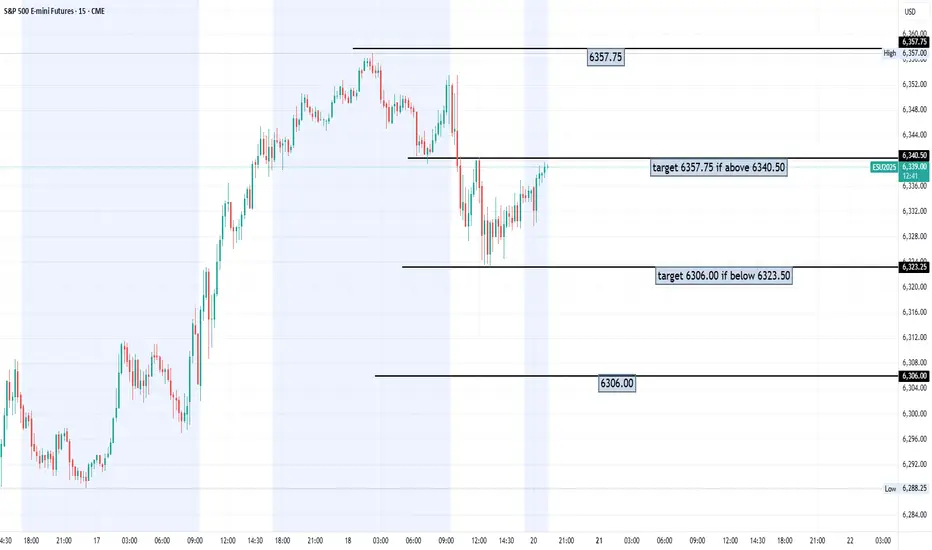
DIYWallSt Trade Journal:$238 Lessons From Monthly Expiration07/18/25 Trade Journal, and ES_F Stock Market analysis
EOD accountability report: +238.75
Sleep: 5. hours
Overall health: Was working late last night and didn't get much sleep.
VX Algo System Signals from (9:30am to 2pm)
— 8:30 AM Market Structure flipped bullish on VX Algo X3!
— 10:30 AM Ma

Using 1 min time frame for entries on VX algo & day tradingwhat time frames do you use to confirm entries outside of a buy signal?
If I am day trading, I will mainly use the 1 minute time frame to look for moving average support and resistance, and read the candle stick patterns as well from that chart.
However, there are times I'll switch to a 5 minute a

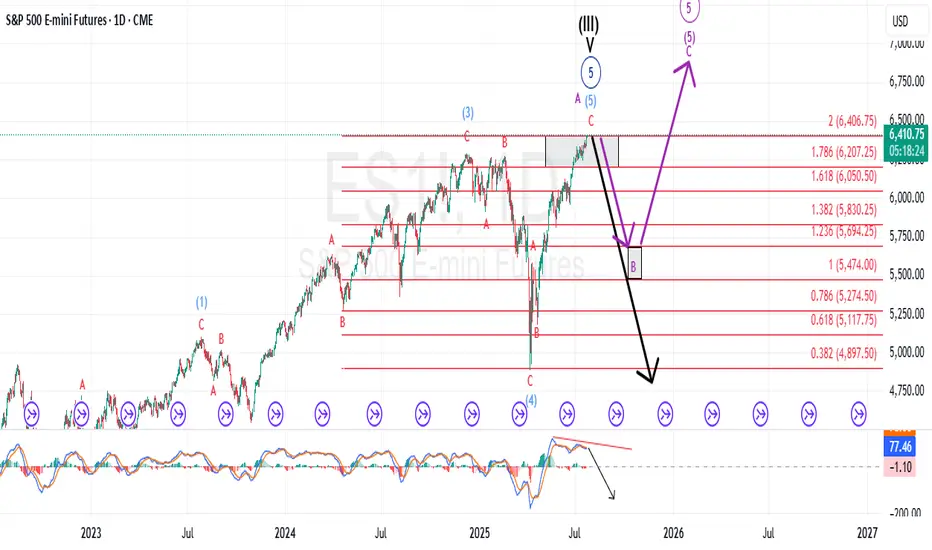
S&P500: Rally ContinuesYesterday, the S&P 500 managed to notch modest gains once again. In line with our primary scenario, the ongoing magenta wave (B) is likely to continue climbing toward resistance at 6,675 points. Once this corrective upswing reaches its peak—still below that level—we anticipate a pullback as part of

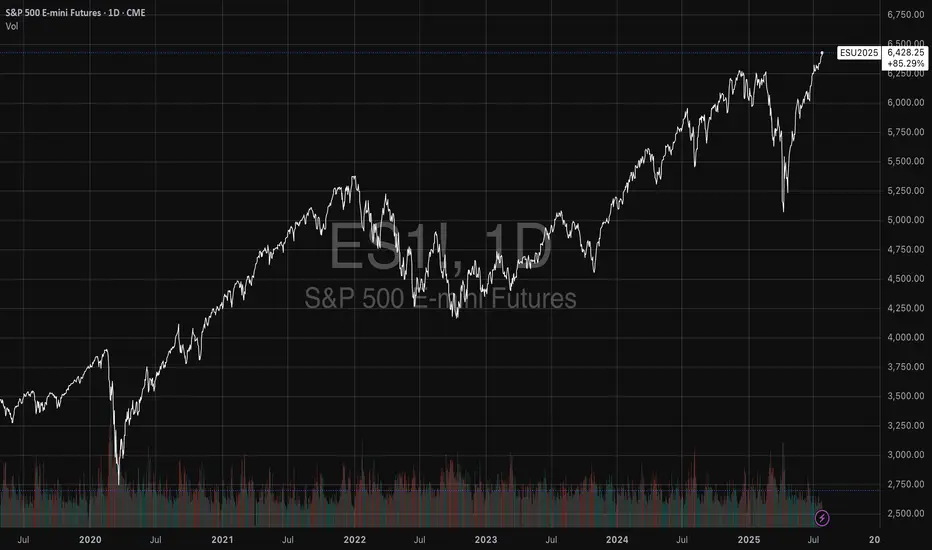
SPY The Final Countdown Since the April lows, equity markets have exhibited strong performance, with many stocks appreciating by nearly 100%—some even exceeding that threshold. Given the velocity of this rally, a corrective pullback may be imminent before the broader uptrend resumes.
The current reading on the Fear & Gree
AMP Futures - How to view Deep level 2 data (DOM)In this idea we will discuss what is required in order for you to access deep level 2 data on the Depth of Market (DOM) using Tradingview.

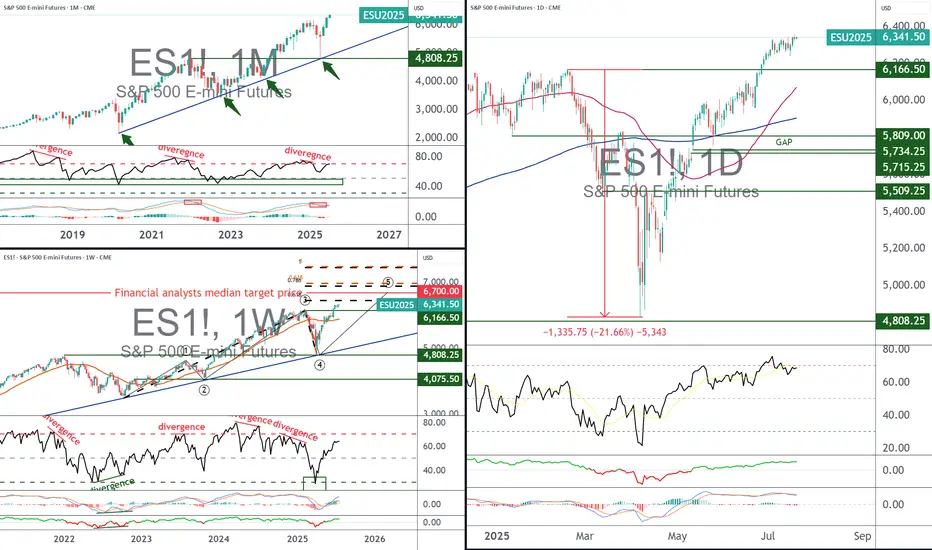
S&P 500, what target for the end of 2025?With the S&P 500 index (the S&P 500 future contract is used as a reference in this analysis) having surpassed its all-time record of 6,165 points at the end of June, and still against a backdrop of trade diplomacy, what technical and fundamental price target can we aim for over the next 12 months? 6
See all ideas
A representation of what an asset is worth today and what the market thinks it will be worth in the future.
Displays a symbol's price movements over previous years to identify recurring trends.
Frequently Asked Questions
The nearest expiration date for E-mini S&P 500 Futures (Mar 2019) is Mar 15, 2019.
Traders prefer to sell futures contracts when they've already made money on the investment, but still have plenty of time left before the expiration date. Thus, many consider it a good option to sell E-mini S&P 500 Futures (Mar 2019) before Mar 15, 2019.