NQ Targets (08-04-25)Many calls did play out last week and looking for some targets to get tested this week. On 7/29 called the Yellow arrow (last week's called range), the white is this week's. NDX has some gaps to retest, YTD chart below and yellow arrows are the targets.
The 30M and 4HR charts are adjusted to match the NDX gaps.
Anyway, the Overnight will be used to redirect the NAZ back up after most drops, this is normal and just beware of the O/N Pump/Dump once the Reg Session starts. Washington Street will spin, Fire, Tweet and do whatever works to get NAZ back above the DZ 23,486. Just watch the Queen spiral out of control should it not. The two day drop erased 23 trading days and those buyers are now loosing money. Should it not come back, the buyers that did not sell (trapped) will sell and send this even lower. Games/tricks can not fix that.
NQZ2020 trade ideas
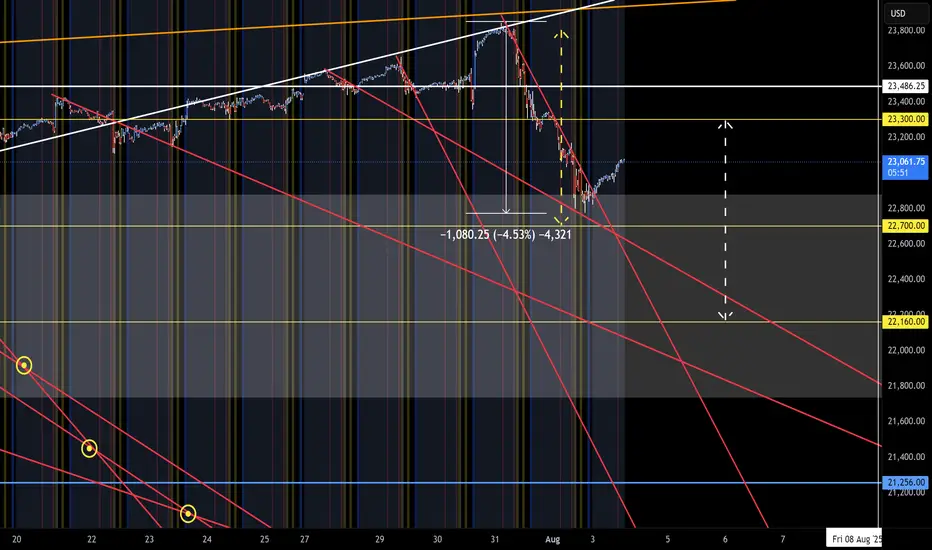
NQ Short (08-11-25)Looking at a Double Top drop at O/N TYD High this week. Red lines are TLX targets lower. Looking for YTD open price level retest to be hit prior to next leg upward. Danger Zone 486 is Long above and Short below for now.

NASDAQ (NQ1!): Bullish! Buy The Pullbacks!Welcome back to the Weekly Forex Forecast for the week of Aug 11 - 15th.
In this video, we will analyze the following FX market:
NASDAQ (NQ1!) NAS100
The NASDAQ is strong and moving higher. No reason to look for sells.
Wall Street advanced on Friday, taking indexes closer to a strong weekly finish, after President Donald Trump's interim pick for a Federal Reserve governor post kept expectations alive for a dovish policy.
The structure is bullish, with supports for higher prices. Wait for a pullback to discount arrays and buy it!
Enjoy!
May profits be upon you.
Leave any questions or comments in the comment section.
I appreciate any feedback from my viewers!
Like and/or subscribe if you want more accurate analysis.
Thank you so much!
Disclaimer:
I do not provide personal investment advice and I am not a qualified licensed investment advisor.
All information found here, including any ideas, opinions, views, predictions, forecasts, commentaries, suggestions, expressed or implied herein, are for informational, entertainment or educational purposes only and should not be construed as personal investment advice. While the information provided is believed to be accurate, it may include errors or inaccuracies.
I will not and cannot be held liable for any actions you take as a result of anything you read here.
Conduct your own due diligence, or consult a licensed financial advisor or broker before making any and all investment decisions. Any investments, trades, speculations, or decisions made on the basis of any information found on this channel, expressed or implied herein, are committed at your own risk, financial or otherwise.

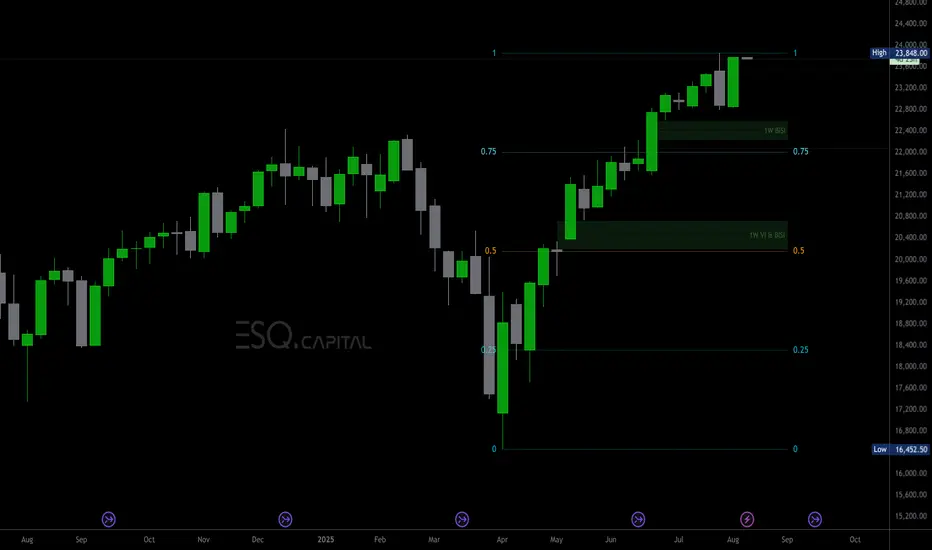
MNQ SET TO MAKE MORE NEW HIGHS, BEWARE OF THE STRONG PULLBACKSWe are very likely to witness CME_MINI:MNQU2025 (and of course NQ) reaching for new highs in the not too distant future.
However it is wise to bare in mind that price having made a high in the previous week of may experience a deep retracement into an area of weekly price inefficiency:
This general area sits nicely above the lower end of the Premium-High of the current weekly Dealing Range (0.75 DRT).
It is also feasible to expect price to revisit the Equilibrium of the current weekly Dealing Range (0.5DRT) as depicted in the chart at a general area of over the next month or so before seeing sustainable new highs being achieved.
Lets keep a keen look out for the release of this week's economic reports (especially inflation related) that may help drive price lower in the short term before we see it achieve a season of further new highs.
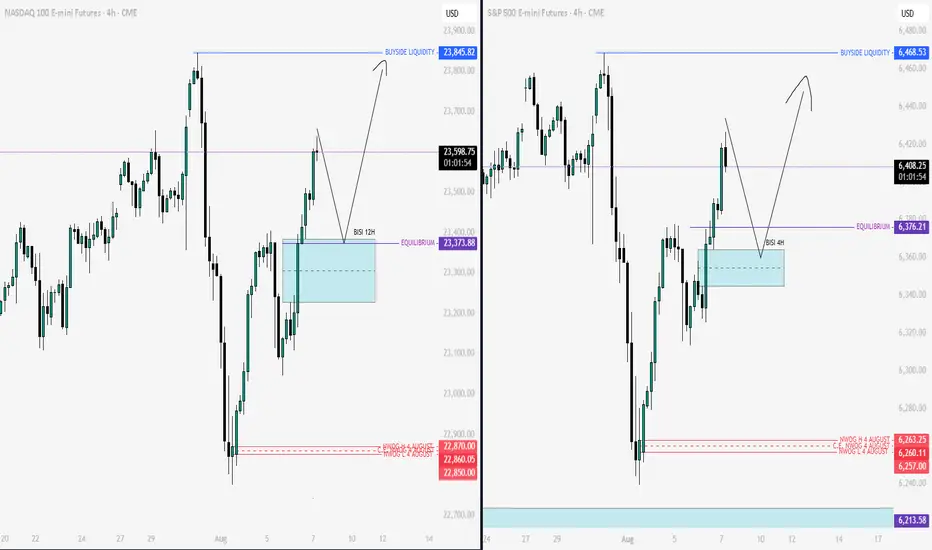
Nq & Es Key Levels & Scenarios 07-08-2025It’s clear that we’re currently operating within a premium zone of the range. The directional bias remains bullish, but I’m anticipating the potential for a short-term short setup around the 09:30 AM New York open, allowing for a retracement before continuation higher.
I will not look for long setups unless price trades back into a discount zone, or at the very least, rebalances toward the equilibrium (50% of the dealing range). If price continues to rally without offering such a pullback, I’m fully prepared to stay sidelined — discipline over FOMO.
Wishing everyone clean, high-probability setups today.
NQ : Short levelThe level has been activated, so you can short it. I have slightly edited it since last time. It is best to scalp or pips it; I cannot promise any significant movement. Be careful when trading on news or at market close/open.
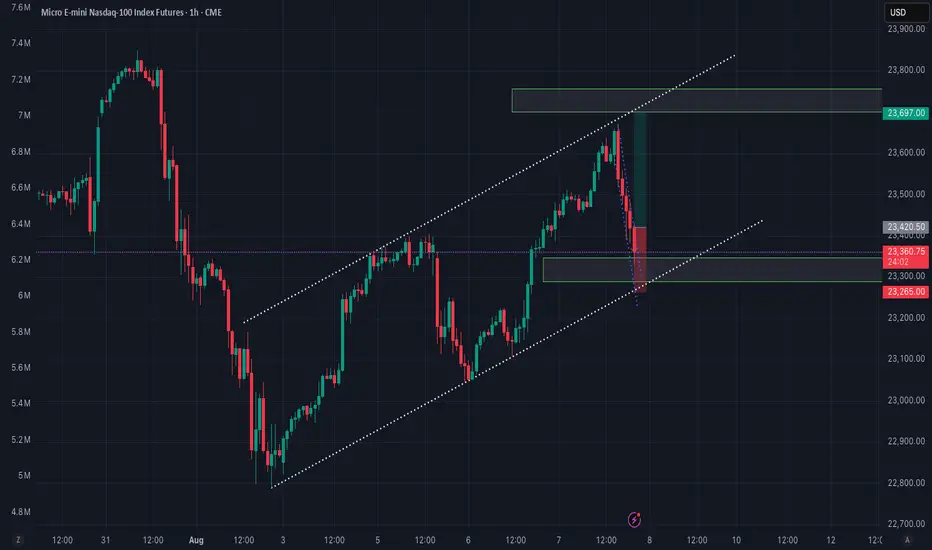
Nasdaq longPossible trade shaping up on the Nasdaq.
1hr trendline a channel with a 50-61.8% fib zone
Previous days profile providing a low volume node as support
5min counter trend failure for possible breakout point. Otherwise, previous lower high or resistance might be worth looking at
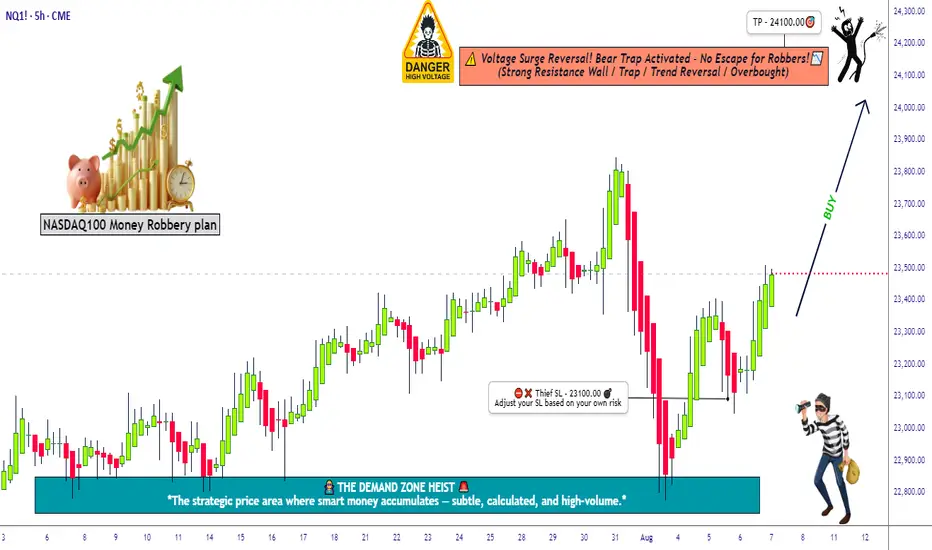
Robbing the Nasdaq Futures | NQ1! Plan with Precise Targets💥🚨NQ1! “E-Mini Nasdaq 100” Heist Alert 🚨💥
🎯Thief Trader Bullish Takeover Plan🕵️♂️📈
🌍 Dear Global Looters & Market Bandits, 💰💸💎
It's time to crack the vaults of the Nasdaq 100 Futures (NQ1!) — Thief-style! No mercy. No fear. Just profits. 🔥
🔓 The digital vault is open — we’re layering multiple limit orders like pros to snatch the tech treasure chest. This isn’t just a trade…
👉 This is an organized robbery of Wall Street’s most elite index. 🏦🕶️
💎 Entry Point = Anywhere on the Grid!
Set your buy limit orders at juicy dips — 15m / 30m / 1H zones, support bounces, or wherever the chart whispers "steal me." 🎧📉
⏰ Stay alert — we don’t chase, we trap. 🐍
🛑 Stop Loss = 23100.00
Set it & forget it below key swing low.
You’re not in this heist to bleed. Risk small. Layer tight. Protect the stash. 🛡️💼
🎯Target = 24100.00
That’s the exit zone before the feds (aka market makers) catch on.
Be smart — take profit early if the heat gets real. 🚓🚨
🧠Strategy Mode: Layering Limit Orders
Thief never enters with one shot. We layer in like ghosts — scaling into value zones, controlling the risk, and building power before liftoff. 🚀📊
This ain’t gambling — it’s structured robbery with exit plans. 🎯💼
🧲 Scalpers & Swingers Welcome!
⚔️ Got big capital? Smash the levels and ride the breakout.
💼 Small cap thief? Ride with the swing crew — safer, smoother, more stealthy.
📍Always use Trailing SL — never let the market take back what you stole. 💰
📰 Market Sentiment: Bullish Bias 😈
AI hype. Earnings season. Rate cuts. You name it — it’s all fueling the Nasdaq rocket.
We’re riding momentum, not hope. This ain’t luck — it’s Thief precision execution.
🔔 Pro Thief Tips:
⚠️ Avoid entries during high-impact news.
🚀 Use alerts. Monitor VIX + QQQ.
💻 Watch for liquidity zones & trap setups.
🚀💣 Smash that 🔥Boost Button🔥 if you love robbing the market like a pro!
Help grow the Thief Trading Crew — one like = one stolen candle from the whales. 💵🦈
We rob institutions, not each other. 💯🤝
Stay locked in — next heist plan coming soon. 📡📈
#NQ1 #Nasdaq100 #EminiFutures #ThiefTrader #RobTheMarket #LayeringStrategy #SmartMoneyMoves #BullishPlan #WallStreetHeist #TradingViewSetup
Calm Before a StormSince the post-COVID period, we have not seen such a gentle and continuous uptrend. This phenomenon reminds me of the market before the COVID meltdown.
How do I going to interpret this "Gentle & Continuous Uptrend" move?
My answer: Cautiously bullish
Back then, market was cautiously bullish because COVID seemed to be contagious.
It has triggered.
Now, market is cautiously bullish because tariffs appear to be deepening inflation. With slowing job numbers, this is becoming a bigger concern.
Will it trigger?
Mirco Nasdaq Futures and Options
Ticker: MNQ
Minimum fluctuation:
0.25 index points = $0.50
Disclaimer:
• What presented here is not a recommendation, please consult your licensed broker.
• Our mission is to create lateral thinking skills for every investor and trader, knowing when to take a calculated risk with market uncertainty and a bolder risk when opportunity arises.
CME Real-time Market Data help identify trading set-ups in real-time and express my market views. If you have futures in your trading portfolio, you can check out on CME Group data plans available that suit your trading needs www.tradingview.com

NQ Short This is a really really hard decision to make. But it really does look like a short opp in play.
I mean, there is a hard rejection of making higher highs, that only means we are going to correct. Actually if you track back the price, you will see a bearish FVG that is being respected on the daily TF.
Its just means that bears shorted this area before with size and they are really defending it this time.
If you are going to take this trade, dont be aggressive with size as we might actually turn bullish in seconds and the whole setup fails.
Hopefully it goes through as planned ;D
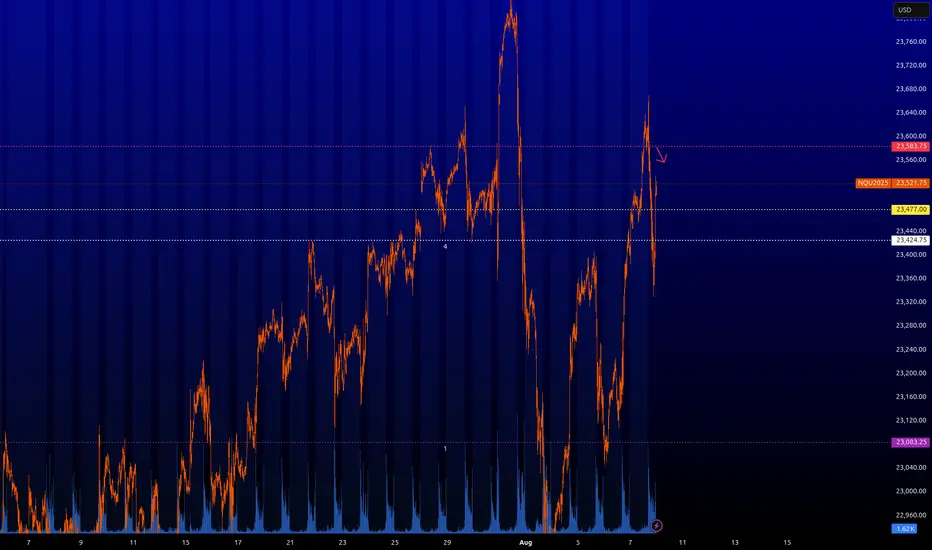
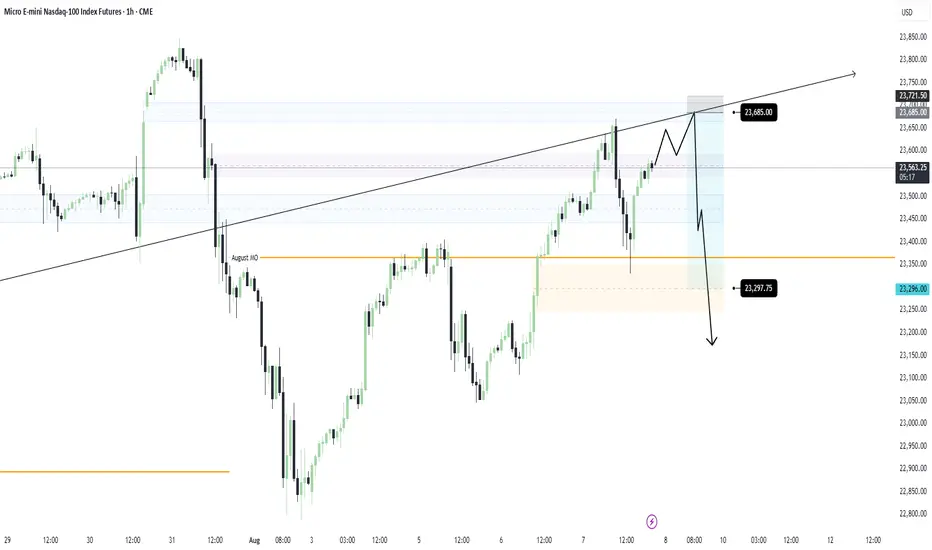
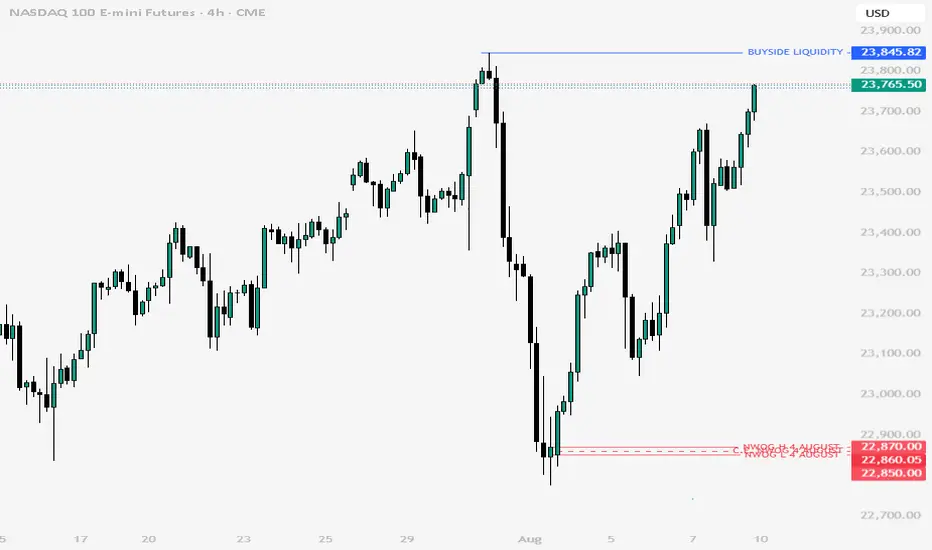
NQ Short Bias: Previous NWOG RejectionI missed today’s sell-off by 60 ticks, but price respected Monthly Open support and retraced back near intraday highs. That reaction reinforces my bias: I’m still anticipating the dump that will likely happen tomorrow.
Ideally, price completes the Double Top within the prior NWOG zone, then falls slightly before or exactly at NY Open for a clean downhill ride.
My entry will be at 23,685.00
Target will be around the low 23,300.00s
I feel like we can definitely fall further than my target, so I will have trailing Stop in place once price reaches my target.
Lets see how this goes⚡
NQ heading back to weekly AVL🕵️ Chart Overview
• Instrument: MNQ1! (Micro Nasdaq Futures, continuous contract)
• Timeframe: 4H
• Method: Volume Profile + Price Action + Supply/Demand
⸻
🔷 Technical Commentary
Entry Zone
• Price Range: 23,463.25 – 23,608.25
• Context: Clearly marked supply zone formed after a strong rejection wick and drop, likely a mitigated order block or an area with resting sell orders.
• Price recently tapped into the bottom edge of this zone and is showing signs of reaction.
• You’re targeting this as an ideal short re-entry point on a retracement move.
Confluence Factors
• Volume Profile: High volume node (HVN) just below the entry zone, suggesting this area previously acted as fair value before price got rejected.
• Structure: Bearish internal structure shift after that strong swing high. Price created a lower high and lower low, supporting the short idea.
• Clean break & retest: You’ve waited for the pullback to a previous area of interest—textbook risk-efficient trading.
TP Area
• Target Range: ~22,800s zone
• Likely drawn from:
• Previous demand area
• Volume gap / low-volume node
• Strong bounce from this zone last time suggests it’s a key support.
• Gives a nice 2–2.5R setup, depending on your SL.
⸻
🧠 Trade Logic Summary
• Bias: Bearish
• Entry: Short within the 23,463.25 – 23,608.25 zone (watch for rejection wicks / internal breakdown on LTF).
• Confirmation: Price reaction or reversal pattern in the zone (e.g., bearish engulfing, LTF BOS).
• TP: 22,800 region (just above the previous demand zone)
• SL: Just above 23,608.25 to invalidate the idea.
⸻
✅ Strengths
• Clear market structure shift
• Volume Profile confirmation
• Defined RR with institutional-style entry
• Good use of supply zone logic (not chasing entries)
⸻
⚠️ Things to Monitor
• If price closes above 23,608, setup invalidates and you may be looking at a liquidity grab and continuation to 23,800+
• Watch for bullish absorption in your entry zone. That would be a red flag.
• NFP / FOMC or any other scheduled macro events? Check the calendar before execution.

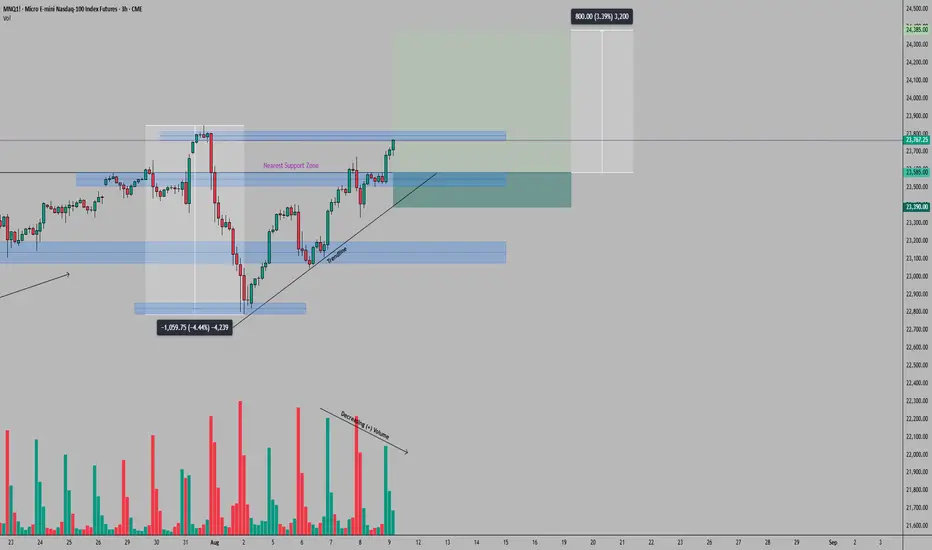
MNQ (Micro Nasdaq 100 Futures) Trade Setup – 3H TimeframeOn the 3-hour timeframe, MNQ has reached a critical juncture after establishing a new all-time high above the 23,800 mark on July 31, 2025. The subsequent sharp correction to the 22,800 zone and equally sharp V-shape recovery demonstrates strong underlying market dynamics. However, the declining positive volume during the recent upward movement suggests waning bullish momentum, even as price approaches the previous highs.
The market structure remains constructively bullish with higher lows and higher highs, but the volume pattern raises concerns about sustainability at these levels. The confluence of the previous all-time high area and declining volume creates conditions favorable for a tactical pullback to nearby support before any sustained breakout attempt.
Illustrative Setup: A Buy Limit order at 23,585 aligns with the upper boundary of the nearest support zone. The Stop Loss placement at 23,390 sits below both the support zone and the recent trendline, providing clear invalidation if breached. The Take Profit target at 24,385 represents a 76% recovery level from the recent 4.44% decline, offering an attractive risk-reward ratio of 4.1:1.
Key caution: While a break above 23,800 remains possible, the declining volume suggests potential for a bull trap. Traders should resist FOMO-driven entries above resistance and instead maintain discipline in waiting for a pullback to materialize a low-risk, high-probability setup.
This analysis is provided solely for educational and entertainment purposes and does not constitute any form of financial or investment advice. Always manage your risk and trade responsibly.
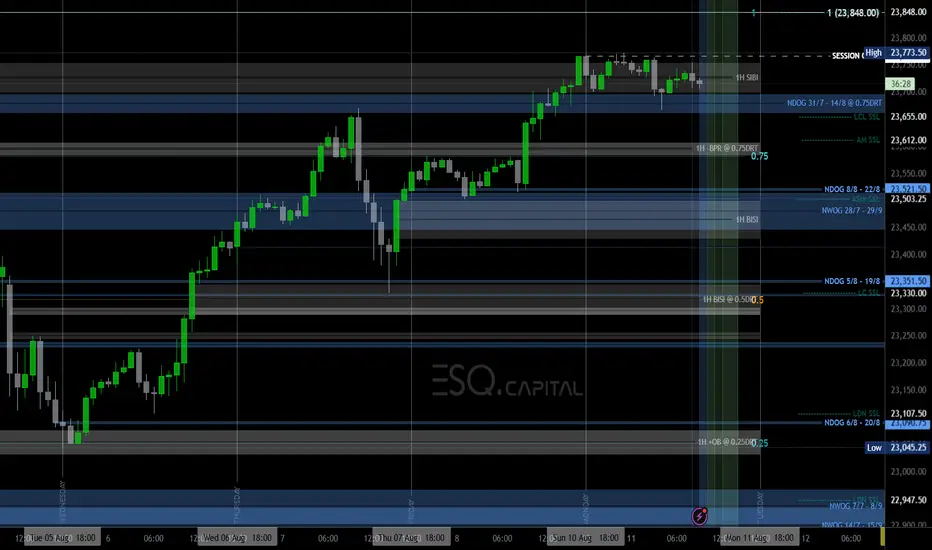
NQ Power Range Report with FIB Ext - 8/12/2025 SessionCME_MINI:NQU2025
- PR High: 23650.00
- PR Low: 23614.50
- NZ Spread: 79.5
Key scheduled economic events:
08:30 | CPI (Core|MoM|YoY)
Temp AMP margins increase for expected economic news volatility
Session Open Stats (As of 12:35 AM 8/12)
- Session Open ATR: 291.18
- Volume: 17K
- Open Int: 290K
- Trend Grade: Long
- From BA ATH: -0.7% (Rounded)
Key Levels (Rounded - Think of these as ranges)
- Long: 23811
- Mid: 22096
- Short: 20383
Keep in mind this is not speculation or a prediction. Only a report of the Power Range with Fib extensions for target hunting. Do your DD! You determine your risk tolerance. You are fully capable of making your own decisions.
BA: Back Adjusted
BuZ/BeZ: Bull Zone / Bear Zone
NZ: Neutral Zone
MNQ INTRADAY - COULD WE SEE PRICE AT 23,450 AGAINAt the time of this Idea - Before the Opening Bell on Monday 11th August 2025, CME_MINI:MNQU2025 appears to be respecting the Premium-High it finds itself in.
This could mean that price may MOVE OUT of a buyside-program where higher highs are achieved, as buyside liquidity is sought, and into a sell-side program where discount areas of interest are engaged and a descent in price occurs.
Could we see CME_MINI:MNQU2025 reach down towards 23,450 during this trading session, or will tomorrow's pending core inflation figures cause today's price action to stall in anticipation of the release of the reports?
Also look out for U.S. trade tariff related developments that may pull up any surprises.
Profitable trading guys!
How to Use Engulfing Candles in TradingViewEngulfing patterns are among the most powerful candlestick formations because they signal strong momentum shifts and can help you spot dramatic trend reversal opportunities.
What You'll Learn:
• How to identify valid engulfing formations where one candle completely covers another's body
• The two types: bullish engulfing (green candle engulfs red) and bearish engulfing (red candle engulfs green)
• Psychology behind engulfing patterns: when one side completely overwhelms the other
• Using volume analysis to confirm engulfing pattern validity
• Finding meaningful engulfing patterns at trend highs and lows for reversal setups
• Timeframe considerations for engulfing analysis on any chart period
• Step-by-step trading strategy for engulfing reversal setups
• Setting proper stop losses above engulfing candle highs
• Determining profit targets below engulfing candle lows
• Managing wide-range drawdowns common with strong momentum shifts
• Advanced entry technique: waiting for retracements to improve risk-reward ratios
This tutorial may help futures traders and technical analysts who want to use powerful candlestick patterns to identify significant momentum changes.
The strategies covered could assist you in creating effective reversal setups when strong buying or selling pressure appears at key price levels.
Learn more about futures trading with Tradingview: optimusfutures.com
Disclaimer:
There is a substantial risk of loss in futures trading. Past performance is not indicative of future results. Please trade only with risk capital. We are not responsible for any third-party links, comments, or content shared on TradingView. Any opinions, links, or messages posted by users on TradingView do not represent our views or recommendations. Please exercise your own judgment and due diligence when engaging with any external content or user commentary.
This video represents the opinion of Optimus Futures and is intended for educational purposes only. Chart interpretations are presented solely to illustrate objective technical concepts and should not be viewed as predictive of future market behavior. In our opinion, charts are analytical tools—not forecasting instruments. Market conditions are constantly evolving, and all trading decisions should be made independently, with careful consideration of individual risk tolerance and financial objectives.

NAS100 ShortNAS100 is now net short on the regression break.
I am short the RTY and I considering this options as well.

Nq & Es Key Levels 08-08-2025 After from my morning forecastFinally, the price moved up as we predicted before the market opened at 09:30.
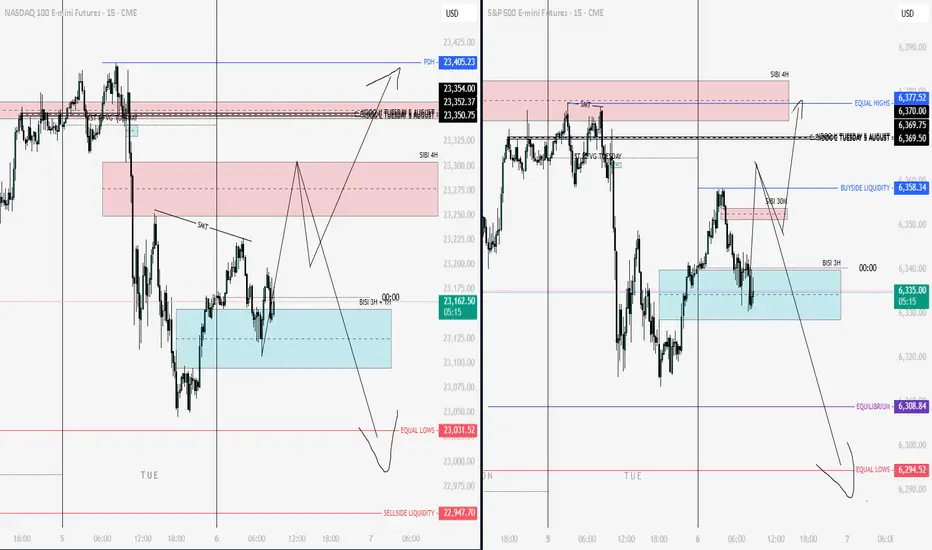
NQ & ES Key Levels 06-08-2025"To determine which of the two scenarios is more likely to play out, we first need to see how the market opens. Based on the price action and how key levels are respected, we’ll gain clarity on the setup we’re looking for. Price is currently at a critical point, with probabilities at roughly 50-50 — so there’s no clear bias yet. However, we’re well aware of the key levels and zones we’re focused on."
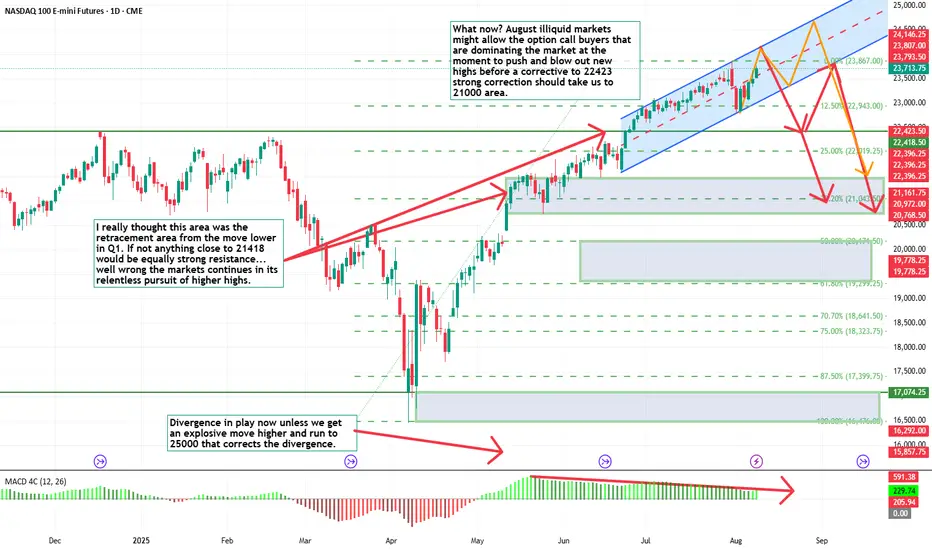
What now for the NQThe chart shows the area i previously believed would contain a corrective move back to retrace the first impulse lower, that is off the table and the question is where is that turning point now.
September likely to get a rate cut, tariffs news having less impact and news about Powell needs to watched.
We have continued divergence and i think after a blow out top we will get a reasonable corrective move.
Time windows and Importance of quarterly theoryCME_MINI:NQ1!
Outlined the time windows that I look upto always

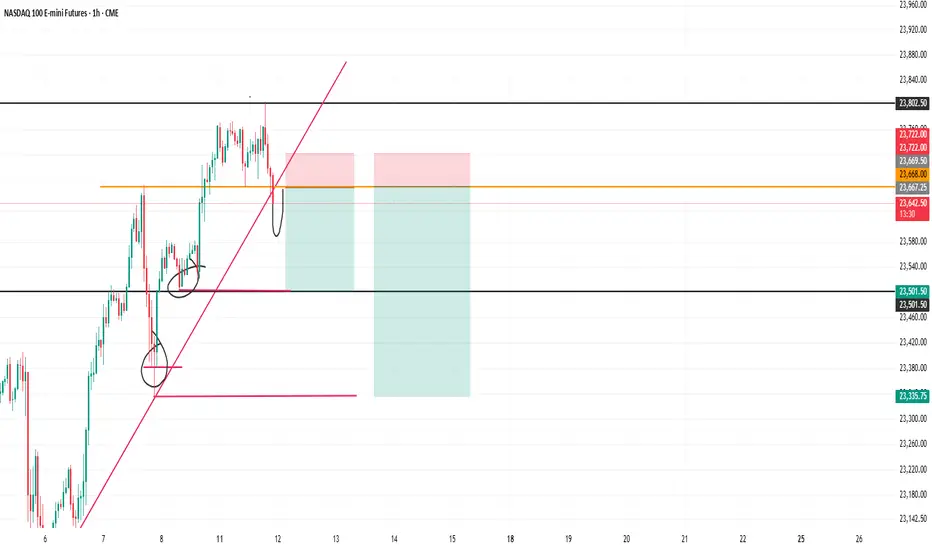
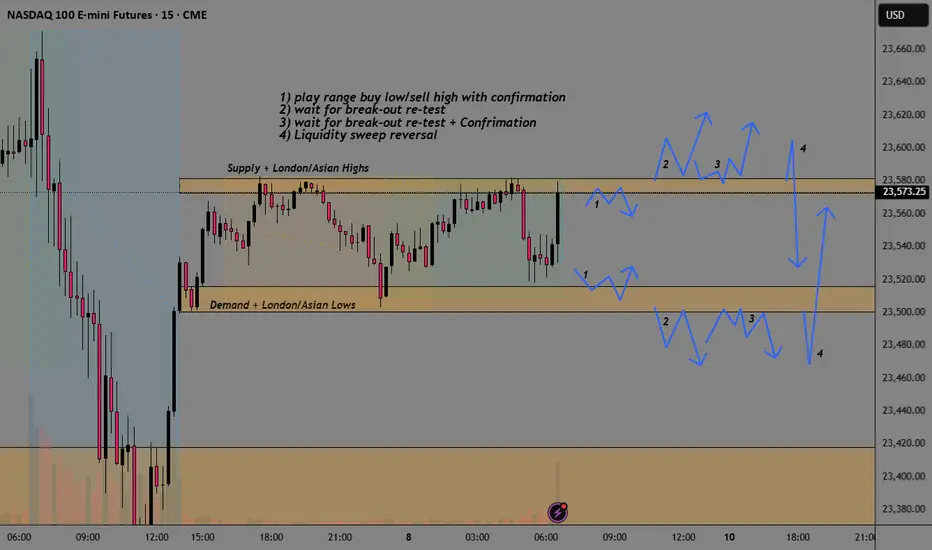
NQ Break-Out AnalysisSee chart from analysis of different options depending on the type of trader and what others are looking at.
1) play range buy low/sell high with confirmation
2) wait for break-out re-test
3) wait for break-out re-test + Confirmation
4) Liquidity sweep reversal
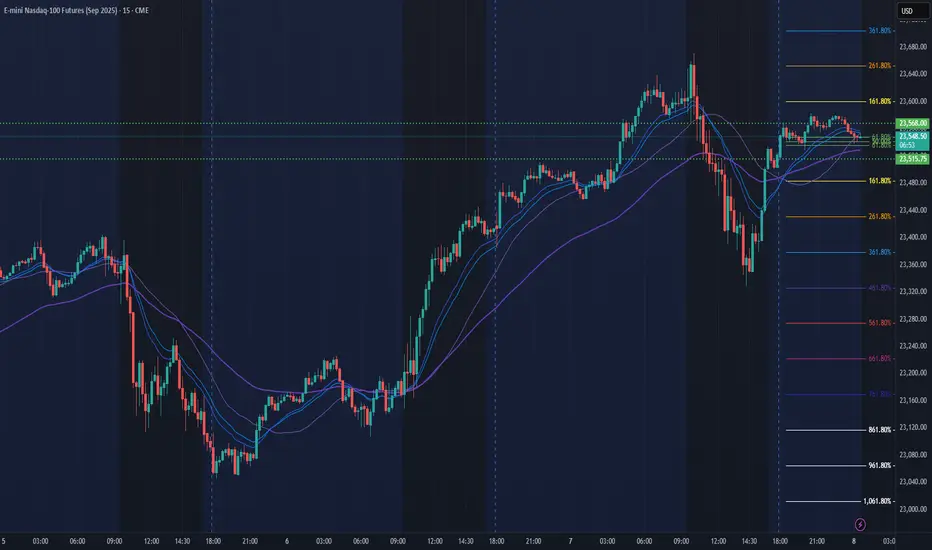
NQ Power Range Report with FIB Ext - 8/8/2025 SessionCME_MINI:NQU2025
- PR High: 23568.00
- PR Low: 23516.00
- NZ Spread: 116.5
No key scheduled economic events
Session Open Stats (As of 12:35 AM 8/8)
- Session Open ATR: 302.51
- Volume: 22K
- Open Int: 282K
- Trend Grade: Long
- From BA ATH: -1.1% (Rounded)
Key Levels (Rounded - Think of these as ranges)
- Long: 23811
- Mid: 22096
- Short: 20383
Keep in mind this is not speculation or a prediction. Only a report of the Power Range with Fib extensions for target hunting. Do your DD! You determine your risk tolerance. You are fully capable of making your own decisions.
BA: Back Adjusted
BuZ/BeZ: Bull Zone / Bear Zone
NZ: Neutral Zone