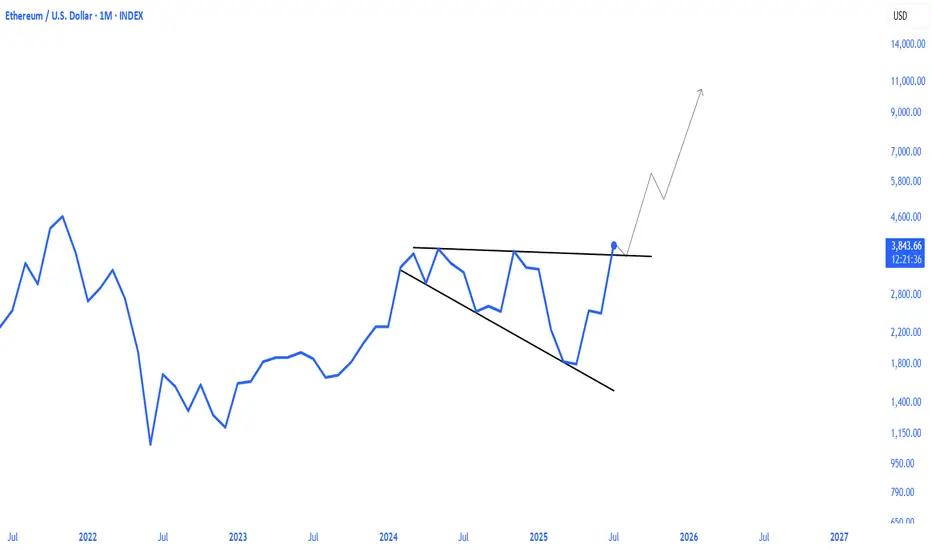
ethereum breakout bullish megaphone pattern ETHEREUM broke the bulish megaphone pattern in the 1M timeframe. it will continue to rise after the retest phase that will occur with the monthly closing today.
Key data points
Previous close
—
Open
—
Day's range
—
About Ethereum
Ethereum — the world’s second-most famous blockchain network — is a platform for creating decentralized applications based on blockchain and smart contract technology (a command that automatically enforces the terms of the agreement based on a given algorithm). It's the chain that birthed DeFi (decentralized finance) and started the NFT craze which saw billions of dollars pour into cryptocurrency. Safe to say, it's one of the big dogs.
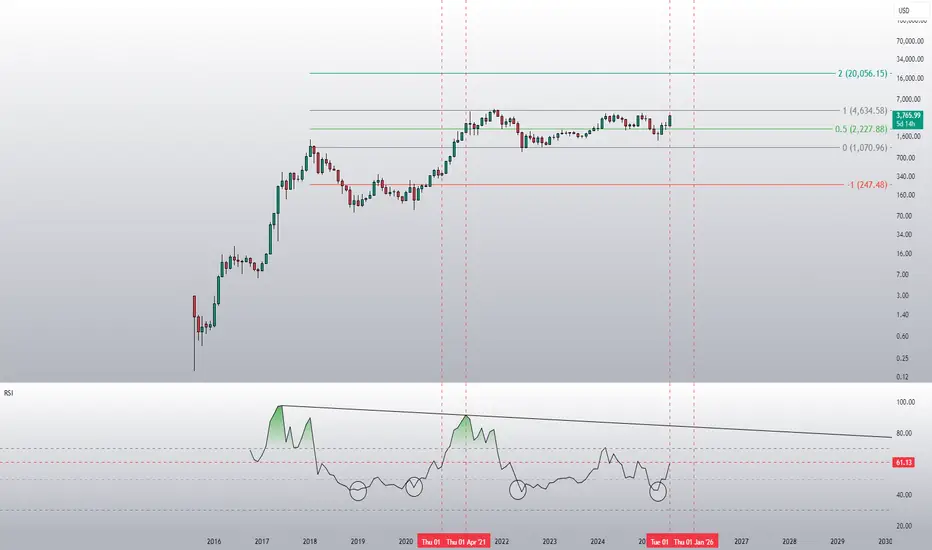
ETH is about to go parabolicDid people realise that Ethereum hit its historical lows on the monthly RSI in April this year? Some people are laughing at the idea of a target of 20k this year, but that would only represent a 20x increase from 2022 to 2025. In contrast, Ethereum achieved a 60x increase from 2018 to 2021.
Look First, Then LeapIn trading, how you prepare matters more than how you react. The phrase “Look first, then leap” reminds traders to avoid impulsive decisions and instead focus on proper analysis, planning, and risk control. Whether you're trading stocks, forex, crypto, or commodities, this principle can save you fro
Eth and the Altcoin Season Once Etherum retest and breaks previous cycle ATH and LMACD visits the diagonal traced from previous cycles (white dot). An altcoins season might follow.

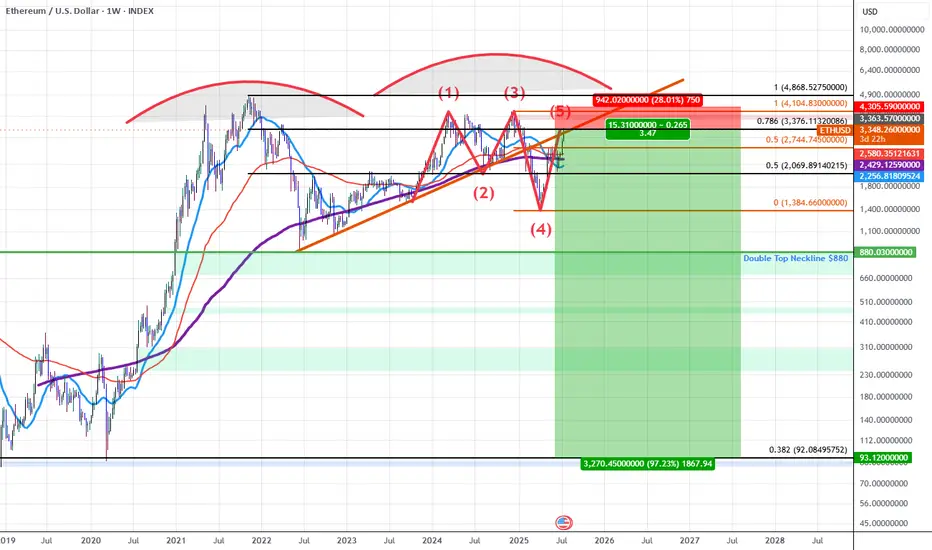
$ETH and the Elliott Wave TheoryFrom the top left, our Wave 3(Blue) retests at the 261.8% Fib. level and then forms a Wave A(Black). Our Wave 2(Blue) was a Zigzag correction and a Flat for Wave 4(Blue) is at per with Elliott Wave Principles. When Wave A(Black) completes, there is a retest and confirmation at the 161.8% Fib. level

Eth long Eth long 1hr confirmation and 5min entry, 1hr confirmation it made a small W and breakout of neckline

ETH to $12,600I think ETH, with all the current fundamental shifts happening in the past 6 months, is prime to run to the golden pocket, a perfect measured move and cup & handle pattern playing out.
1️⃣ Institutional floodgates opening
Spot ETH ETFs have seen massive inflows—billions flowing in just weeks.
Bla

ETHUSD: Double Top into A Bearish 5-0 Breakdown (Extended)Updated Commentary: ETH has extended a bit further than projected as the Pattern Completed at the 0.618 but ETH gapped into the 0.786 instead. The gap up aligned with an upside gap fill on the CME futures as well as a gap fill on the grayscale ETH futures ETF $ETHE. The easier move from here to simp
ETH ETH have a 2 scenarios
1 flat correction
2 motive wave up trend
we need conform this is a flat of motive

be careful @everyone as per we know trend is up so do not enter in short position. Also very importin point is that on BTC and eth bot there is no shadow so sooner or latter price will come back to fulfill this.

See all ideas
Displays a symbol's price movements over previous years to identify recurring trends.