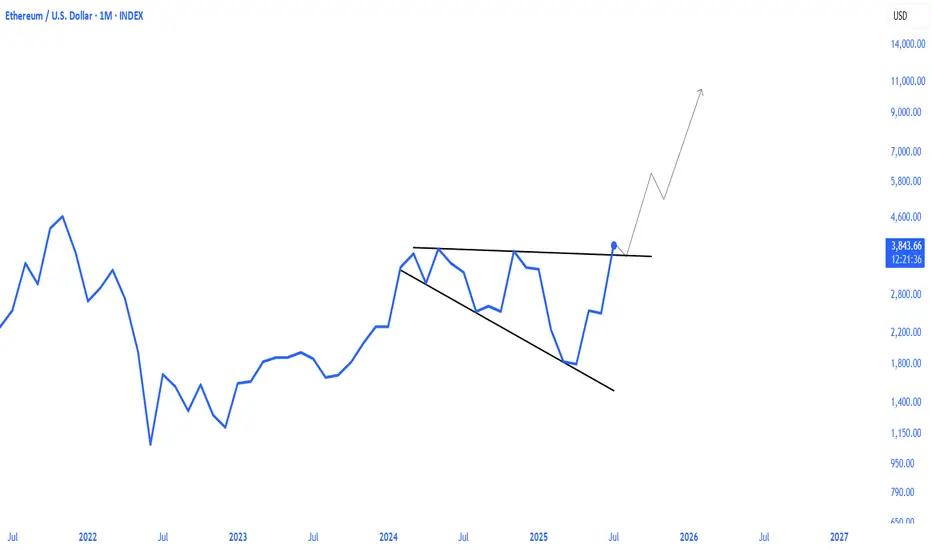
ethereum breakout bullish megaphone pattern ETHEREUM broke the bulish megaphone pattern in the 1M timeframe. it will continue to rise after the retest phase that will occur with the monthly closing today.
ETHUSD trade ideas
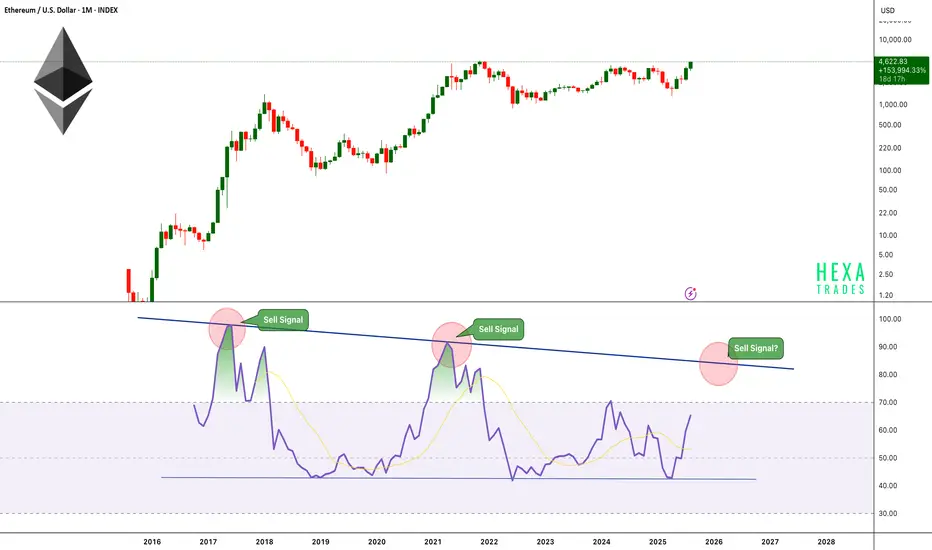
ETH Monthly RSI Approaches Cycle Top? Ethereum is showing strong momentum on the monthly timeframe, pushing toward levels not seen since its previous all-time highs. However, a critical technical indicator, the Monthly RSI is currently at 65 and steadily approaching its historically reliable sell zone between 83–85.
Key Observations:
-The monthly RSI has been capped by a descending trendline resistance since 2017.
-Each time RSI touched this resistance — in 2017 and 2021 — ETH reached a cycle peak, followed by a significant multi-month correction.
-Price is rallying strongly, but RSI still has room to rise before hitting the critical 83–85 zone.
Historical Pattern:
-2017: RSI rejection led to a ~90% decline.
-2021: RSI rejection triggered a ~75% drawdown.
-Now (2025): RSI is climbing toward this zone for the third time, potentially signaling a major profit-taking window once reached.
When the RSI reaches the trend resistance level of 83–85, the price could potentially touch the $7,500–$9,000 range.
Cheers
Hexa
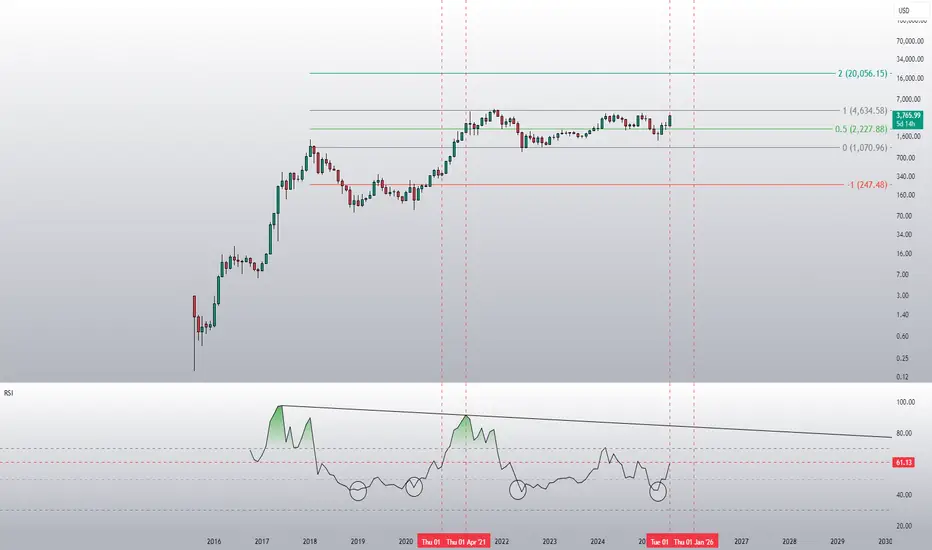
ETH is about to go parabolicDid people realise that Ethereum hit its historical lows on the monthly RSI in April this year? Some people are laughing at the idea of a target of 20k this year, but that would only represent a 20x increase from 2022 to 2025. In contrast, Ethereum achieved a 60x increase from 2018 to 2021.
Look First, Then LeapIn trading, how you prepare matters more than how you react. The phrase “Look first, then leap” reminds traders to avoid impulsive decisions and instead focus on proper analysis, planning, and risk control. Whether you're trading stocks, forex, crypto, or commodities, this principle can save you from painful losses and build a foundation for long-term success.
Let’s break down what it really means to “look first,” and how applying this mindset can improve your trading discipline.
✅Preparation Beats Emotion
Before entering any trade, a trader should ask: What is this trade based on? Logic or emotion?
🔹 Control Impulsive Decisions
Most losing trades happen when people act on gut feelings, FOMO, or after seeing a sudden price spike. But excitement is not a strategy; analysis is.
🔹 Check the Basics First
-What is the market trend? (uptrend, downtrend, or sideways?)
-Are you trading with or against the trend?
-Are there any upcoming news events that might impact the market?
Taking a moment to “look first” gives clarity and filters out low-probability trades.
✅ Trade Only When There’s a Setup
The best trades often come from waiting for the right moment, not forcing entries.
🔹 Identify Clear Patterns
Before jumping in, confirm your strategy setup:
-Is it a breakout or a fakeout?
-Are key support/resistance levels respected?
-Is volume supporting the move?
🔹 Use Confirmation Tools
Indicators like RSI, MACD, and moving averages can support your decision. Price action and patterns like triangle, channel, and flag also provide valuable clues.
Look first means not reacting to the first move; wait for the follow-through.
✅ Always Define Risk and Reward
Entering a trade without a defined stop-loss or target is like jumping into water without checking its depth.
🔹 Use a Risk-Reward Ratio
Before leaping into a trade, ask yourself:
-What am I risking?
-What can I gain?
Aim for a minimum risk-reward ratio of 1:2 or 1:3 to stay profitable even with a lower win rate.
🔹 Position Sizing Matters
Know how much of your capital to allocate. Using 1-2% of your capital per trade helps manage losses and avoid emotional pressure.
✅ Adjust for Market Conditions
Just because you’ve seen success in one type of market doesn’t mean your strategy will always work.
🔹 Trending vs. Ranging Markets
-Trend-following strategies work well in strong trends.
-Mean-reversion or breakout-fade strategies work better in sideways markets.
🔹 Check for Major News or Events
Earnings reports, central bank meetings, or geopolitical events can change everything in seconds. Before entering a trade, look at the calendar.
Adapting to market conditions is part of looking first.
✅ Use a Trading Plan, Not Just a Feeling
Every trade should follow a plan, not just “I think this will go up.”
🔹 What Should Your Plan Include?
Entry and exit rules
-Stop-loss and take-profit levels
-Criteria for valid setups
-Timeframes and trading hours
A plan brings structure and consistency, reducing emotional decisions.
✅ Journaling and Reviewing Trades
Looking first also means learning from the past.
🔹 Keep a Trading Journal
Log every trade entry, exit, reason, emotion, and outcome. This helps you spot mistakes and patterns in your behavior.
🔹 Review Regularly
After a drawdown or losing streak, review your last 10–20 trades. Was your strategy sound? Were you disciplined? Did you look before you leaped?
Improvement comes from reflection and correction.
✅ Be Mentally Ready Before Every Trade
Looking first also means checking your internal state.
🔹 Ask Yourself Before Trading:
-Am I calm and focused?
-Am I trying to recover a loss?
-Am I trading because I’m bored or emotional?
If your mindset is off, step away. A bad state leads to bad decisions—even with a good strategy.
✅Backtest and Practice Before Going Live
Before risking real money, test your setup thoroughly.
🔹 Why Backtesting Helps
It lets you see how your system performs on historical data. This builds confidence and filters out weak strategies.
🔹 Demo Trading Is Smart, Not Weak
Trading in a demo account before going live helps you learn execution, order management, and emotional control—without financial damage.
✅ Protect Capital First, Trade Second
Your first goal isn’t to make money, it’s to stay in the game.
🔹 Survive First, Then Thrive
Big losses can take weeks or months to recover. That’s why looking first is critical—it prevents careless trades that damage your capital.
✅Final Word: Be the Trader Who Waits
The market rewards those who are patient, disciplined, and prepared. Anyone can open a trade, but only those who look first truly understand what they’re doing.
Before your next trade, ask yourself:
“Do I have a clear reason, a defined risk, and the right mindset? Or am I just reacting?”
Because in trading, it’s not how many trades you take, it’s how many good trades you wait for.
In trading, success doesn't come from speed; it comes from clarity, preparation, and discipline. The principle “Look first, then leap” serves as a constant reminder to slow down, observe, analyze, and plan before taking action. It’s a mindset that separates the disciplined trader from the emotional speculator.
Every trade you take should be backed by logic, not impulse. Whether it’s identifying the right setup, managing your risk, or simply being patient enough to wait for confirmation, looking first gives you control in a world that thrives on chaos.
In the end, trading isn’t about making quick money—it’s about making the right decisions consistently. So before your next trade, take a breath, do your research, and ask yourself:
“Am I truly ready to leap, or do I need to look one more time?”
That one extra moment of reflection could be the difference between a lesson and a profit.
Cheers
Hexa🧘♀️
Chart Image Credit: TradingView
Eth and the Altcoin Season Once Etherum retest and breaks previous cycle ATH and LMACD visits the diagonal traced from previous cycles (white dot). An altcoins season might follow.

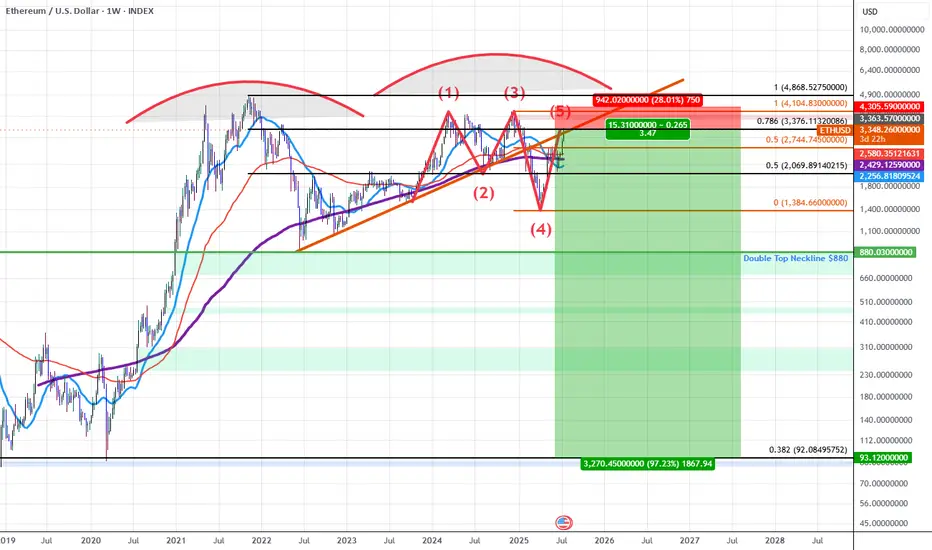
$ETH and the Elliott Wave TheoryFrom the top left, our Wave 3(Blue) retests at the 261.8% Fib. level and then forms a Wave A(Black). Our Wave 2(Blue) was a Zigzag correction and a Flat for Wave 4(Blue) is at per with Elliott Wave Principles. When Wave A(Black) completes, there is a retest and confirmation at the 161.8% Fib. level and this launches our Wave B(Black) which unfolds in three waves. Notices that Wave B(Black) goes beyond the ending of Wave 3(Blue). This is paramount for Flat corrections. After Wave B(Black) is complete, it also retests and confirms at the 261.8% Fib. level. Our next wave is a Wave C(Black) which would be our Wave 4(Blue). When this mentioned Wave 4 completes, we can expect a Wave 5 to begin. Our Wave 5(Blue) expresses itself in 5 waves shown in Green. Wave 1-4 are complete and we are in the last wave of this 5 wave move(Wave 5 Green). We could expect a lunge to the 423.6% Fib. level to complete this 5 wave move. Upon completion, this would be our Wave 5(Blue). A retest and confirmation at the 261.8% and 423.6% Fib. levels would launch a downward move.

Eth long Eth long 1hr confirmation and 5min entry, 1hr confirmation it made a small W and breakout of neckline

ETH to $12,600I think ETH, with all the current fundamental shifts happening in the past 6 months, is prime to run to the golden pocket, a perfect measured move and cup & handle pattern playing out.
1️⃣ Institutional floodgates opening
Spot ETH ETFs have seen massive inflows—billions flowing in just weeks.
BlackRock and other majors are prepping ETFs that may include staking, turning ETH into an institutional yield asset. This is serious structural demand, not retail hype.
2️⃣ Regulatory clarity coming in hot
The GENIUS Act and stablecoin bills in the U.S. are pushing regulatory clarity into crypto markets fast. This reduces uncertainty and increases appetite for ETH from corporates and funds.
3️⃣ Technicals are clean and bullish
ETH flipped $3,300 into support and is holding strong.
Next major resistances at $3,800–$4,100, with ATH at $4,800 firmly back on the radar.
Short-term structure is clear: higher highs, higher lows, solid volume backing it.
4️⃣ On-chain and supply dynamics
Whales are aggressively accumulating—large wallet inflows confirm that.
Staked ETH keeps hitting new highs (~30% of supply locked), tightening available float.
This supply squeeze + ETF demand = bullish cocktail.
5️⃣ Ethereum’s ecosystem dominance is intact
ETH still hosts the lion’s share of stablecoins and DeFi.
Layer-2 scaling is progressing fast, upgrades like EIP-4844 and Pectra coming soon, reducing gas fees and improving UX—critical for future adoption.

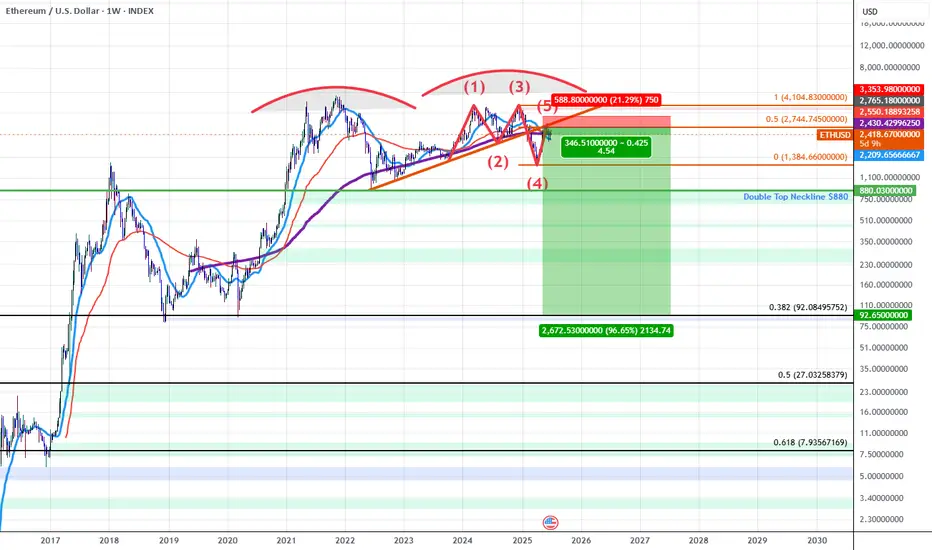
ETHUSD: Double Top into A Bearish 5-0 Breakdown (Extended)Updated Commentary: ETH has extended a bit further than projected as the Pattern Completed at the 0.618 but ETH gapped into the 0.786 instead. The gap up aligned with an upside gap fill on the CME futures as well as a gap fill on the grayscale ETH futures ETF $ETHE. The easier move from here to simply add to the ETH shorts and adjust the stop to be above the previous highs while sizing up at the 0.786 and playing off this gap higher as an anomaly. Beyond this, my view on ETH at the current 0.786 retrace remains the same as the original Idea posted as ETH rose into the initial 0.618 PCZ the details of which I will also include once again below as it still remains relevant.
ETH for the last 5 years has been developing a Double Topping pattern which has put in a series of lower highs during the most recent 2nd run up. As we've confirmed these lower highs we've broken down below trendline and are finding resistance at the trendline which happens to have confluence with the PCZ of a Bearish 5-0 wave formation near a 0.786 retrace.
As we begin to find weakness and Bearish price action begins I suspect price will make it's way towards the neckline of the double top aligning with the $880 price level if ETH breaks below that level there will be no significant support until it reaches the all-time 0.382 retrace down at around $92.10.
In short it seems ETH is in the early stages of a macro breakdown which could result in value declines greater than 80%.
I also suspect that we will see many of the assets that ran up significantly going into this week to sharply reverse those run-ups as this week comes to a close and the new week begins mainly due to the effects of OpEx, this includes: Bitcoin, MSTR, SOL, XLC, META, and BTBT. Long-dated Put accumulation on these assets at these levels is far easier to manage than naked short positions and that's how I will go about positioning here.
ETH ETH have a 2 scenarios
1 flat correction
2 motive wave up trend
we need conform this is a flat of motive

be careful @everyone as per we know trend is up so do not enter in short position. Also very importin point is that on BTC and eth bot there is no shadow so sooner or latter price will come back to fulfill this.

ETH to 10K , Long live the Alts !Hello Traders 🐺
I think it’s finally time to pop the champagne and celebrate the beginning of our favorite season — the one we’ve all been patiently waiting for! 🍾
As I mentioned in my previous idea (you can check it out here:
),
ETH has officially broken above the neckline of the inverse H&S pattern and cleared the major resistance at $2900.
In my opinion, this opens the door for a powerful move toward the $3900 zone — a major pivot level that could be a true game-changer.
But what happens if we actually reach that level?
Let’s shift from short-term to mid-term now, and talk about where I believe ETH could go in this upcoming altseason:
📈 On the weekly chart, we have a massive triangle structure that’s been forming for years.
And honestly? It looks like ETH is about to enter what I call the banana zone 🍌 again.
Yes — if ETH manages to flip $3900 and break its all-time high, there’s literally no strong resistance left on the chart until 10K.
Combine that with current market conditions and BTC.D setup — which I’ve discussed plenty of times (check here:
) —
and you’ve got all the ingredients for a full-blown ETH season.
This could shift the entire dynamic for altcoins.
I'll keep you updated as this plays out — but for now, keep your eyes on the key levels.
Let’s see how bulls and bears react here before we jump further.
And as always, remember:
🐺 Discipline is rarely enjoyable, but almost always profitable. 🐺
🐺 KIU_COIN 🐺

Moon artETH moon art. TY. I am just a guy on the internet. If you measure out prior ATH to ATH, it's over a 200% return, top to top. This is assuming business as usual which is not a great predictor

ETH – Critical Resistance Test Ahead! Hello Traders 🐺
In this quick update, I want to share my view on Ethereum (ETH) and walk you through the current short-term structure and price target.
📊 Technical Insight:
As shown on the chart, ETH is now trading just below a critical confluence zone of resistance between $2650 and $2850.
Here’s what makes this area significant:
🔴 A downward-sloping red trendline acting as dynamic resistance.
🟣 A weekly horizontal resistance sitting firmly at $2850.
This double-layered resistance zone is the main obstacle in ETH’s path right now.
But here’s the good news — if ETH manages to break above the red trendline, there’s a high probability that it could push through the weekly resistance as well. In that case, the next target would likely be the triangle resistance near the $3700 level — the previous swing high.
This could be a major technical breakout in the making.
📌 Key Levels:
Resistance: $2650 – $2850
Breakout Target: $3700
Let me know your thoughts in the comments 👇
And as always — stay sharp, stay patient, and stick to the plan.
🐺 Discipline is rarely enjoyable, but almost always profitable. 🐺
🐺 KIU_COIN 🐺

Head and Shoulder on ETHETH has formed H&S pattern on 1 hr time frame with neckline at 2525 which just got breached targets for this could be 2480 final target 2415 structure would become invalid if 2575 is crossed and ETH sustains above that for now its bearish and a decisive break below 2500 will result in further long unwinding and creating a cascading downward move

ETHUSD: Double Top into A Bearish 5-0 BreakdownETH for the last 5 years has been developing a Double Topping pattern which has put in a series of lower highs during the most recent 2nd run up. As we've confirmed these lower highs we've broken down below trendline and found resistance at the trendline which happens to have confluence with the PCZ of a Bearish 5-0 wave formation.
As we begin to find weakness and Bearish price action begins I suspect price will make it's way towards the neckline of the double top aligning with the $880 price level if ETH breaks below that level there will be no significant support until it reaches the all-time 0.382 retrace down at around $92.10.
In short it seems ETH is in the early stages of a macro breakdown which could result in value declines greater than 80%.
ETH still dancing below $2.9K...Hello Traders 🐺
It’s been a while since I posted anything. Wanna know why?
Because one of the most important principles in trading is patience.
You have to pause and ask yourself:
👉 Is the path I’m on really safe?
👉 Am I thinking like the crowd or am I seeing the bigger picture?
When you open a chart and do your TA, the real skill is in waiting to see if your analysis holds over time. Are your trendlines still valid? Is the pattern still intact?
If you go back and check my last ETH idea, you’ll see that everything is still on track — even after the Iran vs. Israel tensions!
That alone says a lot about the strength of the setup we’ve been watching, my friends.
🔍 Weekly Outlook:
ETH is still trading below a major resistance level (the blue line near $2,900).
If we break above this line with strong confirmation, I believe it’s game on for Altseason — and maybe even a new All-Time High! 🎯
📉 Daily Chart Insight:
📸
On the daily, ETH is forming a potential Inverse Head & Shoulders pattern — and if it plays out, the target aligns with the upper trendline of the triangle, which is our next major resistance zone. 💥
As long as ETH remains below the blue resistance, we stay cautious.
We need a volume-backed breakout before we can say:
🟢 “Alright, it’s time to go all in!”
Hope you found this update helpful — and as always, stick to the golden rule:
🐺 Discipline is rarely enjoyable, but almost always profitable. 🐺
🐺 KIU_COIN 🐺

Ethereum: Power of Three in Motion🗞 The news backdrop is finally starting to improve.
〰️ After a prolonged #Ethereum accumulation phase, the recent wave of bearish headlines triggered a textbook manipulation move — shaking out weak hands and fueling fear across the market. 🙌🧻
Now, with disbelief and panic dominating sentiment, all signs point to the final stage of the Power of Three framework: expansion. 📈
🚀 The market often moves when the majority least expects it.
Are you positioned for what's coming next? 🙃

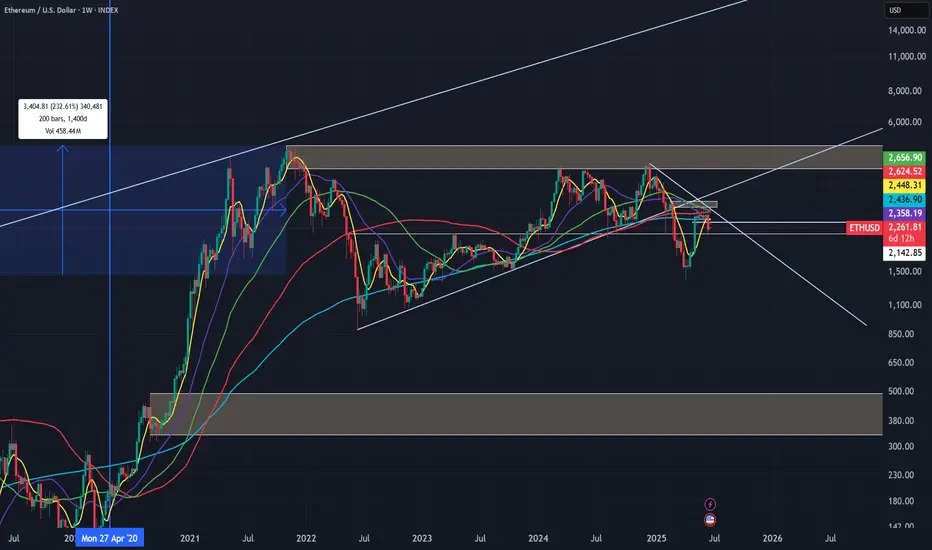
ETH As seen on the ETH chart, after breaking the upward trend, it performs a retest on the downward trend and creates the second peak of the downtrend by taking liquidity. All the moving averages (7, 25, 50, 100, 200) have converged, reinforcing and supporting the trend.
We have 3 scenarios here:
Wait for a break of the downtrend and enter a trade with a reversal candle.
Wait for the moving averages to act as support.
Wait for support from the block order zone around the 500 level — this is the worst-case scenario.
If the first two scenarios happen together, it could push us significantly higher.
At this point, only short positions are advisable — but they must be adjusted according to risk.
Everything written here is based on the weekly chart. It is possible to trade on lower timeframes, but don’t forget — the overall trend is still down.
Anti-bart in July for ETHWherever it bottoms, this is THE dip to buy. Analogue forecasting with fractals similar to the ones I make for Bitcoin. Let's try this.

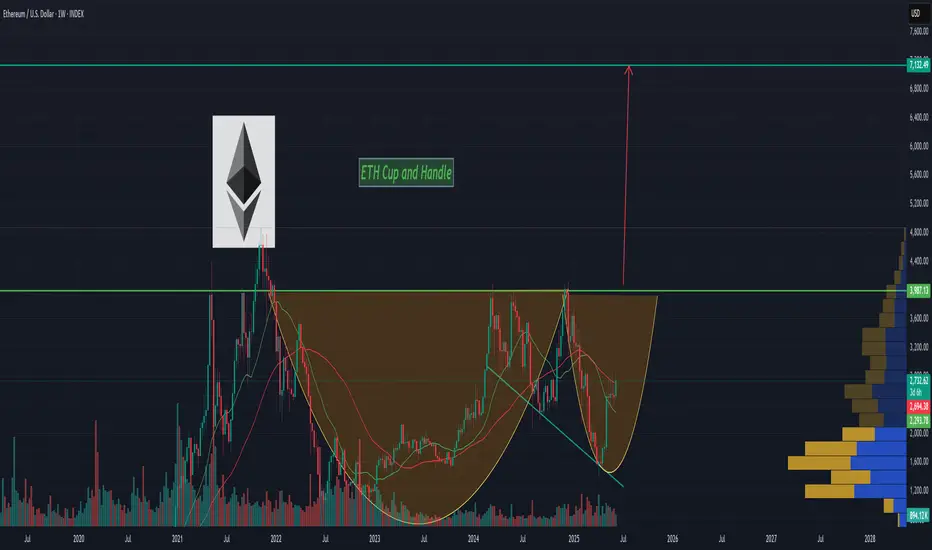
ETH Cup and handle patternETH has been trading on this big range since 2020 and we have form a cup and handle with the neckline around 4100 and the base around 850. With a breakout target of around 7100.
Once we don't go lower then April low it should move up into the 3.1K range and then 4.2K to test the neckline once this area is broken i expect ETH to run hard to over 5.2K.
ETH Breaking Key Resistance Is This the Beginning of Altseason ?Hello Traders 🐺
A few days ago, I posted an idea about ETH—and in my opinion, now it's your moment to decide. But why?
A lot of people still believe there's no Altcoin Season and that ETH or other large-cap alts won’t make significant moves.
However, the on-chain data and the chart are telling a completely different story 📊.
Here’s something I strongly believe in—beside trading skills, you must master your mindset.
If you truly believe in a market direction (up or down), don’t flip your opinion every time you read a different take from an analyst.
These ideas are meant to guide you, not confuse you. And if you’re still uncertain about your direction, maybe it’s time to stop staring at charts for a while and start building real knowledge about your journey and goals.
Sorry if this sounds a bit tough, but as a trader with a responsibility toward my audience, I must be honest and transparent with you.
That’s the only way we grow in this game.
🔍 Now, back to ETH:
If you read my previous ETH idea and took action, you’re probably already in profit ✅.
But I believe the best part might still be ahead!
As shown on the chart, ETH is breaking above a key daily resistance.
If we get a solid close above this level, we might see ETH making a big push—and I wouldn't be surprised to see it reclaim its all-time high against the dollar 🔥
🐺 Discipline is rarely enjoyable, but almost always profitable. 🐺
🐺 KIU_COIN 🐺

Ethereum in consolidation phase!Ethereum has recently broke its daily bearish trend line and is now trending bullish. Currently it is in consolidation phase just below its weekly resistance line of 2787.
Although there was a bearish divergence formed on RSI but was followed by bullish hidden divergence. So at the break of its weekly resistance line of 2787.69 I'll enter with half of the risk.
I'll wait for USDT.D to start falling before entering the trade so that the bias for Ethereum is bullish.
Stop loss will be below 2280 which is below this consolidation range.
TP1: 3361
TP2: 3762
