NATURALGAS - BEARISH Trend/ D cup formation confirmed?NATURALGAS – Weekly Update
Timeframe: 1HR | Symbol: NATURALGAS1! (MCX)
Pattern : D Cup Formation Completed
Natural Gas has formed a textbook "D Cup" pattern, indicating a rounded top reversal structure. After a parabolic rise in late April, prices have gradually given up gains, confirming the pat

Natural Gas | Oil | Dollar | Silver | Gold Price ForecastNatural Gas | Oil | Dollar | Silver | Gold Price Forecast
COMEX:GC1! COMEX:SI1! TVC:DXY NYMEX:CL1!

Natgas - good risk reward for short term longs at CMP. Natgas MCX at 302.7
Expect one wave higher is pending that should take it above 330 towards 336 or 355.
Long with SL at 295

NG1!: Next Move Is Down! Short!
My dear friends,
Today we will analyse NG1! together☺️
The price is near a wide key level
and the pair is approaching a significant decision level of 3.307 Therefore, a strong bearish reaction here could determine the next move down.We will watch for a confirmation candle, and then target the

NG 5/22/25 - Re-engaging the Short side!Here is an update on NG (Natural Gas Futures) via analyzing Cumulative Delta Volume (CDV), divergence between price and the Money Flow Index (MFI), and the 4h and D McGinley Moving Averages!
Happy trading, and I hope the video was helpful!

NATGAS LOCAL SHORT|
✅NATGAS has retested a key resistance level of 3.50$
And as the pair is already making a bearish pullback
A move down to retest the demand level below at 3.30$ is likely
SHORT🔥
✅Like and subscribe to never miss a new idea!✅
Disclosure: I am part of Trade Nation's Influencer program and r

NG1! BEARS ARE STRONG HERE|SHORT
NG1! SIGNAL
Trade Direction: short
Entry Level: 3.790
Target Level: 3.302
Stop Loss: 4.116
RISK PROFILE
Risk level: medium
Suggested risk: 1%
Timeframe: 1D
Disclosure: I am part of Trade Nation's Influencer program and receive a monthly fee for using their TradingView charts in my analysis.
✅L

NATGAS: Long Trade Explained
NATGAS
- Classic bullish pattern
- Our team expects retracement
SUGGESTED TRADE:
Swing Trade
Buy NATGAS
Entry - 3.325
Stop - 3.206
Take - 3.559
Our Risk - 1%
Start protection of your profits from lower levels
Disclosure: I am part of Trade Nation's Influencer program and receive a month

NATGAS Will Collapse! SELL!
My dear friends,
My technical analysis for NATGAS is below:
The market is trading on 3.787 pivot level.
Bias - Bearish
Technical Indicators: Both Super Trend & Pivot HL indicate a highly probable Bearish continuation.
Target - 3.487
Recommended Stop Loss - 3.956
About Used Indicators:
A pivo

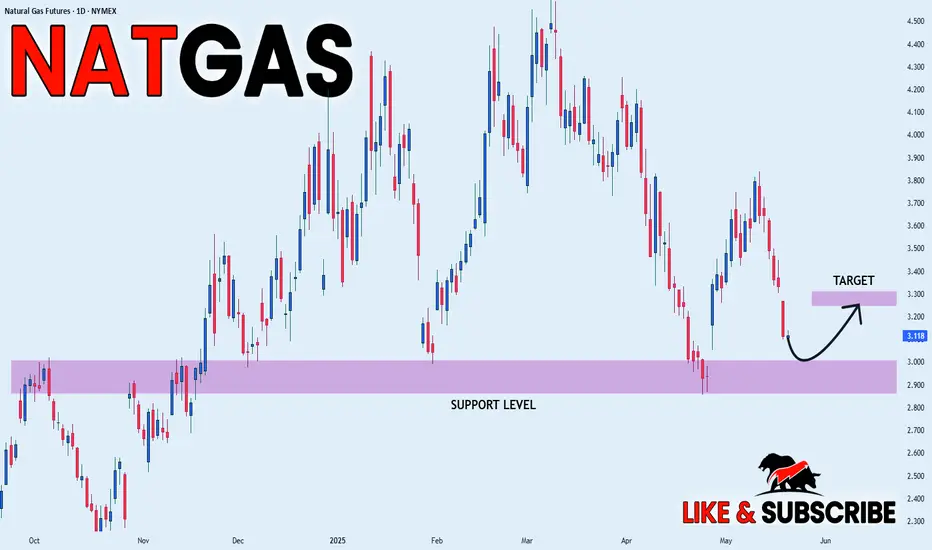
NATGAS SWING LONG|
✅NATGAS is set to retest a
Strong support level below at 2.90$
After trading in a local downtrend from some time
Which makes a bullish rebound a likely scenario
With the target being a local resistance above at 3.26$
LONG🚀
✅Like and subscribe to
See all ideas
A representation of what an asset is worth today and what the market thinks it will be worth in the future.
Displays a symbol's price movements over previous years to identify recurring trends.