Advanced Range Theory - ART📊 Advanced Range Theory (ART): The Institutional Blueprint
Stop drawing lines. Start reading the blueprint of the market. Advanced Range Theory (ART) is not another support and resistance indicator; it is a military-grade market structure engine designed to decode the language of institutional capital. It operates on a single, powerful premise: markets move in phases of consolidation and expansion, and the key to anticipation lies in understanding the complete lifecycle of these phases.
ART provides a living, breathing map of the battlefield, identifying institutional accumulation zones and tracking them with unparalleled precision from their inception as "Pending" ranges to their ultimate classification after a breakout. This is your X-ray into the market's skeletal structure.
🔬 THEORETICAL FRAMEWORK: THE ARCHITECTURE OF PRICE ACTION
ART is built on a multi-layered system of logic that moves beyond static levels. It treats ranges as dynamic entities with a narrative—a beginning, a middle, and an end. The core of the system is the dynamic classification engine, which analyzes not just the range, but the character of the price action that resolves it.
1. The Range Lifecycle: From Accumulation to Classification
This is the revolutionary heart of ART. A range's true identity is only revealed by how it is broken.
Phase 1: PENDING (Yellow): A new range is identified based on a period of price consolidation (a "parent" candle followed by a minimum number of "inside" candles). At this stage, it is a neutral zone of potential energy—an area where institutions are likely building positions. It is a question the market has not yet answered.
Phase 2: MITIGATION & CLASSIFICATION: When price breaks out and reaches a calculated extension level, the range is considered "mitigated." At this exact moment, ART analyzes the breakout's DNA to classify the range's true intent:
TYPE 1 - BREAKOUT (Blue): Characterized by a strong, impulsive move with confirming volume. This is a high-conviction breakout, signaling aggressive institutional participation and the likely start of a new trend. It is a statement of intent.
TYPE 2 - REVERSAL (Orange): Occurs when price attempts to break one way but is aggressively rejected, reversing and breaking out the other side. This signals absorption and a "failed auction," often marking significant market turning points.
TYPE 3 - PIVOT (Green): A more balanced breakout, lacking the explosive momentum of a Type 1. This often represents a resolution after a period of indecision or a pivot within a larger trading range.
2. The Hierarchical Map: Source & S/R Levels
ART doesn't just draw boxes; it builds a genealogical map of market structure.
SOURCE LEVEL (Thick Gold Line): This is the "genesis" point—the most recently mitigated range. It acts as the primary point of origin for the current market swing and serves as a critical level for determining overall bias. Price action above the Source is generally bullish; below is bearish.
S/R LEVELS (Cyan Lines): When a range is mitigated, the price level where it broke becomes a key Support/Resistance zone for the future. ART tracks the two most recent S/R levels, as these often act as powerful magnets or rejection points for price.
3. The Multi-Factor Validation Engine
To eliminate noise and focus only on institutionally significant ranges, every potential range must pass a rigorous quality control check:
Time-Based Consolidation: Requires a minimum number of consecutive inside candles (minInsideCandles), ensuring a true period of balance.
Volatility-Based Significance: The range's size must be greater than a multiple of the Average True Range (minRangeSize), filtering out insignificant micro-consolidations.
Participation Confirmation: The parent candle of the range is checked against average volume to ensure there was meaningful activity during its formation.
⚙️ THE COMMAND CONSOLE: CONFIGURING YOUR ART ENGINE
Every input is designed to give you granular control over the detection engine, allowing you to tune ART to any market or timeframe with precision. Each tooltip in the script provides a deep dive, but here is a summary of the core controls.
🎯 ART Detection Engine
Minimum Inside Candles: The soul of the detection algorithm. It defines the minimum number of bars that must be contained within a single "parent" candle to qualify as a range. Higher values (3-4) find major, significant consolidation zones. Lower values (1-2) are more sensitive and will identify shorter-term accumulation patterns.
Extension Multiplier & Fibonacci Extension: These control the profit target projections. The Extension Multiplier uses a simple measured move (e.g., 1.0 = a 1:1 projection of the range's height). The Fibonacci Extension uses the golden ratio (1.618) for harmonically-derived targets.
Mitigation Method (Cross vs. Close): Determines how a breakout is confirmed. Cross is more responsive, triggering as soon as price touches the extension. Close is more conservative, requiring a full candle to close beyond the level, which helps filter out fake-outs from wicks.
Min Range Size (ATR): A crucial noise filter. It ensures that ART ignores tiny, insignificant ranges by requiring a range's height to be a certain multiple of the current market volatility (ATR).
📊 Display & Visual Configuration
These settings give you full control over the visual interface. You can toggle every single element—from the Webb Scanner to the S/R Levels—to create a clean or a comprehensive view. Choose a color theme that suits your charting environment or define a fully custom palette.
🕸️ Webb Analysis Scanner
This is a unique real-time flow analysis tool. It draws dynamic, animated lines from the current price to recent historical points. This visualization helps reveal hidden "tendrils" of momentum and short-term support/resistance that are not immediately obvious, acting as a "sonar" for immediate price flow.
📊 THE ANALYTICS HUB: YOUR DASHBOARD DECODED
The dashboard provides a real-time, at-a-glance intelligence briefing on the current state of market structure as seen by the ART engine.
RANGE METRICS: This section is a "census" of the market's structure. It tells you the total number of ranges identified, how many are still Pending (awaiting a breakout), how many are Unmitigated (active but not yet broken), and how many have been Mitigated (classified and complete).
TYPE BREAKDOWN: This is a powerful gauge of market character. A high count of Type 1 (Breakout) ranges suggests a strong, trending environment. A rising number of Type 2 (Reversal) ranges can signal market exhaustion and potential trend changes. A dominant Type 3 (Pivot) count indicates a balanced, rotational market.
KEY GUIDE: The Large dashboard includes a full legend, so you never have to guess what a line or color represents. It's your built-in user manual.
🎨 DECODING THE BLUEPRINT: A VISUAL INTERPRETATION GUIDE
Every line and color in ART is designed for instant, intuitive understanding.
The Range Lines:
Yellow Lines: A Pending range. This is an active zone of accumulation. Pay close attention.
Colored Lines (Blue/Orange/Green): An unmitigated, classified range. The color tells you its breakout character.
Dotted Lines: A Mitigated range. Its story has been told. These historical levels can still act as support or resistance.
The Identification Zones: These colored boxes appear at a range's origin point after it has been classified. They are the "birth certificate" of the range, permanently marking its type (Breakout, Reversal, or Pivot) and providing an immediate visual history of market behavior.
The Hierarchical Lines:
Thick Gold Line (Source): The most important line on your chart. It is the anchor for your bias.
Cyan Lines (S/R): High-probability decision points. Expect reactions here.
Purple Dotted Lines (Extensions): Logical, calculated profit targets for breaking ranges.
🔧 THE ARCHITECT'S VISION: THE DEVELOPMENT JOURNEY
ART was born from a deep frustration with the static and subjective nature of traditional market structure analysis. Drawing lines by hand is inconsistent, and most indicators are reactive, only confirming what has already happened. The goal was to create a proactive, objective, and dynamic framework that could think about the market in terms of phases and lifecycles.
The breakthrough came from a simple shift in perspective: a range's true character isn't defined when it forms, but by how it resolves. This led to the development of the "post-breakout classification engine," which waits for the market to show its hand before assigning a definitive type. The Webb Scanner was inspired by the desire to visualize the unseen, to create a tool that could feel the immediate "pull" and "push" of price flow. The result is not just an indicator; it is a new language for interpreting price action, built on a foundation of logic, clarity, and precision.
⚠️ RISK DISCLAIMER & BEST PRACTICES
Advanced Range Theory is a professional-grade analytical tool designed to enhance a trader's decision-making process. It does not provide direct buy or sell signals. The levels and classifications it generates are based on historical price action and mathematical probabilities. All trading involves substantial risk, and past performance is not indicative of future results. Always use this tool in conjunction with a robust risk management plan.
"I fear not the man who has practiced 10,000 kicks once, but I fear the man who has practiced one kick 10,000 times."
— Dskyz, Trade with insight. Trade with anticipation.
— Bruce Lee
Chart patterns

SOL Technical Confluence DashboardHow to Use This Confluence Dashboard
Setup Instructions:
Use the other script published as the 1 of 2 scripts to add to your 4-hour SOL chart.
What You'll See:
1. RSI Panel with Enhancements
Colored RSI line (Green = oversold, Red = overbought)
Divergence detection (triangles mark divergences)
Background color changes on strong signals
2. Confluence Table (Top Right)
Shows real-time status of:
RSI: Current value and signal
MACD: Trend direction
Volume: Spike detection and relative volume
Divergence: Bull/Bear divergence alerts
Confluence Scores: 0-10 scale for bull/bear strength
Overall Signal: STRONG BUY/SELL, BUY/SELL, or WAIT
3. Net Confluence Histogram (Bottom)
Green bars = Bullish confluence
Red bars = Bearish confluence
Height = Strength of signal
How It Works with Elliott Waves:
Scenario 1: Wave 5 Top Detection
Elliott Wave shows Wave 5 approaching 261.8%
Confluence Dashboard shows:
RSI: 78 (overbought) ❌
MACD: Bearish cross ❌
Volume: Declining ❌
Divergence: Bearish ❌
Signal: STRONG SELL 🔴
Scenario 2: Wave 2 Bottom
Elliott Wave shows Wave 2 at 61.8% retracement
Confluence Dashboard shows:
RSI: 28 (oversold) ✅
MACD: Bullish cross ✅
Volume: Spike ✅
Divergence: Bullish ✅
Signal: STRONG BUY 🟢
Confluence Scoring System:
The script uses a weighted scoring system:
Divergences: 3 points (most reliable)
RSI extremes: 2 points
Volume spikes: 2 points
MACD signals: 1.5 points
Price action: 1 point
Signals:
Score ≥ 5 = STRONG signal
Score ≥ 3 = Moderate signal
Score < 3 = WAIT
Pro Tips for Maximum Accuracy:
Best Setups: When Elliott Wave completion aligns with STRONG signals
Avoid: Taking trades when confluence is mixed
Volume Confirmation: Always check if volume supports the move
Divergence Priority: RSI divergence at wave endpoints is highly reliable
Alerts Available:
Strong Bullish Confluence
Strong Bearish Confluence
Bullish Divergence
Bearish Divergence
This gives you a complete technical analysis suite that works seamlessly with your Elliott Wave indicator. The combination significantly improves accuracy by confirming wave counts with momentum, volume, and divergence analysis!

Buy & Sell Arrows with Candle Line [mark804]The TrendZone FVG Suite is a premium trading toolkit that combines three powerful strategies into one clean and professional display. Designed for clarity and precision, this indicator helps traders make confident entries and exits across any market or timeframe.
1. Detects precise Buy & Sell zones using dual Moving Average crossover logic.
2. Multi-timeframe support gives more accurate trend confirmation.
3. Automatically highlights Bullish & Bearish Fair Value Gaps (FVGs).
4. Plots Support and Resistance zones using smart swing logic.
5. Displays clean Buy/Sell arrows with vertical candle lines for clarity.
6. Fully customizable — MA types, timeframes, visibility toggles.
7. Color-coded zones and labels give visual confirmation of structure.
8. Built-in alerts for trend shifts — great for real-time or automation use.

TrendZoneTrendZone - Fibonacci Trendline Indicator
TrendZone is a custom Pine Script indicator that automatically draws fibonacci-based trendlines between key pivot points on your chart.
Key Features:
3 Pivot Points: Set start point, major pivot (reversal), and end point
Dual Trendlines: First trendline (Point 1 → 2) and second trendline (Point 2 → 3)
Fibonacci Levels: Automatically draws 25%, 50%, and 100% fibonacci levels for each trendline
Auto Trend Detection: Automatically identifies bullish/bearish trends and adjusts colors accordingly
Customizable: Full control over colors, line styles, and widths for each fibonacci level
How it Works:
The indicator uses your selected pivot points to create two connected trendline systems. Point 2 serves as the major pivot where the first trend ends and the reversal begins. Each trendline system includes fibonacci retracement levels that extend to the right, helping identify potential support/resistance zones.
Use Cases:
Identifying trend reversals at key pivot points
Finding potential support/resistance levels using fibonacci projections
Visualizing market structure changes between different time periods
Planning entries/exits based on fibonacci trendline interactions
Perfect for traders who use fibonacci analysis combined with trend structure to identify high-probability trading zones.

SOL Elliott Wave 4H with Enhanced ProjectionsThis 4H-optimized version includes:
Key Features for 4H Timeframe:
Optimized Default Settings:
Wave Detection Period: 7 (perfect for 4H)
ZigZag Depth: 3% (captures significant moves on 4H)
Visual Indicators:
Small circles mark pivot points as they form
Blue background on the last bar shows script is active
Clean zigzag lines between pivots
Wave numbers at each pivot
Immediate Feedback:
Pivots show up as soon as they're confirmed
Table shows pivots found count
Current price always visible
To Use This:
Add to your 4H SOL chart
You should immediately see:
Small circles marking recent pivots
The info table in top-right
Blue highlight on the current bar
If you don't see lines yet, try:
Reduce Wave Detection Period to 5
Reduce ZigZag Depth to 2%
Make sure you have at least 100-200 bars of history loaded
Fine-tuning for current market:
If SOL is ranging: Lower ZigZag Depth to 2%
If SOL is trending strongly: Increase to 4-5%
The indicator will start drawing zigzag lines and counting waves as soon as it finds valid alternating highs and lows that meet the minimum percentage move requirement.

Reversal IndicatorWhat does this indicator do?
This indicator is designed to help traders spot potential reversal points in the market by combining multiple conditions:
✅ Multi-Timeframe RSI – Checks RSI on a lower timeframe (like 5m) to see if the market is oversold or overbought.
✅ Higher Timeframe SMA Filter – Uses a higher timeframe SMA (like 1h) as a trend filter, so signals only trigger in the direction of the bigger trend.
✅ Candle Pattern Confirmation – Looks for bullish or bearish engulfing candles to confirm price exhaustion before signaling a reversal.
When all these conditions align, the indicator plots a triangle under/above the candle to highlight a possible reversal.
Why is this useful?
Many traders struggle with false RSI signals or candle patterns that fail because they don’t respect the larger trend.
This indicator filters out weak setups by requiring alignment between:
A lower timeframe RSI oversold/overbought condition,
A higher timeframe trend filter (SMA),
And a strong candle reversal pattern.
This multi-layer approach helps avoid chasing every RSI dip and focuses only on high-probability reversal zones.
How does it work?
Bullish reversal signal → appears when RSI on the lower TF is oversold, price is still above the higher TF SMA (trend still intact), AND a bullish engulfing candle forms.
Bearish reversal signal → appears when RSI on the lower TF is overbought, price is below the higher TF SMA, AND a bearish engulfing candle forms.
When all conditions match, the indicator plots a triangle under the candle for bullish signals and above the candle for bearish signals.
How to use it?
Choose your timeframes:
A timeframe for trend filtering (e.g. 1h).
A timeframe for RSI (e.g. 4h).
NOTICE: THE RSI TIMEFRAME SHOULD BE GREATER THEN THE TIMEFRAME FOR THE SMA
Otherwise it will not generate that much signals.
Watch for signals ONLY in the direction of the higher trend.
Use the signals as potential reversal points, not as guaranteed entries. Combine with your own confluence.
Optionally set alerts for bullish or bearish reversal conditions so you never miss a setup.
Customization
✅ Choose your RSI length & overbought/oversold levels.
✅ Select which timeframes you want for SMA & RSI.
✅ Toggle the higher TF SMA display on/off.
✅ Adjust signal appearance (triangles).
Important Notes
⚠️ This is not a standalone trading system. It’s a tool to help spot possible reversal areas. Always confirm with price action, support/resistance, or your own strategy

High/Low in Last N BarsThis chart indicator labels the highest and lowest prices over a period of time that you can configure. The labels make it easy to identify the highs and lows.

Trading session High/Low (Lumiere)Trading session High/Low
What it does:
Plots the High and Low for each session (Asia, London, New York) as horizontal zones that “snap” to the first true extreme of the session and then extend right.
Key points:
Snap‑to‑extreme only: Lines don’t draw at the open; they appear only once price makes a new session high or low, and anchor exactly at that bar.
Persistent until next session: Once drawn, each session’s lines stay on the chart after the session ends, and are cleared only when that same session next opens (or when you hide it).
Three configurable sessions:
Asia: 18:00–03:00 (UTC‑4)
London: 03:00–09:30 (UTC‑4)
New York: 09:30–16:00 (UTC‑4)
Customizable appearance:
You can toggle each session on/off, choose its color, and set line width.
The time that is already set on the different sessions is based on the standard session open/close. If you want to change it, it will refer to the NY time, UTC -4.

N-Pattern Detector (Advanced Logic)Introduction
The N-Pattern Detector (Advanced Logic) is a powerful Pine Script-based tool designed to identify a specific price structure known as the "N-pattern", which often indicates trend continuation or potential breakout points in the market. This pattern combines zigzag pivot logic, retracement filters, volume confirmation, and trend alignment, offering high-probability trading signals.
It is ideal for traders who want to automate pattern detection while applying smart filters to reduce false signals in various markets — including stocks, forex, crypto, and indices.
What is the N-Pattern?
The N-pattern is a 3-leg price formation consisting of points A-B-C-D. It typically follows this structure:
Bullish N-Pattern:
A → Low Pivot
B → Higher High (Impulse)
C → Higher Low (Retracement)
D → Breakout above B (Confirmation)
Bearish N-Pattern:
A → High Pivot
B → Lower Low (Impulse)
C → Lower High (Retracement)
D → Breakdown below B (Confirmation)
The pattern essentially reflects a trend–pullback–breakout structure, making it suitable for continuation trades.
Key Features
1. Intelligent ZigZag Pivot Detection
Uses pivot highs/lows to define key swing points (A, B, C).
Adjustable ZigZag depth to control pattern sensitivity.
Filters noise and avoids false signals in volatile markets.
2. Retracement Validation
Validates the B→C leg as a proper pullback using Fibonacci-based thresholds.
User-defined min and max retracement settings (e.g., 38.2% to 78.6% of A→B leg).
3. Trend Filter via EMA
Filters patterns based on trend direction using a customizable EMA (e.g., 200 EMA).
Only detects bullish patterns above EMA and bearish patterns below EMA (optional).
4. Volume Confirmation
Ensures that impulse legs (A→B, C→D) are supported by stronger volume than the correction leg (B→C).
Adds another layer of confirmation and reliability to detected patterns.
5. Target Projections
Automatically draws 100% A→B projected target from point C.
Optional Fibonacci extensions at 1.272 and 1.618 levels for take-profit planning.
Visually plotted on the chart with colored dashed/dotted lines.
6. Clear Visuals & Labels
Connects all pattern points with colored lines.
Clearly labels points A, B, C, D on the chart.
Uses customizable colors for bullish and bearish patterns.
Includes real-time alerts when a valid pattern is detected.
How to Use It
Add to Chart
Apply the indicator to any chart and time frame. It works across all asset classes.
Adjust Inputs (Optional)
Set ZigZag Depth to control pivot detection sensitivity.
Define Min/Max Retracement levels to match your trading style.
Enable or disable Trend and Volume filters for cleaner signals.
Customize EMA length (default: 200) for trend validation.
Wait for Pattern Confirmation
The indicator constantly scans for valid N-patterns.
A pattern is confirmed only after point D forms (breakout or breakdown).
You’ll see the full pattern drawn with target levels.
Set Alerts
Alerts trigger automatically on confirmation of a bullish or bearish pattern.
You can customize these in TradingView’s alerts panel.

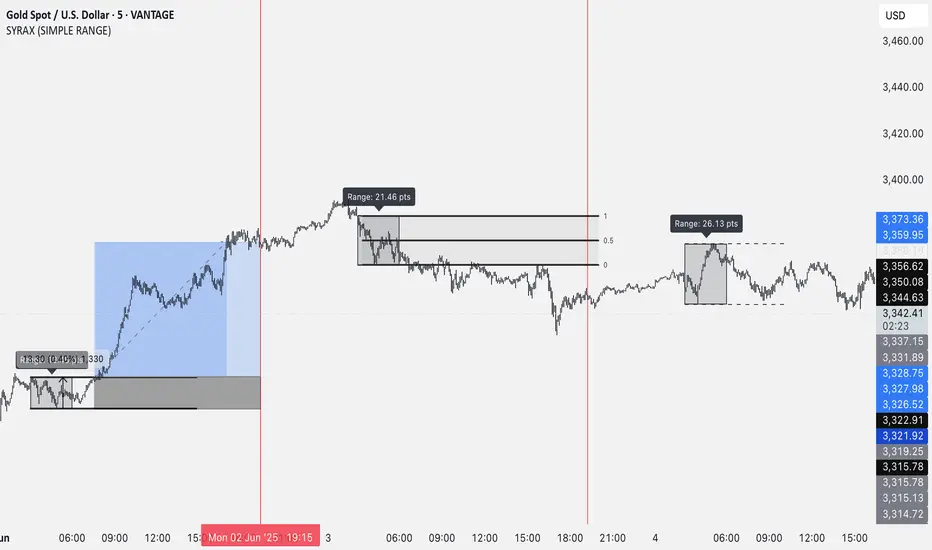
SYRAX (SIMPLE RANGE)SYRAX (SIMPLE RANGE) is a minimalist indicator designed for traders who focus on range breakouts. If you’re someone who just needs one clean and consistent range plotted every day to execute your strategy, this tool is for you.
The indicator defines a customizable time range on your chart and highlights the high and low of that session, helping you visualize potential breakout zones. A vertical line can also be drawn at a specific time each day to assist with your session planning.
Features:
• Automatically draws the daily range box based on your chosen start and end time.
• Timezone setting to align the range with your local or market session.
• Clean visuals with editable box color, border, and text labels.
• Optional extended range lines and vertical session markers.
Whether you’re trading early session breakouts or waiting for liquidity sweeps, SYRAX gives you the structure you need — nothing more, nothing less.
3Ema-Gann_Swing_V2-ICT Killzones_Pivots_TFO3ema
// This source code is subject to the terms of the Mozilla Public License 2.0 at mozilla.org
// © meomeo105
//@version=5
indicator('3Ema-Gann_Swing_V2-ICT Killzones_Pivots_TFO', shorttitle='3Ema-GSv2-Killzones_Pivots', overlay=true, max_lines_count=500)
//Gann Swing V2
//-----Input-------
customTF = input.timeframe(defval="",title = "Show Other TimeFrame")
GroupGann = "Gann"
showGann = input.bool(true, 'Show Gann/Style', group = GroupGann,inline = "Gann/Style")
lineGann = input.string(title="",options= ,defval='(╌)', group = GroupGann, inline = "Gann/Style")
lineStyleGann = lineGann == "(┈)" ? line.style_dotted : lineGann == "(╌)" ? line.style_dashed : line.style_solid
colorGann = input.color(color.white, 'Color/Width', group = GroupGann, inline = "Color/Width")
widthGann = input.int(defval=1,title = "",minval=1, step=1, group = GroupGann, inline = "Color/Width")
ignoreISB = input.bool(true, 'Ignore Inside Bar', group = GroupGann, inline = "ignoreISB")
GroupSGann = "Swing of Gann"
showSGann = input.bool(true, 'Show Swing/Style', group = GroupSGann, inline = "Swing/Style")
lineSGann = input.string(title="",options= ,defval="(─)", group = GroupSGann, inline = "Swing/Style")
lineStyleSGann = lineSGann == "(┈)" ? line.style_dotted : lineSGann == "(╌)" ? line.style_dashed : line.style_solid
colorSGann = input.color(color.aqua, 'Color/Width', group = GroupSGann, inline = "Color/Width")
widthSGann = input.int(defval=1,title = "",minval=1,step=1, group = GroupSGann, inline = "Color/Width")
showChoCh = input.bool(false, 'Show ChoCh', group = GroupSGann,inline = "Choch")
show2ChoCh = input.bool(true, 'Show 2Choch/Color', group = GroupSGann,inline = "2Choch")
color2Choch = input.color(color.aqua, '', group = GroupSGann,inline = "2Choch")
showLabel = input.bool(true, 'Show Label TimeFrame',group = GroupSGann)
//////////////////////////Global//////////////////////////
var arrayLineTemp = array.new_line()
// Converts a resolution expressed in minutes into a string usable by "security()"
f_resFromMinutes(_minutes) =>
_minutes < 1 ? str.tostring(math.round(_minutes*60)) + "S" :
_minutes < 60 ? str.tostring(math.round(_minutes)) + "m" :
_minutes < 1440 ? str.tostring(math.round(_minutes/60)) + "H" :
_minutes < 10080 ? str.tostring(math.round(math.min(_minutes / 1440, 7))) + "D" :
_minutes < 43800 ? str.tostring(math.round(math.min(_minutes / 10080, 4))) + "W" :
str.tostring(math.round(math.min(_minutes / 43800, 12))) + "M"
var arrayLineChoCh = array.new_line()
var label labelTF = label.new(time, close, text = "",color = color.new(showSGann ? colorSGann : colorGann,95), textcolor = showSGann ? colorSGann : colorGann,xloc = xloc.bar_time, textalign = text.align_left)
//////////////////////////Gann//////////////////////////
styleGann = showSGann ? line.style_dashed : line.style_solid
var arrayXGann = array.new_int(5,time)
var arrayYGann = array.new_float(5,close)
var arrayLineGann = array.new_line()
int drawLineGann = 0
secondCustomTF = request.security(syminfo.tickerid,customTF,timeframe.in_seconds(),lookahead=barmerge.lookahead_on)
_high = request.security(syminfo.tickerid,customTF,high,lookahead=barmerge.lookahead_on)
_low = request.security(syminfo.tickerid,customTF,low,lookahead=barmerge.lookahead_on)
_close = request.security(syminfo.tickerid,customTF,close,lookahead=barmerge.lookahead_on)
_open = request.security(syminfo.tickerid,customTF,open,lookahead=barmerge.lookahead_on)
highPrev = _high
lowPrev = _low
// drawLineGann => 2:Tiếp tục 1:Đảo chiều; // Outsidebar 2:Tiếp tục 3:Tiếp tục và Đảo chiều 4 : Đảo chiều 2 lần
drawLineGann := 0
if(_high > highPrev and _low > lowPrev )
if(array.get(arrayYGann,0) > array.get(arrayYGann,1))
if(_high > array.get(arrayYGann,0))
if(_high <= high)
array.set(arrayXGann, 0, time)
array.set(arrayYGann, 0, _high )
drawLineGann := 2
else
array.unshift(arrayXGann,time)
array.unshift(arrayYGann,_high )
drawLineGann := 1
else if(_high < highPrev and _low < lowPrev )
if(array.get(arrayYGann,0) > array.get(arrayYGann,1))
array.unshift(arrayXGann,time)
array.unshift(arrayYGann,_low )
drawLineGann := 1
else
if(_low < array.get(arrayYGann,0))
if(_low >= low)
array.set(arrayXGann, 0, time)
array.set(arrayYGann, 0, _low )
drawLineGann := 2
else if((_high >= highPrev and _low < lowPrev ) or (_high > highPrev and _low <= lowPrev ))
if(array.get(arrayYGann,0) > array.get(arrayYGann,1))
if(_high >= array.get(arrayYGann,0) and array.get(arrayYGann,1) <= _low )
if(_high <= high)
array.set(arrayXGann, 0, time)
array.set(arrayYGann, 0, _high )
drawLineGann := 2
else if(_high >= array.get(arrayYGann,0) and array.get(arrayYGann,1) >= _low )
if(_close < _open)
if(_high <= high)
array.set(arrayXGann, 0, time)
array.set(arrayYGann, 0, _high )
array.unshift(arrayXGann,time)
array.unshift(arrayYGann,_low )
drawLineGann := 3
else
array.unshift(arrayXGann,time)
array.unshift(arrayYGann,_low )
array.unshift(arrayXGann,time)
array.unshift(arrayYGann,_high )
drawLineGann := 4
else if(array.get(arrayYGann,0) < array.get(arrayYGann,1))
if(_low <= array.get(arrayYGann,0) and _high <= array.get(arrayYGann,1))
if(_low >= low)
array.set(arrayXGann, 0, time)
array.set(arrayYGann, 0, _low )
drawLineGann := 2
else if(_low <= array.get(arrayYGann,0) and _high >= array.get(arrayYGann,1))
if(_close > _open)
if(_low >= low)
array.set(arrayXGann, 0, time)
array.set(arrayYGann, 0, _low )
array.unshift(arrayXGann,time)
array.unshift(arrayYGann,_high )
drawLineGann := 3
else
array.unshift(arrayXGann,time)
array.unshift(arrayYGann,_high )
array.unshift(arrayXGann,time)
array.unshift(arrayYGann,_low )
drawLineGann := 4
else if((_high <= highPrev and _low >= lowPrev ) and ignoreISB)
highPrev := highPrev
lowPrev := lowPrev
if(timeframe.in_seconds() < secondCustomTF and drawLineGann == 0)
if(array.get(arrayYGann,0) > array.get(arrayYGann,1))
if(array.get(arrayYGann,0) <= high)
array.set(arrayXGann, 0, time)
drawLineGann := 2
else
if(array.get(arrayYGann,0) >= low)
array.set(arrayXGann, 0, time)
drawLineGann := 2
if(showGann and timeframe.in_seconds() <= secondCustomTF)
if(drawLineGann == 2)
if(array.size(arrayLineGann) >0)
line.set_xy2(array.get(arrayLineGann,0),array.get(arrayXGann,0),array.get(arrayYGann,0))
else
array.unshift(arrayLineGann,line.new(array.get(arrayXGann,1),array.get(arrayYGann,1),array.get(arrayXGann,0),array.get(arrayYGann,0), color = colorGann,xloc = xloc.bar_time,width = widthGann,style=lineStyleGann))
else if(drawLineGann == 1)
array.unshift(arrayLineGann,line.new(array.get(arrayXGann,1),array.get(arrayYGann,1),array.get(arrayXGann,0),array.get(arrayYGann,0), color = colorGann,xloc = xloc.bar_time,width = widthGann,style=lineStyleGann))
else if(drawLineGann == 3)
if(array.size(arrayLineGann) >0)
line.set_xy2(array.get(arrayLineGann,0),array.get(arrayXGann,1),array.get(arrayYGann,1))
else
array.unshift(arrayLineGann,line.new(array.get(arrayXGann,2),array.get(arrayYGann,2),array.get(arrayXGann,1),array.get(arrayYGann,1), color = colorGann,xloc = xloc.bar_time,width = widthGann,style=lineStyleGann))
array.unshift(arrayLineGann,line.new(array.get(arrayXGann,1),array.get(arrayYGann,1),array.get(arrayXGann,0),array.get(arrayYGann,0), color = colorGann,xloc = xloc.bar_time,width = widthGann,style=lineStyleGann))
else if(drawLineGann == 4)
array.unshift(arrayLineGann,line.new(array.get(arrayXGann,2),array.get(arrayYGann,2),array.get(arrayXGann,1),array.get(arrayYGann,1), color = colorGann,xloc = xloc.bar_time,width = widthGann,style=lineStyleGann))
array.unshift(arrayLineGann,line.new(array.get(arrayXGann,1),array.get(arrayYGann,1),array.get(arrayXGann,0),array.get(arrayYGann,0), color = colorGann,xloc = xloc.bar_time,width = widthGann,style=lineStyleGann))
//////////////////////////Swing Gann//////////////////////////
var arrayXSGann = array.new_int(5,time)
var arrayYSGann = array.new_float(5,close)
var arrayLineSGann = array.new_line()
int drawLineSGann = 0
int drawLineSGann1 = 0
bool runCheckChoChSGann = false
runCheckChoChSGann := runCheckChoChSGann
if(showSGann)
if(math.max(array.get(arrayYSGann,0),array.get(arrayYSGann,1)) < math.min(array.get(arrayYGann,0),array.get(arrayYGann,1)) or math.min(array.get(arrayYSGann,0),array.get(arrayYSGann,1)) > math.max(array.get(arrayYGann,0),array.get(arrayYGann,1)))
//Khởi tạo bắt đầu
drawLineSGann1 := 5
array.set(arrayXSGann, 0, array.get(arrayXGann,1))
array.set(arrayYSGann, 0, array.get(arrayYGann,1))
array.unshift(arrayXSGann,array.get(arrayXGann,0))
array.unshift(arrayYSGann,array.get(arrayYGann,0))
// drawLineSGann kiểm tra điểm 1 => 13:Tiếp tục có sóng hồi // 12|19(reDraw):Tiếp tục không có sóng hồi // 14:Đảo chiều
if(array.get(arrayXGann,0) == array.get(arrayXGann,1))
if(array.get(arrayXSGann,0) >= array.get(arrayXGann,2) and array.get(arrayYSGann,0) != array.get(arrayYGann,1) and ((array.get(arrayYGann,1) > array.get(arrayYGann,2) and array.get(arrayYSGann,0) > array.get(arrayYSGann,1)) or (array.get(arrayYGann,1) < array.get(arrayYGann,2) and array.get(arrayYSGann,0) < array.get(arrayYSGann,1))))
drawLineSGann1 := 12
array.set(arrayXSGann, 0, array.get(arrayXGann,1))
array.set(arrayYSGann, 0, array.get(arrayYGann,1))
else if(array.get(arrayXSGann,0) <= array.get(arrayXGann,2))
if((array.get(arrayYSGann,0) > array.get(arrayYSGann,1) and array.get(arrayYGann,1) < array.get(arrayYSGann,1)) or (array.get(arrayYSGann,0) < array.get(arrayYSGann,1) and array.get(arrayYGann,1) > array.get(arrayYSGann,1)))
drawLineSGann1 := 14
runCheckChoChSGann := true
array.unshift(arrayXSGann,array.get(arrayXGann,1))
array.unshift(arrayYSGann,array.get(arrayYGann,1))
else if((array.get(arrayYSGann,0) > array.get(arrayYSGann,1) and array.get(arrayYGann,1) > array.get(arrayYSGann,0)) or (array.get(arrayYSGann,0) < array.get(arrayYSGann,1) and array.get(arrayYGann,1) < array.get(arrayYSGann,0)))
drawLineSGann1 := 13
_max = math.min(array.get(arrayYSGann,0),array.get(arrayYSGann,1))
_min = math.max(array.get(arrayYSGann,0),array.get(arrayYSGann,1))
_max_idx = 0
_min_idx = 0
for i = 2 to array.size(arrayXGann)
if(array.get(arrayXSGann,0) >= array.get(arrayXGann,i))
break
if(_min > array.get(arrayYGann,i))
_min := array.get(arrayYGann,i)
_min_idx := array.get(arrayXGann,i)
if(_max < array.get(arrayYGann,i))
_max := array.get(arrayYGann,i)
_max_idx := array.get(arrayXGann,i)
if(array.get(arrayYSGann,0) > array.get(arrayYSGann,1))
array.unshift(arrayXSGann,_min_idx)
array.unshift(arrayYSGann,_min)
else if(array.get(arrayYSGann,0) < array.get(arrayYSGann,1))
array.unshift(arrayXSGann,_max_idx)
array.unshift(arrayYSGann,_max)
array.unshift(arrayXSGann,array.get(arrayXGann,1))
array.unshift(arrayYSGann,array.get(arrayYGann,1))
if(timeframe.in_seconds() < secondCustomTF)
if(array.get(arrayYSGann,0) == array.get(arrayYGann,1) and array.get(arrayXSGann,0) != array.get(arrayXGann,1))
array.set(arrayXSGann, 0, array.get(arrayXGann,1))
drawLineSGann1 := 19
if(timeframe.in_seconds() <= secondCustomTF)
if(drawLineSGann1 == 12 or drawLineSGann1 == 19)
if(array.size(arrayLineSGann) >0)
line.set_xy2(array.get(arrayLineSGann,0),array.get(arrayXSGann,0),array.get(arrayYSGann,0))
else
array.unshift(arrayLineSGann,line.new(array.get(arrayXSGann,1),array.get(arrayYSGann,1),array.get(arrayXSGann,0),array.get(arrayYSGann,0), color = colorSGann,xloc = xloc.bar_time,width = widthGann,style=lineStyleSGann))
else if(drawLineSGann1 == 14)
array.unshift(arrayLineSGann,line.new(array.get(arrayXSGann,1),array.get(arrayYSGann,1),array.get(arrayXSGann,0),array.get(arrayYSGann,0), color = colorSGann,xloc = xloc.bar_time,width = widthGann,style=lineStyleSGann))
else if(drawLineSGann1 == 13)
array.unshift(arrayLineSGann,line.new(array.get(arrayXSGann,2),array.get(arrayYSGann,2),array.get(arrayXSGann,1),array.get(arrayYSGann,1), color = colorSGann,xloc = xloc.bar_time,width = widthGann,style=lineStyleSGann))
array.unshift(arrayLineSGann,line.new(array.get(arrayXSGann,1),array.get(arrayYSGann,1),array.get(arrayXSGann,0),array.get(arrayYSGann,0), color = colorSGann,xloc = xloc.bar_time,width = widthGann,style=lineStyleSGann))
if(runCheckChoChSGann)
runCheckChoChSGann := false
// ChoCh Trường hợp chữ N ngược, chữ N
if((array.get(arrayYSGann,3) > array.get(arrayYSGann,2) and array.get(arrayYSGann,3) < array.get(arrayYSGann,1) and array.get(arrayYSGann,0) < array.get(arrayYSGann,2)) or (array.get(arrayYSGann,3) < array.get(arrayYSGann,2) and array.get(arrayYSGann,3) > array.get(arrayYSGann,1) and array.get(arrayYSGann,0) > array.get(arrayYSGann,2)))
alert(syminfo.ticker + " : " + timeframe.period + " => Swing of Gann ChoCh" + (array.get(arrayYSGann,0) > array.get(arrayYSGann,1) ? "+ ⇑" : "- ⇓"))
if(showChoCh)
array.unshift(arrayLineChoCh,line.new(x1= array.get(arrayXSGann,2) , y1=array.get(arrayYSGann,2),x2=array.get(arrayXSGann,0), y2=array.get(arrayYSGann,2),color = colorSGann,xloc = xloc.bar_time,style = line.style_dotted))
// ChoCh 2 Đầu Trường hợp chữ N ngược, chữ N
if(show2ChoCh and ((array.get(arrayYSGann,1) > array.get(arrayYSGann,3) and array.get(arrayYSGann,3) > array.get(arrayYSGann,4) and array.get(arrayYSGann,4) > array.get(arrayYSGann,2) and array.get(arrayYSGann,2) > array.get(arrayYSGann,0)) or (array.get(arrayYSGann,0) > array.get(arrayYSGann,2) and array.get(arrayYSGann,2) > array.get(arrayYSGann,4) and array.get(arrayYSGann,4) > array.get(arrayYSGann,3) and array.get(arrayYSGann,3) > array.get(arrayYSGann,1))))
line.set_width(array.get(arrayLineSGann,1),widthGann + 1)
line.set_style(array.get(arrayLineSGann,1),line.style_dashed)
line.set_color(array.get(arrayLineSGann,1),color2Choch)
// drawLineSGann kiểm tra điểm 0 => 3:Tiếp tục có sóng hồi // 2|9(reDraw):Tiếp tục không có sóng hồi // 4:Đảo chiều
if(array.get(arrayXSGann,0) >= array.get(arrayXGann,1) and array.get(arrayYSGann,0) != array.get(arrayYGann,0) and ((array.get(arrayYGann,0) > array.get(arrayYGann,1) and array.get(arrayYSGann,0) > array.get(arrayYSGann,1)) or (array.get(arrayYGann,0) < array.get(arrayYGann,1) and array.get(arrayYSGann,0) < array.get(arrayYSGann,1))))
drawLineSGann := 2
array.set(arrayXSGann, 0, array.get(arrayXGann,0))
array.set(arrayYSGann, 0, array.get(arrayYGann,0))
else if(array.get(arrayXSGann,0) <= array.get(arrayXGann,1))
if((array.get(arrayYSGann,0) > array.get(arrayYSGann,1) and array.get(arrayYGann,0) < array.get(arrayYSGann,1)) or (array.get(arrayYSGann,0) < array.get(arrayYSGann,1) and array.get(arrayYGann,0) > array.get(arrayYSGann,1)))
drawLineSGann := 4
runCheckChoChSGann := true
array.unshift(arrayXSGann,array.get(arrayXGann,0))
array.unshift(arrayYSGann,array.get(arrayYGann,0))
else if((array.get(arrayYSGann,0) > array.get(arrayYSGann,1) and array.get(arrayYGann,0) > array.get(arrayYSGann,0)) or (array.get(arrayYSGann,0) < array.get(arrayYSGann,1) and array.get(arrayYGann,0) < array.get(arrayYSGann,0)))
drawLineSGann := 3
_max = math.min(array.get(arrayYSGann,0),array.get(arrayYSGann,1))
_min = math.max(array.get(arrayYSGann,0),array.get(arrayYSGann,1))
_max_idx = 0
_min_idx = 0
for i = 1 to array.size(arrayXGann)
if(array.get(arrayXSGann,0) >= array.get(arrayXGann,i))
break
if(_min > array.get(arrayYGann,i))
_min := array.get(arrayYGann,i)
_min_idx := array.get(arrayXGann,i)
if(_max < array.get(arrayYGann,i))
_max := array.get(arrayYGann,i)
_max_idx := array.get(arrayXGann,i)
if(array.get(arrayYSGann,0) > array.get(arrayYSGann,1))
array.unshift(arrayXSGann,_min_idx)
array.unshift(arrayYSGann,_min)
else if(array.get(arrayYSGann,0) < array.get(arrayYSGann,1))
array.unshift(arrayXSGann,_max_idx)
array.unshift(arrayYSGann,_max)
array.unshift(arrayXSGann,array.get(arrayXGann,0))
array.unshift(arrayYSGann,array.get(arrayYGann,0))
if(timeframe.in_seconds() < secondCustomTF)
if(array.get(arrayYSGann,0) == array.get(arrayYGann,0) and array.get(arrayXSGann,0) != array.get(arrayXGann,0))
array.set(arrayXSGann, 0, array.get(arrayXGann,0))
drawLineSGann := 9
if(timeframe.in_seconds() <= secondCustomTF)
if(drawLineSGann == 2 or drawLineSGann == 9)
if(array.size(arrayLineSGann) >0)
line.set_xy2(array.get(arrayLineSGann,0),array.get(arrayXSGann,0),array.get(arrayYSGann,0))
else
array.unshift(arrayLineSGann,line.new(array.get(arrayXSGann,1),array.get(arrayYSGann,1),array.get(arrayXSGann,0),array.get(arrayYSGann,0), color = colorSGann,xloc = xloc.bar_time,width = widthGann,style=lineStyleSGann))
else if(drawLineSGann == 4)
array.unshift(arrayLineSGann,line.new(array.get(arrayXSGann,1),array.get(arrayYSGann,1),array.get(arrayXSGann,0),array.get(arrayYSGann,0), color = colorSGann,xloc = xloc.bar_time,width = widthGann,style=lineStyleSGann))
else if(drawLineSGann == 3)
array.unshift(arrayLineSGann,line.new(array.get(arrayXSGann,2),array.get(arrayYSGann,2),array.get(arrayXSGann,1),array.get(arrayYSGann,1), color = colorSGann,xloc = xloc.bar_time,width = widthGann,style=lineStyleSGann))
array.unshift(arrayLineSGann,line.new(array.get(arrayXSGann,1),array.get(arrayYSGann,1),array.get(arrayXSGann,0),array.get(arrayYSGann,0), color = colorSGann,xloc = xloc.bar_time,width = widthGann,style=lineStyleSGann))
if(runCheckChoChSGann)
runCheckChoChSGann := false
// ChoCh Trường hợp chữ N ngược, chữ N
if((array.get(arrayYSGann,3) > array.get(arrayYSGann,2) and array.get(arrayYSGann,3) < array.get(arrayYSGann,1) and array.get(arrayYSGann,0) < array.get(arrayYSGann,2)) or (array.get(arrayYSGann,3) < array.get(arrayYSGann,2) and array.get(arrayYSGann,3) > array.get(arrayYSGann,1) and array.get(arrayYSGann,0) > array.get(arrayYSGann,2)))
alert(syminfo.ticker + " : " + timeframe.period + " => Swing of Gann ChoCh" + (array.get(arrayYSGann,0) > array.get(arrayYSGann,1) ? "+ ⇑" : "- ⇓"))
if(showChoCh)
array.unshift(arrayLineChoCh,line.new(x1= array.get(arrayXSGann,2) , y1=array.get(arrayYSGann,2),x2=array.get(arrayXSGann,0), y2=array.get(arrayYSGann,2),color = colorSGann,xloc = xloc.bar_time,style = line.style_dotted))
// ChoCh 2 Đầu Trường hợp chữ N ngược, chữ N
if(show2ChoCh and ((array.get(arrayYSGann,1) > array.get(arrayYSGann,3) and array.get(arrayYSGann,3) > array.get(arrayYSGann,4) and array.get(arrayYSGann,4) > array.get(arrayYSGann,2) and array.get(arrayYSGann,2) > array.get(arrayYSGann,0)) or (array.get(arrayYSGann,0) > array.get(arrayYSGann,2) and array.get(arrayYSGann,2) > array.get(arrayYSGann,4) and array.get(arrayYSGann,4) > array.get(arrayYSGann,3) and array.get(arrayYSGann,3) > array.get(arrayYSGann,1))))
line.set_width(array.get(arrayLineSGann,1),widthGann+1)
line.set_style(array.get(arrayLineSGann,1),line.style_dashed)
line.set_color(array.get(arrayLineSGann,1),color2Choch)
///////////////////////Other//////////////////////////////////
if(timeframe.in_seconds() <= secondCustomTF)
if(showSGann)
if(showLabel and (barstate.islast or barstate.islastconfirmedhistory))
texLabel = timeframe.in_seconds() == secondCustomTF ? f_resFromMinutes(timeframe.in_seconds()/60) : f_resFromMinutes(secondCustomTF/60)
label.set_xy(labelTF,array.get(arrayXSGann,0),array.get(arrayYSGann,0))
label.set_text(labelTF,texLabel)
label.set_style(labelTF,array.get(arrayYSGann,0) < array.get(arrayYSGann,1) ? label.style_label_upper_right : label.style_label_lower_right)
else if(showGann)
if(showLabel and (barstate.islast or barstate.islastconfirmedhistory))
texLabel = timeframe.in_seconds() == secondCustomTF ? f_resFromMinutes(timeframe.in_seconds()/60) : f_resFromMinutes(secondCustomTF/60)
label.set_xy(labelTF,array.get(arrayXGann,0),array.get(arrayYGann,0))
label.set_text(labelTF,texLabel)
label.set_style(labelTF,array.get(arrayYGann,0) < array.get(arrayYGann,1) ? label.style_label_upper_right : label.style_label_lower_right)
if(showSGann and showGann and array.size(arrayLineGann) > 9 and array.size(arrayLineSGann) > 9 and drawLineGann != 2 and drawLineSGann != 2 and drawLineSGann != 9 and drawLineSGann != 12 and drawLineSGann != 19)
for i = 1 to 9
if(line.get_x1(array.get(arrayLineGann,i)) == line.get_x1(array.get(arrayLineSGann,0)) and line.get_y1(array.get(arrayLineGann,i)) == line.get_y1(array.get(arrayLineSGann,0)) and line.get_x2(array.get(arrayLineGann,i)) == line.get_x2(array.get(arrayLineSGann,0)) and line.get_y2(array.get(arrayLineGann,i)) == line.get_y2(array.get(arrayLineSGann,0)))
line.delete(array.get(arrayLineGann,i))
array.remove(arrayLineGann,i)
break
else if(line.get_x1(array.get(arrayLineGann,i)) == line.get_x1(array.get(arrayLineSGann,1)) and line.get_y1(array.get(arrayLineGann,i)) == line.get_y1(array.get(arrayLineSGann,1)) and line.get_x2(array.get(arrayLineGann,i)) == line.get_x2(array.get(arrayLineSGann,1)) and line.get_y2(array.get(arrayLineGann,i)) == line.get_y2(array.get(arrayLineSGann,1)))
line.delete(array.get(arrayLineGann,i))
array.remove(arrayLineGann,i)
break
else if(line.get_x1(array.get(arrayLineGann,i)) == line.get_x1(array.get(arrayLineSGann,2)) and line.get_y1(array.get(arrayLineGann,i)) == line.get_y1(array.get(arrayLineSGann,2)) and line.get_x2(array.get(arrayLineGann,i)) == line.get_x2(array.get(arrayLineSGann,2)) and line.get_y2(array.get(arrayLineGann,i)) == line.get_y2(array.get(arrayLineSGann,2)))
line.delete(array.get(arrayLineGann,i))
array.remove(arrayLineGann,i)
break
//EMA
// EMA 2
EMA1len = input.int(21, minval=1, title="EMA1>Length")
EMA1src = input(close, title="EMA1>Source")
EMA1offset = input.int(title="EMA1>Offset", defval=0, minval=-500, maxval=500)
EMA1out = ta.ema(EMA1src, EMA1len)
plot(EMA1out, title="EMA1", color=color.black, offset=EMA1offset)
// EMA 3
EMA2len = input.int(50, minval=1, title="EMA2>Length")
EMA2src = input(close, title="EMA2>Source")
EMA2offset = input.int(title="EMA2>Offset", defval=0, minval=-500, maxval=500)
EMA2out = ta.ema(EMA2src, EMA2len)
plot(EMA2out, title="EMA2", color=color.blue, offset=EMA2offset)
// EMA 4
EMA3len = input.int(200, minval=1, title="EMA3>Length")
EMA3src = input(close, title="EMA3>Source")
EMA3offset = input.int(title="EMA3>Offset", defval=0, minval=-500, maxval=500)
EMA3out = ta.ema(EMA3src, EMA3len)
plot(EMA3out, title="EMA3", color=color.red, offset=EMA3offset)
// ICT Killzones & Pivots
// ---------------------------------------- Inputs --------------------------------------------------
var g_SETTINGS = "Settings"
max_days = input.int(3, "Session Drawing Limit", 1, tooltip = "Only this many drawings will be kept on the chart, for each selected drawing type (killzone boxes, pivot lines, open lines, etc.)", group = g_SETTINGS)
tf_limit = input.timeframe("30", "Timeframe Limit", tooltip = "Drawings will not appear on timeframes greater than or equal to this", group = g_SETTINGS)
gmt_tz = input.string('GMT-4', "Timezone", options = , tooltip = "Note GMT is not adjusted to reflect Daylight Saving Time changes", group = g_SETTINGS)
lb_size = input.string('Normal', "Label Size", options = , group = g_SETTINGS)
lb_color = input.color(color.black, "Label Text Color", group = g_SETTINGS)
use_cutoff = input.bool(true, "Drawing Cutoff Time", inline = "CO", tooltip = "When enabled, all highs and lows will stop extending after this time", group = g_SETTINGS)
cutoff = input.session("1200-1201", "", inline = "CO", group = g_SETTINGS)
var g_KZ = "Killzones"
show_kz = input.bool(true, "Show Killzone Boxes", inline = "KZ", group = g_KZ)
show_kz_text = input.bool(true, "Display Text", inline = "KZ", group = g_KZ)
box_transparency = input.int(70, "Box Transparency", 0, 100, group = g_KZ)
text_transparency = input.int(50, "Text Transparency", 0, 100, group = g_KZ)
use_asia = input.bool(true, "", inline = "ASIA", group = g_KZ)
asia_text = input.string("Asia", "", inline = "ASIA", group = g_KZ)
asia = input.session("2000-0000", "", inline = "ASIA", group = g_KZ)
as_color = input.color(color.blue, "", inline = "ASIA", group = g_KZ)
use_london = input.bool(true, "", inline = "LONDON", group = g_KZ)
london_text = input.string("London", "", inline = "LONDON", group = g_KZ)
london = input.session("0200-0500", "", inline = "LONDON", group = g_KZ)
lo_color = input.color(color.red, "", inline = "LONDON", group = g_KZ)
use_nyam = input.bool(true, "", inline = "NYAM", group = g_KZ)
nyam_text = input.string("NY AM", "", inline = "NYAM", group = g_KZ)
nyam = input.session("0930-1100", "", inline = "NYAM", group = g_KZ)
na_color = input.color(#089981, "", inline = "NYAM", group = g_KZ)
use_nylu = input.bool(true, "", inline = "NYLU", group = g_KZ)
nylu_text = input.string("NY Lunch", "", inline = "NYLU", group = g_KZ)
nylu = input.session("1200-1300", "", inline = "NYLU", group = g_KZ)
nl_color = input.color(color.yellow, "", inline = "NYLU", group = g_KZ)
use_nypm = input.bool(true, "", inline = "NYPM", group = g_KZ)
nypm_text = input.string("NY PM", "", inline = "NYPM", group = g_KZ)
nypm = input.session("1330-1600", "", inline = "NYPM", group = g_KZ)
np_color = input.color(color.purple, "", inline = "NYPM", group = g_KZ)
var g_LABELS = "Killzone Pivots"
show_pivots = input.bool(true, "Show Pivots", inline = "PV", group = g_LABELS)
show_labels = input.bool(true, "Show Labels", inline = "PV", group = g_LABELS)
ash_str = input.string("AS.H", "Session 1 Labels", inline = "L_AS", group = g_LABELS)
asl_str = input.string("AS.L", "", inline = "L_AS", group = g_LABELS)
as_alert = input.bool(false, "Alerts", inline = "L_AS", group = g_LABELS)
loh_str = input.string("LO.H", "Session 2 Labels", inline = "L_LO", group = g_LABELS)
lol_str = input.string("LO.L", "", inline = "L_LO", group = g_LABELS)
lo_alert = input.bool(false, "Alerts", inline = "L_LO", group = g_LABELS)
nah_str = input.string("NYAM.H", "Session 3 Labels", inline = "L_NA", group = g_LABELS)
nal_str = input.string("NYAM.L", "", inline = "L_NA", group = g_LABELS)
na_alert = input.bool(false, "Alerts", inline = "L_NA", group = g_LABELS)
nlh_str = input.string("NYL.H", "Session 4 Labels", inline = "L_NL", group = g_LABELS)
nll_str = input.string("NYL.L", "", inline = "L_NL", group = g_LABELS)
nl_alert = input.bool(false, "Alerts", inline = "L_NL", group = g_LABELS)
nph_str = input.string("NYPM.H", "Session 5 Labels", inline = "L_NP", group = g_LABELS)
npl_str = input.string("NYPM.L", "", inline = "L_NP", group = g_LABELS)
np_alert = input.bool(false, "Alerts", inline = "L_NP", group = g_LABELS)
s_style = input.string(defval = 'Solid', title = "Style", options = , inline = "L_0", group = g_LABELS)
s_width = input.int(1, "", inline = "L_0", group = g_LABELS)
var g_DWM = "DWM Open"
dow_labels = input.bool(true, "Day of Week Labels", inline = "DOW", group = g_DWM)
dow_yloc = input.string('Bottom', "", options = , inline = "DOW", group = g_DWM)
dow_xloc = input.string('Midnight', "", options = , inline = "DOW", group = g_DWM)
dow_color = input.color(color.black, "", inline = "DOW", group = g_DWM)
show_d_open = input.bool(false, "", inline = "DO", group = g_DWM)
d_open_str = input.string("D.OPEN", "", inline = "DO", group = g_DWM)
ds = input.bool(false, "Separators", inline = "DO", tooltip = "Mark where a new day begins. Unlimited will override the drawing limit", group = g_DWM)
ds_unlimited = input.bool(true, "Unlimited", inline = "DO", group = g_DWM)
d_color = input.color(color.blue, "", inline = "DO", group = g_DWM)
show_w_open = input.bool(false, "", inline = "WO", group = g_DWM)
w_open_str = input.string("W.OPEN", "", inline = "WO", group = g_DWM)
ws = input.bool(false, "Separators", inline = "WO", tooltip = "Mark where a new week begins. Unlimited will override the drawing limit", group = g_DWM)
ws_unlimited = input.bool(true, "Unlimited", inline = "WO", group = g_DWM)
w_color = input.color(#089981, "", inline = "WO", group = g_DWM)
show_m_open = input.bool(false, "", inline = "MO", group = g_DWM)
m_open_str = input.string("M.OPEN", "", inline = "MO", group = g_DWM)
ms = input.bool(false, "Separators", inline = "MO", tooltip = "Mark where a new month begins. Unlimited will override the drawing limit", group = g_DWM)
ms_unlimited = input.bool(true, "Unlimited", inline = "MO", group = g_DWM)
m_color = input.color(color.red, "", inline = "MO", group = g_DWM)
dwm_style = input.string(defval = 'Solid', title = "Style", options = , inline = "D0", group = g_DWM)
dwm_width = input.int(1, "", inline = "D0", group = g_DWM)
var g_OPEN = "Opening Price"
use_h1 = input.bool(true, "", inline = "H1", group = g_OPEN)
h1_text = input.string("True Day Open", "", inline = "H1", group = g_OPEN)
h1 = input.session("0000-0001", "", inline = "H1", group = g_OPEN)
h1_color = input.color(color.black, "", inline = "H1", group = g_OPEN)
use_h2 = input.bool(false, "", inline = "H2", group = g_OPEN)
h2_text = input.string("06:00", "", inline = "H2", group = g_OPEN)
h2 = input.session("0600-0601", "", inline = "H2", group = g_OPEN)
h2_color = input.color(color.black, "", inline = "H2", group = g_OPEN)
use_h3 = input.bool(false, "", inline = "H3", group = g_OPEN)
h3_text = input.string("10:00", "", inline = "H3", group = g_OPEN)
h3 = input.session("1000-1001", "", inline = "H3", group = g_OPEN)
h3_color = input.color(color.black, "", inline = "H3", group = g_OPEN)
use_h4 = input.bool(false, "", inline = "H4", group = g_OPEN)
h4_text = input.string("14:00", "", inline = "H4", group = g_OPEN)
h4 = input.session("1400-1401", "", inline = "H4", group = g_OPEN)
h4_color = input.color(color.black, "", inline = "H4", group = g_OPEN)
h_style = input.string(defval = 'Dotted', title = "Style", options = , inline = "H0", group = g_OPEN)
h_width = input.int(1, "", inline = "H0", group = g_OPEN)
var g_VERTICAL = "Timestamps"
use_v1 = input.bool(false, "", inline = "V1", group = g_VERTICAL)
v1 = input.session("0000-0001", "", inline = "V1", group = g_VERTICAL)
v1_color = input.color(color.black, "", inline = "V1", group = g_VERTICAL)
use_v2 = input.bool(false, "", inline = "V2", group = g_VERTICAL)
v2 = input.session("0800-0801", "", inline = "V2", group = g_VERTICAL)
v2_color = input.color(color.black, "", inline = "V2", group = g_VERTICAL)
use_v3 = input.bool(false, "", inline = "V3", group = g_VERTICAL)
v3 = input.session("1000-1001", "", inline = "V3", group = g_VERTICAL)
v3_color = input.color(color.black, "", inline = "V3", group = g_VERTICAL)
use_v4 = input.bool(true, "", inline = "V4", group = g_VERTICAL)
v4 = input.session("1200-1201", "", inline = "V4", group = g_VERTICAL)
v4_color = input.color(color.black, "", inline = "V4", group = g_VERTICAL)
v_style = input.string(defval = 'Dotted', title = "Style", options = , inline = "V0", group = g_VERTICAL)
v_width = input.int(1, "", inline = "V0", group = g_VERTICAL)
// ---------------------------------------- Inputs --------------------------------------------------
// ---------------------------------------- Variables & Constants --------------------------------------------------
t_as = not na(time("", asia, gmt_tz))
t_lo = not na(time("", london, gmt_tz))
t_na = not na(time("", nyam, gmt_tz))
t_nl = not na(time("", nylu, gmt_tz))
t_np = not na(time("", nypm, gmt_tz))
t_co = not na(time("", cutoff, gmt_tz))
t_h1 = not na(time("", h1, gmt_tz))
t_h2 = not na(time("", h2, gmt_tz))
t_h3 = not na(time("", h3, gmt_tz))
t_h4 = not na(time("", h4, gmt_tz))
t_v1 = not na(time("", v1, gmt_tz))
t_v2 = not na(time("", v2, gmt_tz))
t_v3 = not na(time("", v3, gmt_tz))
t_v4 = not na(time("", v4, gmt_tz))
var as_hi_line = array.new_line()
var as_lo_line = array.new_line()
var lo_hi_line = array.new_line()
var lo_lo_line = array.new_line()
var na_hi_line = array.new_line()
var na_lo_line = array.new_line()
var nl_hi_line = array.new_line()
var nl_lo_line = array.new_line()
var np_hi_line = array.new_line()
var np_lo_line = array.new_line()
var d_sep_line = array.new_line()
var w_sep_line = array.new_line()
var m_sep_line = array.new_line()
var d_line = array.new_line()
var w_line = array.new_line()
var m_line = array.new_line()
var h1_line = array.new_line()
var h2_line = array.new_line()
var h3_line = array.new_line()
var h4_line = array.new_line()
var v1_line = array.new_line()
var v2_line = array.new_line()
var v3_line = array.new_line()
var v4_line = array.new_line()
var d_label = array.new_label()
var w_label = array.new_label()
var m_label = array.new_label()
var h1_label = array.new_label()
var h2_label = array.new_label()
var h3_label = array.new_label()
var h4_label = array.new_label()
var as_hi_label = array.new_label()
var as_lo_label = array.new_label()
var lo_hi_label = array.new_label()
var lo_lo_label = array.new_label()
var na_hi_label = array.new_label()
var na_lo_label = array.new_label()
var nl_hi_label = array.new_label()
var nl_lo_label = array.new_label()
var np_hi_label = array.new_label()
var np_lo_label = array.new_label()
var as_box = array.new_box()
var lo_box = array.new_box()
var na_box = array.new_box()
var nl_box = array.new_box()
var np_box = array.new_box()
transparent = #ffffff00
d_o = request.security(syminfo.tickerid, "D", open, barmerge.gaps_off, barmerge.lookahead_on)
w_o = request.security(syminfo.tickerid, "W", open, barmerge.gaps_off, barmerge.lookahead_on)
m_o = request.security(syminfo.tickerid, "M", open, barmerge.gaps_off, barmerge.lookahead_on)
// ---------------------------------------- Variables & Constants --------------------------------------------------
// ---------------------------------------- Functions --------------------------------------------------
get_label_size(_size) =>
result = switch _size
'Tiny' => size.tiny
'Small' => size.small
'Normal' => size.normal
'Large' => size.large
'Huge' => size.huge
'Auto' => size.auto
result
get_line_type(_style) =>
result = switch _style
'Solid' => line.style_solid
'Dotted' => line.style_dotted
'Dashed' => line.style_dashed
result
get_box_color(_color, _transparency) =>
result = color.new(_color, _transparency)
adjust(_hline, _lline, _hlabel, _llabel, _ulabel, _box) =>
_hline.set_x2(bar_index)
_lline.set_x2(bar_index)
_box.set_right(bar_index)
_top = show_kz ? _box.get_top() : _hline.get_y1()
_bot = show_kz ? _box.get_bottom() : _lline.get_y1()
if high > _top
_hline.set_xy1(bar_index, high)
_hline.set_y2(high)
_box.set_top(high)
_hlabel.set_x(bar_index)
_hlabel.set_y(high)
if low < _bot
_lline.set_xy1(bar_index, low)
_lline.set_y2(low)
_box.set_bottom(low)
_llabel.set_x(bar_index)
_llabel.set_y(low)
check_high(_line) =>
result = false
broke = false
_line.set_x2(bar_index)
if high > _line.get_y1()
result := true
broke := true
else if (use_cutoff ? t_co : false)
result := true
check_low(_line) =>
result = false
broke = false
_line.set_x2(bar_index)
if low < _line.get_y1()
result := true
broke := true
else if (use_cutoff ? t_co : false)
result := true
check_open(_line, _label) =>
result = false
_line.set_x2(bar_index)
_label.set_x(bar_index)
if (use_cutoff ? t_co : false)
result := true
result
check_array(_arr) =>
if _arr.size() > max_days
_arr.pop().delete()
// ---------------------------------------- Functions --------------------------------------------------
// ---------------------------------------- Core Logic --------------------------------------------------
s_style := get_line_type(s_style)
dwm_style := get_line_type(dwm_style)
h_style := get_line_type(h_style)
v_style := get_line_type(v_style)
lb_size := get_label_size(lb_size)
var color as_box_color = get_box_color(as_color, box_transparency)
var color lo_box_color = get_box_color(lo_color, box_transparency)
var color na_box_color = get_box_color(na_color, box_transparency)
var color nl_box_color = get_box_color(nl_color, box_transparency)
var color np_box_color = get_box_color(np_color, box_transparency)
var color as_text_color = get_box_color(as_color, text_transparency)
var color lo_text_color = get_box_color(lo_color, text_transparency)
var color na_text_color = get_box_color(na_color, text_transparency)
var color nl_text_color = get_box_color(nl_color, text_transparency)
var color np_text_color = get_box_color(np_color, text_transparency)
var h1_co = false
var h2_co = false
var h3_co = false
var h4_co = false
var as_stop_hi = false
var as_stop_lo = false
var lo_stop_hi = false
var lo_stop_lo = false
var na_stop_hi = false
var na_stop_lo = false
var nl_stop_hi = false
var nl_stop_lo = false
var np_stop_hi = false
var np_stop_lo = false
as_broke_hi = false
as_broke_lo = false
lo_broke_hi = false
lo_broke_lo = false
na_broke_hi = false
na_broke_lo = false
nl_broke_hi = false
nl_broke_lo = false
np_broke_hi = false
np_broke_lo = false
// day_str = switch dayofweek
// if dayofweek != dayofweek
// label.new(time, high, str.tostring(dayofweek))
if timeframe.in_seconds("") <= timeframe.in_seconds(tf_limit)
// Asia
if use_asia
if t_as and not t_as
as_stop_hi := false
as_stop_lo := false
if show_kz
as_box.unshift(box.new(bar_index, high, bar_index, low, border_color = as_box_color, bgcolor = as_box_color, text = show_kz_text ? asia_text : na, text_color = as_text_color))
if show_pivots
as_hi_line.unshift(line.new(bar_index, high, bar_index, high, style = s_style, color = as_color, width = s_width))
as_lo_line.unshift(line.new(bar_index, low, bar_index, low, style = s_style, color = as_color, width = s_width))
if show_labels
as_hi_label.unshift(label.new(bar_index, high, ash_str, color = transparent, textcolor = lb_color, style = label.style_label_down, size = lb_size))
as_lo_label.unshift(label.new(bar_index, low, asl_str, color = transparent, textcolor = lb_color, style = label.style_label_up, size = lb_size))
else if t_as
adjust(show_pivots ? as_hi_line.get(0) : na, show_pivots ? as_lo_line.get(0) : na, show_labels ? as_hi_label.get(0) : na, show_labels ? as_lo_label.get(0) : na, show_labels, show_kz ? as_box.get(0) : na)
else if not t_as and as_hi_line.size() > 0
if not as_stop_hi
= check_high(as_hi_line.get(0))
if _r
as_stop_hi := true
if _b
as_broke_hi := true
if as_alert
alert("Broke " + str.tostring(ash_str), alert.freq_once_per_bar)
if not as_stop_lo
= check_low(as_lo_line.get(0))
if _r
as_stop_lo := true
if _b
as_broke_lo := true
if as_alert
alert("Broke " + str.tostring(asl_str), alert.freq_once_per_bar)
// London
if use_london
if t_lo and not t_lo
lo_stop_hi := false
lo_stop_lo := false
if show_kz
lo_box.unshift(box.new(bar_index, high, bar_index, low, border_color = lo_box_color, bgcolor = lo_box_color, text = show_kz_text ? london_text : na, text_color = lo_text_color))
if show_pivots
lo_hi_line.unshift(line.new(bar_index, high, bar_index, high, style = s_style, color = lo_color, width = s_width))
lo_lo_line.unshift(line.new(bar_index, low, bar_index, low, style = s_style, color = lo_color, width = s_width))
if show_labels
lo_hi_label.unshift(label.new(bar_index, high, loh_str, color = transparent, textcolor = lb_color, style = label.style_label_down, size = lb_size))
lo_lo_label.unshift(label.new(bar_index, low, lol_str, color = transparent, textcolor = lb_color, style = label.style_label_up, size = lb_size))
else if t_lo
adjust(show_pivots ? lo_hi_line.get(0) : na, show_pivots ? lo_lo_line.get(0) : na, show_labels ? lo_hi_label.get(0) : na, show_labels ? lo_lo_label.get(0) : na, show_labels, show_kz ? lo_box.get(0) : na)
else if not t_lo and lo_hi_line.size() > 0
if not lo_stop_hi
= check_high(lo_hi_line.get(0))
if _r
lo_stop_hi := true
if _b
lo_broke_hi := true
if lo_alert
alert("Broke " + str.tostring(loh_str), alert.freq_once_per_bar)
if not lo_stop_lo
= check_low(lo_lo_line.get(0))
if _r
lo_stop_lo := true
if _b
lo_broke_lo := true
if lo_alert
alert("Broke " + str.tostring(lol_str), alert.freq_once_per_bar)
// NY AM
if use_nyam
if t_na and not t_na
na_stop_hi := false
na_stop_lo := false
if show_kz
na_box.unshift(box.new(bar_index, high, bar_index, low, border_color = na_box_color, bgcolor = na_box_color, text = show_kz_text ? nyam_text : na, text_color = na_text_color))
if show_pivots
na_hi_line.unshift(line.new(bar_index, high, bar_index, high, style = s_style, color = na_color, width = s_width))
na_lo_line.unshift(line.new(bar_index, low, bar_index, low, style = s_style, color = na_color, width = s_width))
if show_labels
na_hi_label.unshift(label.new(bar_index, high, nah_str, color = transparent, textcolor = lb_color, style = label.style_label_down, size = lb_size))
na_lo_label.unshift(label.new(bar_index, low, nal_str, color = transparent, textcolor = lb_color, style = label.style_label_up, size = lb_size))
else if t_na
adjust(show_pivots ? na_hi_line.get(0) : na, show_pivots ? na_lo_line.get(0) : na, show_labels ? na_hi_label.get(0) : na, show_labels ? na_lo_label.get(0) : na, show_labels, show_kz ? na_box.get(0) : na)
else if not t_na and na_hi_line.size() > 0
if not na_stop_hi
= check_high(na_hi_line.get(0))
if _r
na_stop_hi := true
if _b
na_broke_hi := true
if na_alert
alert("Broke " + str.tostring(nah_str), alert.freq_once_per_bar)
if not na_stop_lo
= check_low(na_lo_line.get(0))
if _r
na_stop_lo := true
if _b
na_broke_lo := true
if na_alert
alert("Broke " + str.tostring(nal_str), alert.freq_once_per_bar)
// NY Lunch
if use_nylu
if t_nl and not t_nl
nl_stop_hi := false
nl_stop_lo := false
if show_kz
nl_box.unshift(box.new(bar_index, high, bar_index, low, border_color = nl_box_color, bgcolor = nl_box_color, text = show_kz_text ? nylu_text : na, text_color = nl_text_color))
if show_pivots
nl_hi_line.unshift(line.new(bar_index, high, bar_index, high, style = s_style, color = nl_color, width = s_width))
nl_lo_line.unshift(line.new(bar_index, low, bar_index, low, style = s_style, color = nl_color, width = s_width))
if show_labels
nl_hi_label.unshift(label.new(bar_index, high, nlh_str, color = transparent, textcolor = lb_color, style = label.style_label_down, size = lb_size))
nl_lo_label.unshift(label.new(bar_index, low, nll_str, color = transparent, textcolor = lb_color, style = label.style_label_up, size = lb_size))
else if t_nl
adjust(show_pivots ? nl_hi_line.get(0) : na, show_pivots ? nl_lo_line.get(0) : na, show_labels ? nl_hi_label.get(0) : na, show_labels ? nl_lo_label.get(0) : na, show_labels, show_kz ? nl_box.get(0) : na)
else if not t_nl and nl_hi_line.size() > 0
if not nl_stop_hi
= check_high(nl_hi_line.get(0))
if _r
nl_stop_hi := true
if _b
nl_broke_hi := true
if nl_alert
alert("Broke " + str.tostring(nlh_str), alert.freq_once_per_bar)
if not nl_stop_lo
= check_low(nl_lo_line.get(0))
if _r
nl_stop_lo := true
if _b
nl_broke_lo := true
if nl_alert
alert("Broke " + str.tostring(nll_str), alert.freq_once_per_bar)
// NY PM
if use_nypm
if t_np and not t_np
np_stop_hi := false
np_stop_lo := false
if show_kz
np_box.unshift(box.new(bar_index, high, bar_index, low, border_color = np_box_color, bgcolor = np_box_color, text = show_kz_text ? nypm_text : na, text_color = np_text_color))
if show_pivots
np_hi_line.unshift(line.new(bar_index, high, bar_index, high, style = s_style, color = np_color, width = s_width))
np_lo_line.unshift(line.new(bar_index, low, bar_index, low, style = s_style, color = np_color, width = s_width))
if show_labels
np_hi_label.unshift(label.new(bar_index, high, nph_str, color = transparent, textcolor = lb_color, style = label.style_label_down, size = lb_size))
np_lo_label.unshift(label.new(bar_index, low, npl_str, color = transparent, textcolor = lb_color, style = label.style_label_up, size = lb_size))
else if t_np
adjust(show_pivots ? np_hi_line.get(0) : na, show_pivots ? np_lo_line.get(0) : na, show_labels ? np_hi_label.get(0) : na, show_labels ? np_lo_label.get(0) : na, show_labels, show_kz ? np_box.get(0) : na)
else if not t_np and np_hi_line.size() > 0
if not np_stop_hi
= check_high(np_hi_line.get(0))
if _r
np_stop_hi := true
if _b
np_broke_hi := true
if np_alert
alert("Broke " + str.tostring(nph_str), alert.freq_once_per_bar)
if not np_stop_lo
= check_low(np_lo_line.get(0))
if _r
np_stop_lo := true
if _b
np_broke_lo := true
if np_alert
alert("Broke " + str.tostring(npl_str), alert.freq_once_per_bar)
// Vertical Lines
if use_v1
if t_v1 and not t_v1
v1_line.unshift(line.new(bar_index, high, bar_index, low, style = v_style, width = v_width, extend = extend.both, color = v1_color))
if use_v2
if t_v2 and not t_v2
v2_line.unshift(line.new(bar_index, high, bar_index, low, style = v_style, width = v_width, extend = extend.both, color = v2_color))
if use_v3
if t_v3 and not t_v3
v3_line.unshift(line.new(bar_index, high, bar_index, low, style = v_style, width = v_width, extend = extend.both, color = v3_color))
if use_v4
if t_v4 and not t_v4
v4_line.unshift(line.new(bar_index, high, bar_index, low, style = v_style, width = v_width, extend = extend.both, color = v4_color))
// Horizontal Lines
if use_h1
if t_h1 and not t_h1
h1_co := false
h1_line.unshift(line.new(bar_index, open, bar_index, open, style = h_style, width = h_width, color = h1_color))
h1_label.unshift(label.new(bar_index, open, h1_text, style = label.style_label_left, color = transparent, textcolor = lb_color, size = lb_size))
else if not t_h1 and h1_line.size() > 0
if not h1_co
if not check_open(h1_line.get(0), h1_label.get(0))
h1_label.get(0).set_x(bar_index)
else
h1_co := true
if use_h2
if t_h2 and not t_h2
h2_co := false
h2_line.unshift(line.new(bar_index, open, bar_index, open, style = h_style, width = h_width, color = h2_color))
h2_label.unshift(label.new(bar_index, open, h2_text, style = label.style_label_left, color = transparent, textcolor = lb_color, size = lb_size))
else if not t_h2 and h2_line.size() > 0
if not h2_co
if not check_open(h2_line.get(0), h2_label.get(0))
h2_label.get(0).set_x(bar_index)
else
h2_co := true
if use_h3
if t_h3 and not t_h3
h3_co := false
h3_line.unshift(line.new(bar_index, open, bar_index, open, style = h_style, width = h_width, color = h3_color))
h3_label.unshift(label.new(bar_index, open, h3_text, style = label.style_label_left, color = transparent, textcolor = lb_color, size = lb_size))
else if not t_h3 and h3_line.size() > 0
if not h3_co
if not check_open(h3_line.get(0), h3_label.get(0))
h3_label.get(0).set_x(bar_index)
else
h3_co := true
if use_h4
if t_h4 and not t_h4
h4_co := false
h4_line.unshift(line.new(bar_index, open, bar_index, open, style = h_style, width = h_width, color = h4_color))
h4_label.unshift(label.new(bar_index, open, h4_text, style = label.style_label_left, color = transparent, textcolor = lb_color, size = lb_size))
else if not t_h4 and h4_line.size() > 0
if not h4_co
if not check_open(h4_line.get(0), h4_label.get(0))
h4_label.get(0).set_x(bar_index)
else
h4_co := true
// DWM - Separators
if ds
if d_o != d_o
d_sep_line.unshift(line.new(bar_index, high, bar_index, low, style = dwm_style, width = dwm_width, extend = extend.both, color = d_color))
if ws
if w_o != w_o
w_sep_line.unshift(line.new(bar_index, high, bar_index, low, style = dwm_style, width = dwm_width, extend = extend.both, color = w_color))
if ms
if m_o != m_o
m_sep_line.unshift(line.new(bar_index, high, bar_index, low, style = dwm_style, width = dwm_width, extend = extend.both, color = m_color))
// DWM - Open Lines
if show_d_open
if d_o != d_o
d_line.unshift(line.new(bar_index, d_o, bar_index, d_o, style = dwm_style, width = dwm_width, color = d_color))
d_label.unshift(label.new(bar_index, d_o, d_open_str, style = label.style_label_left, color = transparent, textcolor = lb_color, size = lb_size))
else if d_line.size() > 0
if not check_open(d_line.get(0), d_label.get(0))
d_label.get(0).set_x(bar_index)
if show_w_open
if w_o != w_o
w_line.unshift(line.new(bar_index, w_o, bar_index, w_o, style = dwm_style, width = dwm_width, color = w_color))
w_label.unshift(label.new(bar_index, w_o, w_open_str, style = label.style_label_left, color = transparent, textcolor = lb_color, size = lb_size))
else if w_line.size() > 0
if not check_open(w_line.get(0), w_label.get(0))
w_label.get(0).set_x(bar_index)
if show_m_open
if m_o != m_o
m_line.unshift(line.new(bar_index, m_o, bar_index, m_o, style = dwm_style, width = dwm_width, color = m_color))
m_label.unshift(label.new(bar_index, m_o, m_open_str, style = label.style_label_left, color = transparent, textcolor = lb_color, size = lb_size))
else if m_line.size() > 0
if not check_open(m_line.get(0), m_label.get(0))
m_label.get(0).set_x(bar_index)
new_dow_time = dow_xloc == 'Midday' ? time - timeframe.in_seconds("D") / 2 * 1000 : time
new_day = dayofweek(new_dow_time, gmt_tz) != dayofweek(new_dow_time, gmt_tz)
dow_top = dow_yloc == 'Top'
monday = "MONDAY"
tuesday = "TUESDAY"
wednesday = "WEDNESDAY"
thursday = "THURSDAY"
friday = "FRIDAY"
plotchar(dow_labels and timeframe.isintraday and dayofweek(new_dow_time, gmt_tz) == 2 and new_day, location = dow_top ? location.top : location.bottom, char = "", textcolor = dow_color, text = monday)
plotchar(dow_labels and timeframe.isintraday and dayofweek(new_dow_time, gmt_tz) == 3 and new_day, location = dow_top ? location.top : location.bottom, char = "", textcolor = dow_color, text = tuesday)
plotchar(dow_labels and timeframe.isintraday and dayofweek(new_dow_time, gmt_tz) == 4 and new_day, location = dow_top ? location.top : location.bottom, char = "", textcolor = dow_color, text = wednesday)
plotchar(dow_labels and timeframe.isintraday and dayofweek(new_dow_time, gmt_tz) == 5 and new_day, location = dow_top ? location.top : location.bottom, char = "", textcolor = dow_color, text = thursday)
plotchar(dow_labels and timeframe.isintraday and dayofweek(new_dow_time, gmt_tz) == 6 and new_day, location = dow_top ? location.top : location.bottom, char = "", textcolor = dow_color, text = friday)
check_array(as_hi_line)
check_array(as_lo_line)
check_array(as_hi_label)
check_array(as_lo_label)
check_array(as_box)
check_array(lo_hi_line)
check_array(lo_lo_line)
check_array(lo_hi_label)
check_array(lo_lo_label)
check_array(lo_box)
check_array(na_hi_line)
check_array(na_lo_line)
check_array(na_hi_label)
check_array(na_lo_label)
check_array(na_box)
check_array(nl_hi_line)
check_array(nl_lo_line)
check_array(nl_hi_label)
check_array(nl_lo_label)
check_array(nl_box)
check_array(np_hi_line)
check_array(np_lo_line)
check_array(np_hi_label)
check_array(np_lo_label)
check_array(np_box)
check_array(v1_line)
check_array(v2_line)
check_array(v3_line)
check_array(v4_line)
check_array(h1_line)
check_array(h2_line)
check_array(h3_line)
check_array(h4_line)
check_array(h1_label)
check_array(h2_label)
check_array(h3_label)
check_array(h4_label)
if not ds_unlimited
check_array(d_sep_line)
check_array(d_line)
check_array(d_label)
if not ws_unlimited
check_array(w_sep_line)
check_array(w_line)
check_array(w_label)
if not ms_unlimited
check_array(m_sep_line)
check_array(m_line)
check_array(m_label)
// ---------

Growth Makers indicator//@version=5
indicator(title='Growth Makers indicator', overlay=true)
src = input(defval=close, title='Source')
per = input.int(defval=100, minval=1, title='Sampling Period')
mult = input.float(defval=3.0, minval=0.1, title='Range Multiplier')
smoothrng(x, t, m) =>
wper = t * 2 - 1
avrng = ta.ema(math.abs(x - x ), t)
smoothrng = ta.ema(avrng, wper) * m
smoothrng
smrng = smoothrng(src, per, mult)
rngfilt(x, r) =>
rngfilt = x
rngfilt := x > nz(rngfilt ) ? x - r < nz(rngfilt ) ? nz(rngfilt ) : x - r : x + r > nz(rngfilt ) ? nz(rngfilt ) : x + r
rngfilt
filt = rngfilt(src, smrng)
upward = 0.0
upward := filt > filt ? nz(upward ) + 1 : filt < filt ? 0 : nz(upward )
downward = 0.0
downward := filt < filt ? nz(downward ) + 1 : filt > filt ? 0 : nz(downward )
hband = filt + smrng
lband = filt - smrng
filtcolor = upward > 0 ? color.lime : downward > 0 ? color.red : color.orange
barcolor = src > filt and src > src and upward > 0 ? color.lime : src > filt and src < src and upward > 0 ? color.green : src < filt and src < src and downward > 0 ? color.red : src < filt and src > src and downward > 0 ? color.maroon : color.orange
filtplot = plot(filt, color=filtcolor, linewidth=3, title='Range Filter')
hbandplot = plot(hband, color=color.new(color.aqua, 100), title='High Target')
lbandplot = plot(lband, color=color.new(color.fuchsia, 100), title='Low Target')
fill(hbandplot, filtplot, color=color.new(color.aqua, 90), title='High Target Range')
fill(lbandplot, filtplot, color=color.new(color.fuchsia, 90), title='Low Target Range')
barcolor(barcolor)
longCond = bool(na)
shortCond = bool(na)
longCond := src > filt and src > src and upward > 0 or src > filt and src < src and upward > 0
shortCond := src < filt and src < src and downward > 0 or src < filt and src > src and downward > 0
CondIni = 0
CondIni := longCond ? 1 : shortCond ? -1 : CondIni
longCondition = longCond and CondIni == -1
shortCondition = shortCond and CondIni == 1
plotshape(longCondition, title='Buy Signal', text='Buy', textcolor=color.new(color.white, 0), style=shape.labelup, size=size.normal, location=location.belowbar, color=color.new(color.green, 0))
plotshape(shortCondition, title='Sell Signal', text='Sell', textcolor=color.new(color.white, 0), style=shape.labeldown, size=size.normal, location=location.abovebar, color=color.new(color.red, 0))
alertcondition(longCondition, title='Buy Alert', message='BUY')
alertcondition(longCondition, title='Buy Alert', message='BUY')
alertcondition(longCondition, title='Buy Alert', message='BUY')
alertcondition(shortCondition, title='Sell Alert', message='SELL')

Rahhul Buy Sell IndicatorThis custom indicator is a powerful entry signal system that combines multiple technical strategies into one. It is designed to detect high-probability Buy and Sell opportunities by using a blend of momentum, mean reversion, trend analysis, and money flow strength.
✅ Key Features:
Signal Generation (Base Logic):
Uses CCI or Momentum cross to determine directional pressure.
Confirms signals with RSI overbought/oversold levels.
Optional RSI divergence detection for added confirmation.
Mean Reversion Filter (optional):
Filters signals based on price position relative to a 200-period EMA and standard deviation bands.
Options to detect "Range" entries (inside bands) or "Extreme" entries (outside bands).
Trend Filter (optional):
Uses a long-term EMA to ensure trades align with broader market trend.
Buy signals only appear in uptrends; Sell signals only in downtrends.
Money Flow Index (MFI) Confirmation:
Final confirmation layer based on volume-weighted price strength.
Buy signals are valid only when MFI ≤ 50 (indicating oversold/weak money flow).
Sell signals are valid only when MFI ≥ 50 (indicating overbought/strong outflow).
Clean Visuals:
"Buy" label in green when all buy conditions are met.
"Sell" label in red when all sell conditions are met.

Logios Traders Pro v1## 📈 Logios Traders Pro v1 – EMA Crossover + Signal Candle Extensions
**Logios Traders Pro v1** is a powerful and clean EMA crossover-based tool designed for traders who want precise entry zones, trend clarity, and support/resistance validation — all in one lightweight overlay.
### 🔍 Features:
* **Customizable Fast and Slow EMAs**
Set your preferred EMA lengths to generate Buy/Sell signals based on crossovers.
* **Signal Candle High/Low Extensions**
Each Buy/Sell signal marks the high and low of the signal candle and projects them forward as horizontal levels. These act as **dynamic support/resistance zones**, and extend until broken by price.
* **Trend EMA (e.g., EMA 50)**
An optional third EMA is displayed by default to help filter trades with the broader trend. Its length is also fully customizable.
* **Smart Visuals**
* Signal markers (`Buy` / `Sell`) with clean labels.
* Background coloring and EMA plots are optional and customizable.
* Alert-ready for both buy and sell conditions.
### ✅ Best Used For:
* Trend-following or reversal setups.
* Retest entries off signal candle zones.
* Entry confirmation aligned with trend direction (using the 50 EMA).
---
### ⚙️ Inputs:
* Fast EMA Length (default: 5)
* Slow EMA Length (default: 9)
* Trend EMA Length (default: 50)
---
Whether you're a scalper, intraday trader, or swing trader, **Logios Traders Pro v1** gives you high-precision insight into the market’s structure and key entry zones.
---

ICT Time CaptureICT 8am High/Low + 9am Capture (NY Time) — Fixed 1H
This indicator marks the High and Low of the 8am candle on the 1-hour timeframe fixed to New York time (America/New_York timezone). It also draws a line for the 9am candle open and indicates if the 9am candle “captured” (broke above or below) the 8am High or Low.
Key Features:
Always uses 1-hour data fixed on New York timezone, regardless of the chart’s current timeframe.
Draws horizontal lines for the 8am High and Low, with configurable colors, styles (solid/dashed), thickness, and extension length.
Draws a horizontal line for the 9am open price with customizable style.
Shows labels with price values explaining the lines.
Shows a capture label when the 9am candle breaks above the 8am high or below the 8am low.
Allows full customization of label text colors, line colors, line styles, thickness, and label distances from line start.
How to use:
Use this indicator to monitor key ICT timeframes (8am and 9am NY time) for intraday price action clues.
The capture labels help identify when price breaks key levels from the 8am candle during the 9am candle.
The configurable style options let you customize the indicator to your chart style.

Orb [LUM3N]Orb – Opening Range Breakout Strategy with Confidence Engine
Description
The Orb script is a precision-engineered Opening Range Breakout (ORB) system designed for intraday and scalping strategies. Built around the first 15–30 minutes of price action, it identifies high-probability breakout entries, confirms momentum using 1-minute signals, and automatically calculates Fibonacci-based profit targets.
Key Features:
✅ Customizable ORB Timeframe (15 or 30 mins)
✅ Dynamic Stop Loss Options (Fixed %, ATR-based, EMA trailing)
✅ Fibonacci Take Profit Targets (1.272 / 1.618 / 2.0)
✅ Retest Logic with Smart Labels (confirms strength after breakout)
✅ Time-Based Exit Functionality (automatically closes trades after X minutes)
✅ Built-in Volume Spike Filter (optional)
✅ Multi-Factor Confidence Score using RSI, MACD Histogram, and VWAP
✅ Live Dashboard displaying entry price, TP levels, live % gain, and signal confidence
The confidence engine uses a weighted scoring system to determine if a breakout is High, Medium, or Low confidence — giving traders more control and clarity.
Ideal for structured day traders looking to automate key rules and reduce guesswork.


Angel RsiRsi but on the chart itself all the settings are in Russian, convenient, understandable and most importantly useful to use


Dominancia USDT + USDCUSDT DOMINANCE + USDC DOMINANCE. It helps me identify future resistances and new BTC ATHs, as well as potential selling zones.

Vrext- Advanced EMA ZoneThe indicator highlights an area between two manually adjustable EMA-s to visibly mark a zone. A zone where the larger EMA is bellow the smaller one (indicating an uptrend) is marked green. On the opposite hand where higher EMA is above the lower the zone (indicating a downtrend) is marked red.
For correct zone marking enter EMA-s in descending order.
The indicator also allows you to add further additional EMA-s, which do not have a zone drawn between them and are just stand alone EMA-s. They are fully customisable in terms of colour, width. etc.
Additionally the indicator allows you to plot a vertical line ''xyz'' candles in the past. The idea behind it is that if you want to only focus on the previous 150 candles, there will be a clear line at the 150th candle for easier navigating.
200 EMA, 50 EMA, 21 EMAexponential Moving Average Three in on. This indicator will help you excess three EMA at one time.

EMA 50 + Highs and LowsJust a trend indicator considering volatility (EMA 50) and liquidity sweeps on active market sessions
