X HL QA market structure tool designed to frame price action within a defined context of prior session dynamics. It accomplishes this by anchoring a set of reference levels to the high, low, and open prices of a user-specified higher timeframe (e.g., 4H, 1D, etc.) and projecting those levels onto the current chart for ongoing analysis.
At its core, the indicator establishes a reference range—derived from the previous completed instance of the selected timeframe—and overlays this on the current timeframe. This range serves as a foundational structure for price interpretation in the current session.
Building upon this framework, the script constructs a set of symmetrical quadrants (or deviation zones) both inside and outside of the prior range. These include:
The midpoint (EQ) of the prior range
Levels at ±0.25x, ±0.75x, ±1.0x, ±1.5x, and ±2.0x the range height
These levels act as contextual zones that traders can use to interpret price behavior—whether it's consolidating within the prior range, approaching fair value (EQ), or expanding into directional continuation or reversal zones beyond the range.
The script operates in both real-time and historical contexts. On live bars, it dynamically updates the key levels to provide an evolving view of current price positioning. Simultaneously, it supports the display of historical levels for past sessions, enabling robust backtesting and comparative analysis of price behavior relative to previous quadrant structures.
Ultimately, this tool serves as a positional map, helping traders assess where price is trading relative to significant levels from the prior session, offering insights into potential support/resistance, overextension, or mean reversion scenarios.
Key Technical Features
Multi-Timeframe Support:
request.security() is used to pull data from a user-defined higher timeframe regardless of the current chart interval.
Visual Flexibility:
Toggle between "line" and "channel" mode.
Line color, width, and visibility are all user-controlled.
Anchoring Options:
Deviation levels can be calculated from either the previous period's open or its EQ (midpoint), giving flexibility depending on analytical preference.
Efficient Labeling:
Labels are only rendered on the last bar and are automatically cleared and redrawn to prevent duplication.
Label style, size, text color, and background color are all user-configurable.
Trading Application
This indicator is especially suited for:
1. Mean Reversion Strategies
When price moves beyond +1.0 or +1.5 deviations from the EQ or open, it may signal overextension and a potential snap back to the midpoint or range.
2. Breakout Confirmation
Sustained price action beyond ±1.0 levels may indicate trend strength or continuation beyond historical balance zones.
3. Contextual Range Awareness
EQ and Open provide structure from which traders can judge whether price is in a state of balance or imbalance.
Labels offer at-a-glance interpretation of key levels across any chosen timeframe.
4. Fractal and Multi-Session Analysis
Analysts can layer daily, weekly, and monthly versions of this indicator to observe confluence or divergence of higher timeframe structure.
Chart patterns

Moving Average ExponentialThis indicator plots 8 Exponential Moving Averages (EMAs) with customizable lengths: 20, 25, 30, 35, 40, 45, 50, and 55. It also includes optional smoothing using various moving average types (SMA, EMA, WMA, etc.) and an optional Bollinger Bands overlay based on the EMA. It helps identify trend direction, momentum, and potential reversal zones.

Boomerang Trading Indicator# Boomerang News Trading Indicator
## Overview
The Boomerang Trading Indicator is designed to identify potential reversal opportunities following major economic news releases. This indicator analyzes the initial market reaction to news events and provides visual cues for potential counter-trend trading opportunities based on Fibonacci retracement levels.
## How It Works
### News Event Detection
- Automatically detects major news release times (NFP, CPI, FOMC, etc.)
- Analyzes the first significant price movement following news releases
- Requires minimum candle size threshold to filter out weak reactions
### First Move Analysis
The indicator employs multiple analytical methods to determine the initial market direction:
**Simple Analysis (High Confidence):**
- When the news candle has ≥70% body-to-total ratio, uses straightforward bullish/bearish classification
**Advanced Analysis (Complex Cases):**
- Volume-weighted direction analysis
- Momentum and wick pattern analysis
- Market structure and gap analysis
- Weighted voting system combining all methods
### Entry Signal Generation
Based on the "boomerang" concept where markets often reverse after initial news reactions:
**For Bullish First Moves (Price Up Initially):**
- Generates SHORT entry signals when price retraces to 1.25-1.5 Fibonacci levels
- Visual: Red triangles above price bars
**For Bearish First Moves (Price Down Initially):**
- Generates LONG entry signals when price retraces to -0.25 to -0.5 Fibonacci levels
- Visual: Green triangles below price bars
## Key Features
### Visual Elements
- **Fibonacci Levels**: Displays key retracement levels based on the initial reaction range
- **Entry Zones**: Clear visual marking of optimal entry areas
- **Direction Arrows**: Shows the initial market reaction direction
- **Target Levels**: Displays profit target zones at 50% and 100% retracement levels
### Information Panel
Real-time display showing:
- Current setup status
- First move direction and body percentage
- Recommended trade direction
- Key price levels (reaction high/low)
- Profit targets with historical success rates
### Alert System
- Pre-news warnings (customizable timing)
- News event notifications
- Setup activation alerts
- Entry signal notifications
### Success Tracking
- Visual "BOOM!" animations when targets are hit
- Target 1 (50% level): ~95% historical success rate
- Target 2 (Main target): ~80% historical success rate
## Configuration Options
### Time Settings
- News release hour and minute (customizable for different events)
- Pre-news alert timing
- Setup duration (default 60 bars after news)
### Fibonacci Levels
- Adjustable retracement percentages
- Customizable target levels
- Mid-level importance weighting
### Risk Management
- Minimum reaction candle size filter
- Maximum risk point setting
- Visual risk/reward display
### Display Options
- Toggle Fibonacci level visibility
- Toggle target level display
- Toggle animation effects
- Customizable alert preferences
## Applicable News Events
This indicator is designed for high-impact economic releases:
- Non-Farm Payrolls (NFP) - First Friday, 8:30 AM ET
- Consumer Price Index (CPI) - Monthly, 8:30 AM ET
- Producer Price Index (PPI) - Monthly, 8:30 AM ET
- Gross Domestic Product (GDP) - Quarterly, 8:30 AM ET
- FOMC Interest Rate Decisions - 8 times yearly, 2:00 PM ET
## Trading Strategy Framework
### Core Principle
Markets often overreact to news initially, then reverse toward more rational price levels. This "boomerang effect" creates short-term trading opportunities.
### Entry Strategy
1. Wait for significant initial reaction (>10 points minimum)
2. Identify the initial direction using multi-factor analysis
3. Trade opposite to the initial reaction when price reaches sweet spot zones
4. Use Fibonacci retracement levels as entry triggers
### Risk Management
- Always use appropriate position sizing
- Set stop losses beyond recent swing levels
- Consider market volatility and news importance
- Monitor for setup invalidation signals
## Important Notes
### Educational Purpose
This indicator is for educational and analytical purposes. Users should:
- Thoroughly test strategies in demo environments
- Understand the risks involved in news trading
- Consider market conditions and volatility
- Use proper risk management techniques
### Market Considerations
- High volatility during news events increases both opportunity and risk
- Spreads may widen significantly during news releases
- Different brokers may have varying execution conditions
- Economic calendar timing may vary between sources
### Limitations
- Past performance does not guarantee future results
- Market conditions can change, affecting strategy effectiveness
- News events may have unexpected outcomes affecting normal patterns
- Technical analysis should be combined with fundamental analysis
## Version Information
- Compatible with TradingView Pine Script v5
- Designed for 1-minute timeframe optimal performance
- Works on major forex pairs, indices, and commodities
- Regular updates based on market condition changes
---
**Disclaimer:** This indicator is provided for educational purposes only. Trading involves substantial risk and is not suitable for all investors. Past performance is not indicative of future results. Users should conduct their own research and consider their financial situation before making trading decisions.

JG | RSI Overbought/OversoldRSI Overbought/Oversold Indicator
Shows backgrounds for each condition and allows alerts as well.
Enjoy ^-^

Price Density Strategy ScoreBased on the rules we defined, a composite score (-3 to +3) is calculated and displayed as colored bars below the chart:
Dark green (+3): Strong buy signal
Light green (+1, +2): Mildly bullish
Gray (0): Neutral
Light red (-1, -2): Mildly bearish
Dark red (-3): Strong sell signal
根据我们定义的规则,计算一个综合分数(-3 到 +3),并在图表下方用不同颜色的柱状图显示出来:
深绿色 (+3):强力买入信号
浅绿色 (+1, +2):温和看涨
灰色 (0):中性
浅红色 (-1, -2):温和看跌
深红色 (-3):强力卖出信号


Step 1: Draw Thursday HighScript Description: Thursday High Marker
This is an automated charting tool designed to identify the high of each Thursday and display it as a key reference level for future trading sessions.
Core Functionality:
The script's logic is simple and precise. It waits for the trading session on Thursday to complete. At the very beginning of Friday, it looks back, finds the highest price from Thursday, and draws a clean, white horizontal line at that level.
Key Features:
Automatic: You don't need to do anything. The script finds and draws the level on its own every week.
Forward-Looking: The line extends to the right indefinitely, allowing you to see how future price action interacts with this key level.
Self-Cleaning: To keep your chart uncluttered, the script automatically deletes the previous week's line when it draws the new one.
Lightweight: It performs a single, simple task, so it doesn't slow down your chart.
Purpose in Trading:
Traders use this kind of indicator to track significant weekly price points. The high of a late-week session like Thursday is often considered an important liquidity level. A break above this line can signal bullish strength or a "liquidity sweep," making it a valuable point of interest for making trading decisions on Friday and into the following week.

Multi Horizontal Lines 1000 Bars
This indicator is not my code, I have copied this from another user and extened the lines so they go back 1000 bars for back testing.
I use this indicator to trade Crude Oil and set the horizontal lines to 20 cents increments, 0.2 is 20 cents. You can change the horizontal lines to any price distance to suit your style of trading.
My idea is when price crosses over a horizontal line I will enter a trade long or short looking to secure 20 cents.

Cumulative Volume Delta with MAfor higher timeframes , i use 9 or 11 ema , and 5 seconds on 1 day. moving average of the cvd not the raw volume . i use it with the impulse macd and find momentum trades or selloffs when moving averages cross .

CVD with Dual MAprefered settings.
Cvd 5 seconds on 1 minute timeframe . this indicator also has moving averages . i prefer the 21 or 30 ema and the 90 or 120 ema for the other. smaller timeframe means you can see more cvd vs using 1 minute on 1 minute . the middle line acts as a definitive decision for a short because if price is also below vwap and is approaching the middle line it is more likely to go down, use the ma crosses to signal some buying momentum rising and they are the ema of the CVD not total raw volume . i use this also on 15 m but with the single cvd moving average . which is separate indicator because of some syntax error idk bro had to make a separate one for higher timeframe.

Multi Horizontal Lines 1000 BarsThis indicator is is not my code, I have copied this from another user and extened the lines so they go back 1000 bars for back testing.
I use this indicator to trade Crude Oil and set the horizontal lines to 20 cents increments, 0.2 is 20 cents. You can change the horizontal lines to any price distance to suit your style of trading.
My idea is when price crosses over a horizontal line I will enter a trade long or short looking to secure 20 cents.

DaringBull Arvind MACD GAPS MA CrossoverTo generate buy and sell signals based on a combination of MACD crossover events and histogram behavior, particularly around the zero line. This is used to identify early momentum reversals for entry and exit points in the market.
📐 MACD Setup
Uses customizable MACD parameters (defaults: Fast = 12, Slow = 26, Signal = 9).
Calculates:
MACD Line
Signal Line
Histogram (difference between MACD and Signal)
✅ Buy Conditions
A buy signal is plotted when all three of the following occur:
MACD Line crosses above Signal Line (bullish crossover).
MACD Line is still below or near the zero line (< 0.05) – indicates early reversal from a bearish zone.
First green histogram bar appears (current bar is > 0 and previous was ≤ 0) – confirming momentum shift.
➡️ When these align, a blue circle is plotted below the price bar.
❌ Sell Conditions
A sell signal is plotted when all three of the following occur:
MACD Line crosses below Signal Line (bearish crossover).
MACD Line is still above or near the zero line (> -0.05) – indicates early weakness after a bullish move.
First red histogram bar appears (current bar is < 0 and previous was ≥ 0) – confirming loss of momentum.
➡️ When these align, a red circle is plotted above the price bar.
📊 Visualization
Buy/Sell markers appear on the price chart for visual entry/exit cues.
MACD line, Signal line, and Zero line are optionally plotted for deeper analysis.
📌 Key Insights
This script aims to enter trades early in trend reversals by using MACD in conjunction with histogram shifts near the zero line.
It's especially useful in gap trading, mean reversion, or breakout confirmation setups.
The optional plot toggle allows switching between overlay and non-overlay views.

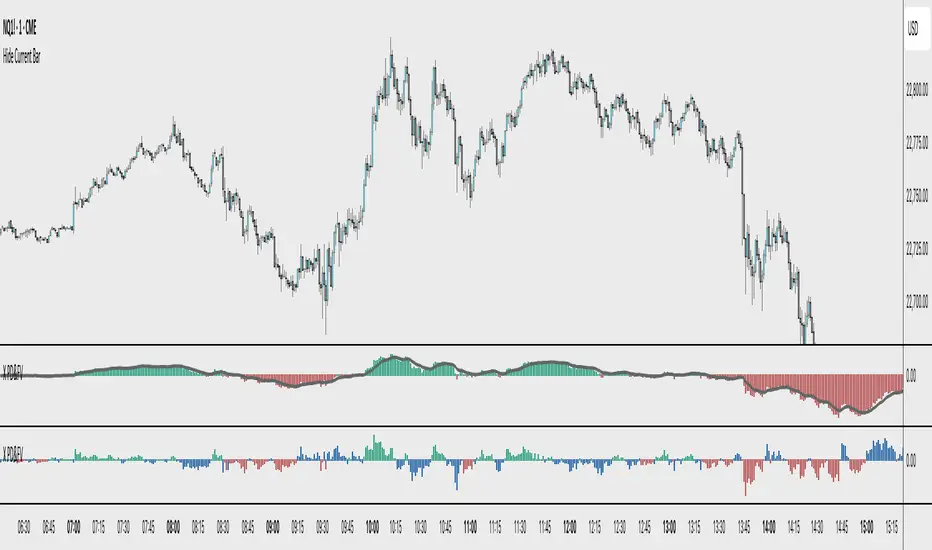
X PD&FVVisualizes the price's premium or discount relative to a moving average benchmark, highlighting mean-reversion and trend-continuation opportunities. While the underlying math is simple, the application is nuanced and can enhance decision-making in both trending and ranging market conditions.
Core Logic:
This tool calculates a custom **spread value**, defined as the distance between the current price and a chosen exponential moving average (EMA). Specifically:
When the current price is **above** the EMA, the spread is calculated as `low - EMA`.
When the price is **below** the EMA, the spread is calculated as `high - EMA`.
This approach creates a dynamic spread that reflects deviation from the EMA, with histogram bars:
Green when the spread is positive (suggesting a price premium),
Red when the spread is negative (suggesting a discount).
A secondary EMA (default 9-period) is applied to the spread itself, plotted as a smoother line over the histogram. This "EMA of spread" line can be interpreted as a moving reference level for detecting directional shifts in momentum.
Interpretation:
Zero Line = Fair Value: The horizontal zero axis represents equilibrium relative to the moving average. Movement toward or away from this line signals potential shifts in market bias.
Trend Following Use: In trending markets, traders can:
Buy when the spread dips below its EMA (discount within uptrend),
Sell when the spread rises above its EMA (premium within downtrend).
Mean Reversion Use: A return to the zero line (fair value) often acts as an **inflection point**, which traders can monitor for either:
Trend continuation (bounce away from zero), or
Reversal (cross through zero).
Customization:
EMA length (default 50) is adjustable to fit different timeframes or asset volatility.
Custom Scan - EMA & High ConditionsThis is for the Risky traders who wanna short on the exact day when it is making TOP.

Fair Value GapsFair Value Gaps Indicator
The Fair Value Gaps (FVG) Indicator is a sleek, lightweight tool designed to identify and display unfilled fair value price gaps on any chart and timeframe. It dynamically updates as price moves into gaps, shrinking the displayed area to show only the remaining unfilled portion until the gap is fully closed. With a user-friendly settings panel, traders can customize visuals to suit their style, including a minimalist version.
Features
When a valid FVG is detected through a three-candle pattern, a box appears, highlighting the precise gap range. As price enters the gap, the box adjusts to reflect the remaining unfilled area, and when fully filled, the gap is deleted, allowing new gaps to appear. The settings panel offers robust customization for a tailored experience.
Preset Styles :
Custom : Define your own color and zone extension settings. (Default)
Blue Boxes : Blue gaps with 85% transparency and zones extended to the right.
Minimalist Yellow : Yellow gaps with 75% transparency, confined to the original gap area on the candlestick.
Color : Change the gap color and transparency.
Extend FVG Zone : Enable or disable zone extension to the right.
Show Borders : Toggle subtle borders on or off for enhanced visibility.
Maximum FVGs Displayed : Change the number of gaps displayed on the chart.
Thank you for your interest in my work. I use these fair value gaps as part of my trade trigger for many of my trade entries almost every day. If you have any comments, bugs, or suggestions, please leave them here, or you can find me on Twitter or Discord.
@ ContrarianIRL
Open-source developer for over 25 years

StratNinjaTableStratNinjaTable – Multi-Timeframe The Strat Candle Pattern Table
This Pine Script indicator provides traders with a dynamic table overlay on the chart that displays The Strat candle patterns across multiple selectable timeframes. The table includes:
The candle pattern according to The Strat method (1, 2UP, 2DOWN, 3) for each chosen timeframe
Direction arrows showing bullish (▲), bearish (▼), or neutral (■) candle direction
Real-time countdown timer showing remaining time until the current candle closes, adapting automatically to daily, weekly, monthly, and longer timeframes
User inputs for selecting which timeframes to display and positioning of the table on the chart
The current ticker symbol and chart timeframe displayed prominently
The script is developed using Pine Script version 6 and is inspired by the work of shayy110, who contributed foundational code for The Strat methodology in TradingView.

9 EMA & 15 EMA Crossover Arrows//@version=5
indicator("9 EMA & 15 EMA Crossover Arrows", overlay=true)
// EMA calculations
ema9 = ta.ema(close, 9)
ema15 = ta.ema(close, 15)
// Detect crossovers (on previous candle)
bullishCross = ta.crossover(ema9 , ema15 )
bearishCross = ta.crossunder(ema9 , ema15 )
// Plot arrows on previous candle
plotshape(bullishCross, title="Bullish Cross", location=location.belowbar, color=color.green, style=shape.arrowup, size=size.small, offset=-1)
plotshape(bearishCross, title="Bearish Cross", location=location.abovebar, color=color.red, style=shape.arrowdown, size=size.small, offset=-1)
// Plot EMAs (optional for visual)
plot(ema9, color=color.green, title="9 EMA")
plot(ema15, color=color.orange, title="15 EMA")

terils indicatorsVWAP
Yesterday’s High and Low
Today’s High and Low
EMAs (20, 50, 100, 200)
VWAP
Yesterday’s High and Low
Today’s High and Low
EMAs (20, 50, 100, 200)

VWAP + HL + EMAsVWAP
Yesterday’s High and Low
Today’s High and Low
EMAs (20, 50, 100, 200)
VWAP
Yesterday’s High and Low
Today’s High and Low
EMAs (20, 50, 100, 200)

MSFT Bias at NYSE Open (9:30 ET)have an 85% bias accuracy rate with this indicator. wait for market open

Customizable Engulfing, Pin Bar, Inside Bar Colorengulfing,pin,inside bar candle which helps to identify these candles for better visualization and understanding

OPR Asia-New-York [Elykia]This Pine Script indicator, called "OPR Asia-New-York ", displays time-based boxes corresponding to two specific trading periods known as OPR (Opening Price Range):
🎯 Purpose of the Indicator:
To visualize two key market time windows (morning and afternoon) as extended boxes, helping with technical analysis around opening ranges.
🕒 Two sessions displayed as boxes:
🔹 Morning OPR:
Default: from 09:00 to 09:15 (configurable)
The box extends until 10:30.
It captures the highest and lowest candle within this interval.
🔸 Afternoon OPR:
Default: from 15:30 to 15:45
The box extends until 17:30.
Follows the same logic as the morning session.
⚙️ Dashboard Options:
Enable or disable the morning or afternoon box individually
Select the timezone (e.g., GMT+2)
Customize all colors (morning/afternoon boxes, median line)
Set your own start/end/extension times for each session
📦 Each box includes:
A colored rectangle showing the price range (high/low)
A dotted median line between the high and low
The box and line extend until the end time defined
🧠 Usefulness for Traders:
Identify liquidity zones or consolidation areas
Trade setups like liquidity grabs, breakouts, or fakeouts around the OPR
Align with ICT methods or scalping strategies based on session behavior

3-Candle HH/HL or LH/LL (Number Labels Over Candles)What This Script Does:
This Pine Script detects 3 consecutive candlesticks that show:
Higher Highs and Higher Lows → a bullish structure
Lower Highs and Lower Lows → a bearish structure
When such a pattern is found, the script:
Marks each of the 3 candles with a number: 1, 2, and 3
Labels appear centered on each candle (at the close price)
You can adjust:
Label size (tiny → huge)
Background color (bullish/bearish)
Text color
Example:
If candles form:
Candle A: higher high & higher low
Candle B: higher than A
Candle C: higher than B
Then you’ll see 1, 2, 3 labels on those candles in green (or your selected color).
Same goes for a bearish pattern in red.
