9 EMA Angle Color Indicator//@version=5
indicator("9 EMA Angle Color Indicator", overlay=true)
// === INPUTS ===
emaLength = input.int(9, title="EMA Length")
angleThreshold = input.float(20.0, title="Angle Threshold (Degrees)", minval=0.1)
lookbackBars = input.int(5, title="Bars to Calculate Angle", minval=1)
// === EMA CALCULATION ===
emaValue = ta.ema(close, emaLength)
// === ANGLE CALCULATION (in degrees) ===
// Use simple slope * 100 and arc tangent conversion to degrees
slope = (emaValue - emaValue ) / lookbackBars
angle = math.atan(slope) * (180 / math.pi)
// === COLOR LOGIC ===
var color emaColor = color.black
// Initial color: black when angle is within range
emaColor := color.black
// Price and angle-based color change
if angle > angleThreshold and close > emaValue
emaColor := color.green
else if angle < -angleThreshold and close < emaValue
emaColor := color.red
else
emaColor := color.black
// === PLOT EMA ===
plot(emaValue, color=emaColor, linewidth=2, title="9 EMA Colored")
Chart patterns

Retracement Bar🔍 Retracement Bar – RB
The Retracement Bar (RB) indicator is designed to highlight potential reversal zones by identifying candles where price shows a clear rejection from the extremes. It helps traders spot moments where institutional inventory rebalancing may be occurring — often a precursor to a strong move in the opposite direction.
RB highlights bars that:
Have a relatively small real body compared to the total candle range.
Show a long wick (upper or lower) that exceeds a user-defined percentage of the candle range.
Suggest a potential rejection of price — upward or downward — based on candle structure.
When these conditions are met, a triangle symbol is plotted:
🔻 Red triangle above a candle suggests a possible short opportunity.
🔺 Green triangle below a candle suggests a possible long opportunity.
This indicator does not repaint and triggers only at candle close.
📈 Example – Long Entry
Signal: A green triangle appears below a candle (suggesting rejection of lower prices).
Steps:
Wait for the current RB candle to close.
On the next candle:
Enter long if price breaks above the high of the RB candle.
Alternatively, wait for a pullback and enter based on confirmation (e.g., bullish engulfing, hammer, trendline bounce).
Place a stop-loss just below the low of the RB candle.
Set a target:
Based on a 2:1 risk-reward ratio.
Or use the next resistance/Fibonacci level.
📉 Example – Short Entry
Signal: A red triangle appears above a candle (suggesting rejection of higher prices).
Steps:
Wait for the current RB candle to close.
On the next candle:
Enter short if price breaks below the low of the RB candle.
Or wait for confirmation (e.g., bearish engulfing, shooting star, breakdown from a level).
Place a stop-loss just above the high of the RB candle.
Set a target:
2:1 risk-reward ratio.
Or the next support/Fibonacci zone.
✅ Recommended Filters for Better Results:
Confluence with support/resistance zones.
Trend alignment or reversal context.
Additional confirmation from price action patterns or oscillators.
Volume analysis for entry strength.
🙏 Acknowledgment
Special thanks to Rob Hoffman for inspiring this concept through his original Inventory Retracement Bar (IRB) idea — this indicator is a reinterpretation meant to visually and practically support discretionary price action traders.


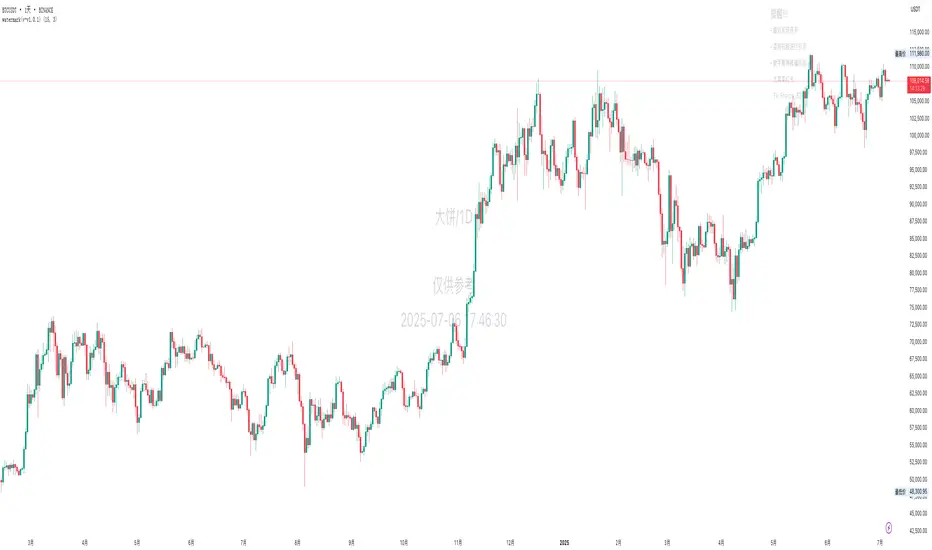
Jumping watermark# Jumping watermark
## Function description
- Dynamic watermark: Mainly used to add dynamic watermarks to prevent theft and transfer when recording videos.
- Static watermark: Sharing opinions can easily include information such as trading pairs, cycles, current time, and individual signatures.
### Static watermark:
Display the watermark related to the current trading pair in the center of the chart.
- Configuration items:
- You can choose to configure the display content: current trading pair code and name, cycle, date, time, and individual signature content
### Dynamic watermark
Display the configured watermark content in a dynamic random position.
- Configuration items:
- Turn on or off the display of watermark jumping
- Modify the display text content and style by yourself
----- 中文简介-----
# 跳动水印
## 功能描述
- 动态水印: 主要可用于视频录制时添加动态水印防盗、防搬运。
- 静态水印:观点分享是可方便的带上交易对、周期、当前时间、个签等信息。
### 静态水印:
在图表中心位置显示当前交易对相关信息水印。
- 配置项:
- 可选择配置显示内容:当前交易对代码及名称、周期、日期、时间、个签内容
### 动态水印
动态随机位置显示配置水印内容。
- 配置项:
- 开启或关闭显示水印跳动
- 自行修改配置显示文字内容和样式
Altcoin Liquidity Flow Score - Big Moves Only//@version=6
indicator("Altcoin Liquidity Flow Score - Big Moves Only", overlay=false)
// Pull weekly macro data
walcl = request.security("FRED:WALCL", "W", close)
rrp = request.security("FRED:RRPONTSYD", "W", close)
tga = request.security("FRED:WDTGAL", "W", close)
hyg = request.security("AMEX:HYG", "W", close)
total3 = request.security("CRYPTOCAP:TOTAL3", "W", close)
usdt_d = request.security("CRYPTOCAP:USDT.D", "W", close)
// Calculate week-over-week change
delta_liquidity = ta.change(walcl + rrp - tga)
delta_rrp = ta.change(rrp)
delta_hyg = ta.change(hyg)
delta_total3 = ta.change(total3)
delta_usdt_d = ta.change(usdt_d)
// Compute raw score
raw_score = delta_liquidity - delta_rrp + delta_hyg + delta_total3 - delta_usdt_d
// Apply 3-week smoothing
score = ta.ema(raw_score, 3)
// Define threshold for major liquidity shift
threshold = 2.0
// Plot score + background for only strong signals
plot(score, title="Liquidity Flow Score (Smoothed)", color=color.teal, linewidth=2)
hline(0, "Zero Line", color=color.gray)
bgcolor(score > threshold ? color.new(color.green, 85) : score < -threshold ? color.new(color.red, 85) : na)

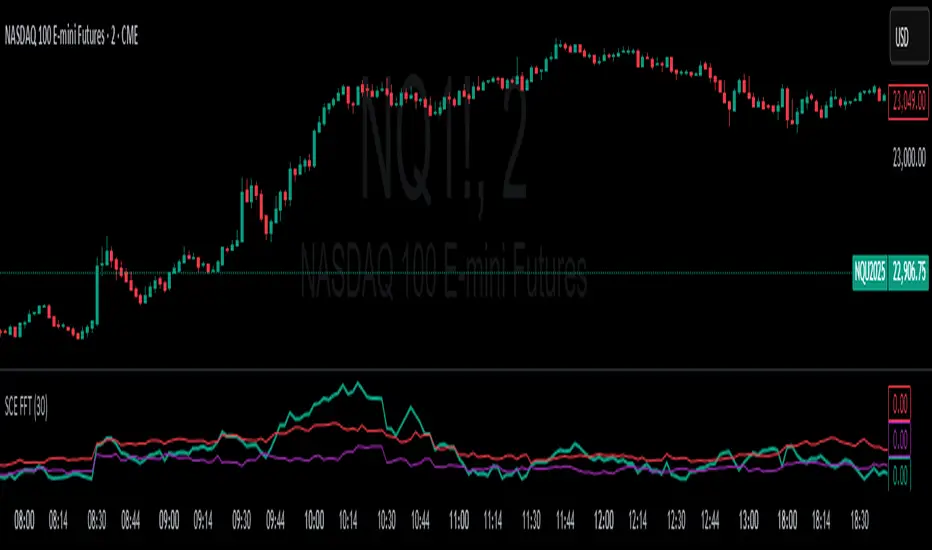
Fast Fourier Transform [ScorsoneEnterprises]The SCE Fast Fourier Transform (FFT) is a tool designed to analyze periodicities and cyclical structures embedded in price. This is a Fourier analysis to transform price data from the time domain into the frequency domain, showing the rhythmic behaviors that are otherwise invisible on standard charts.
Instead of merely observing raw prices, this implementation applies the FFT on the logarithmic returns of the asset:
Log Return(𝑚) = log(close / close )
This ensures stationarity and stabilizes variance, making the analysis statistically robust and less influenced by trends or large price swings.
For a user-defined lookback window 𝑁:
Each frequency component 𝑘 is computed by summing real and imaginary projections of log-returns multiplied by complex exponential functions:
𝑒^−𝑖𝜃 = cos(𝜃)−𝑖sin(𝜃)
where:
θ = 2πkm / N
he result is the magnitude spectrum, calculated as:
Magnitude(𝑘) = sqrt(Real_Sum(𝑘)^2 + Imag_Sum(𝑘)^2)
This spectrum represents the strength of oscillations at each frequency over the lookback period, helping traders identify dominant cycles.
Visual Analysis & Interpretation
To give traders context for the FFT spectrum’s values, this script calculates:
25th Percentile (Purple Line)
Represents relatively low cyclical intensity.
Values below this threshold may signal quiet, noisy, or trendless periods.
75th Percentile (Red Line)
Represents heightened cyclical dominance.
Values above this threshold may indicate significant periodic activity and potential trend formation or rhythm in price action.
The FFT magnitude of the lowest frequency component (index 0) is plotted directly on the chart in teal. Observing how this signal fluctuates relative to its percentile bands provides a dynamic measure of cyclical market activity.
Chart examples
In this NYSE:CL chart, we see the regime of the price accurately described in the spectral analysis. We see the price above the 75th percentile continue to trend higher until it breaks back below.
In long trending markets like NYSE:PL has been, it can give a very good explanation of the strength. There was confidence to not switch regimes as we never crossed below the 75th percentile early in the move.
The script is also usable on the lower timeframes. There is no difference in the usability from the different timeframes.
Script Parameters
Lookback Value (N)
Default: 30
Defines how many bars of data to analyze. Larger N captures longer-term cycles but may smooth out shorter-term oscillations.

TVI-3 Z-Score: MA + VWAP + BB Composite🔧 Overview:
It combines:
Z-score of price relative to the 200-period simple moving average (MA)
Z-score of price relative to the 200-period VWAP (volume-weighted average price)
Z-score of Bollinger Band width
The result is an average of these three Z-scores, plotted as a composite indicator for identifying overvalued and undervalued conditions.

Nến Tô Màu Theo Volume / MA(21)Condition
Point color
Volume ≥ 3× MA(24)
Violet
Volume ≥ 1.5× MA(24)
Red
Volume < 1.5× MA(24) & bullish
White
Volume < 1.5× MA(24) & bearish
Black

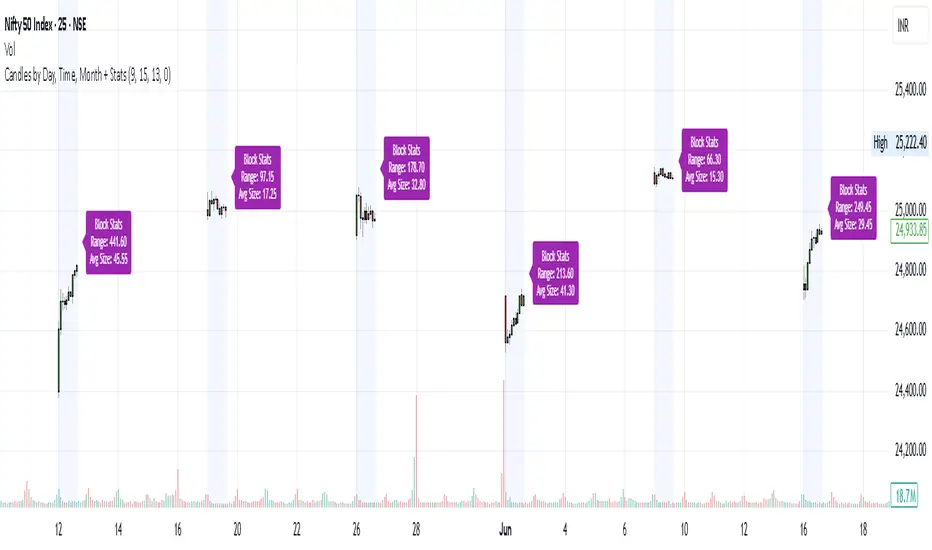
Candles by Day, Time, Month + StatsThis Pine Script allows you to filter and display candles based on:
📅 Specific days of the week
🕒 Custom intraday time ranges (e.g., 9:15 to 10:30)
📆 Selected months
📊 Shows stats for each filtered block:
🔼 Range (High – Low)
📏 Average candle body size
⚙️ Key Features:
✅ Filter by day, time, and month
🎛 Toggle to show/hide the stats label
🟩 Candles are drawn only for selected conditions
📍 Stats label is positioned above session high (adjustable)
⚠️ Important Setup Instructions:
✅ 1. Use it on a blank chart
To avoid overlaying with default candles:
Open the chart of your preferred symbol
Click on the chart type (top toolbar: "Candles", "Bars", etc.)
Select "Blank" from the dropdown (this will hide all native candles)
Apply this indicator
This ensures only the filtered candles from the script are visible.
Adjust for your local timezone
This script uses a hardcoded timezone: "Asia/Kolkata"
If you are in a different timezone, change it to your own (e.g. "America/New_York", "Europe/London", etc.) in all instances of:
time(timeframe.period, "Asia/Kolkata")
timestamp("Asia/Kolkata", ...)
Use Cases:
Opening range behavior on specific weekdays/months
Detecting market anomalies during exact windows
Building visual logs of preferred trade hours

My script//@version=5
indicator("MA + OI + Volume Breakout", overlay=true)
// === MA Parameters ===
ma_type = input.string("EMA", title="MA Type", options= )
ma(src, len, type) =>
type == "SMA" ? ta.sma(src, len) :
type == "EMA" ? ta.ema(src, len) :
ta.wma(src, len)
ma5 = ma(close, 5, ma_type)
ma21 = ma(close, 21, ma_type)
ma50 = ma(close, 50, ma_type)
ma100 = ma(close, 100, ma_type)
plot(ma5, "5-day MA", color=color.yellow, linewidth=2)
plot(ma21, "21-day MA", color=color.orange, linewidth=2)
plot(ma50, "50-day MA", color=color.fuchsia, linewidth=2)
plot(ma100, "100-day MA", color=color.blue, linewidth=2)
// === Trend Signal ===
bullish_trend = ma5 > ma21 and ma21 > ma50 and ma50 > ma100
bearish_trend = ma5 < ma21 and ma21 < ma50 and ma50 < ma100
bgcolor(bullish_trend ? color.new(color.green, 85) : bearish_trend ? color.new(color.red, 85) : na)
// === Volume Breakout ===
vol_avg = ta.sma(volume, 20)
vol_breakout = volume > 1.5 * vol_avg
plotshape(vol_breakout, title="Volume Breakout", location=location.belowbar, style=shape.circle, color=color.aqua, size=size.tiny)
// === Open Interest Overlay (assumes OI data via external input or future integration) ===
// Placeholder: simulate OI input (replace with `request.security(syminfo.tickerid, ..., ...)` if available)
oi = input.float(na, title="Open Interest (external feed)")
oi_avg = ta.sma(oi, 20)
oi_breakout = oi > 1.2 * oi_avg
plotshape(not na(oi) and oi_breakout, title="OI Spike", location=location.belowbar, style=shape.diamond, color=color.purple, size=size.tiny)
plot(oi, title="Open Interest", color=color.gray, display=display.none) // Optional: hidden line for alerts
// === Composite Signal ===
strong_long = bullish_trend and vol_breakout and oi_breakout
plotshape(strong_long, title="Strong Long Signal", location=location.belowbar, style=shape.labelup, text="LONG", size=size.small, color=color.lime)
// === Screener Logic ===
// Use `strong_long` as your filter condition in a screener or dashboard output

Normalized Reserve Risk (Proxy Z-Score)normalised version of the reserve risk indicator on btc magazine because the btc magazine one is poo .

Min Forrige Daily CandleBruges til at se forrige daily candle. Daily high, low og close. Kan bruges til teknisk analyse.

Byquan ADX‑RSI Cross AlertThis indicator is used when the ADX exceeds the 40 threshold to look for potential reversals, confirmed by the crossover between the RSI and the RSI-based moving average, as well as the EMA 9.


Momentum SNR VIP [3 TP + Max 50 Pip SL]//@version=6
indicator("Momentum SNR VIP ", overlay=true)
// === Settings ===
pip = input.float(0.0001, "Pip Size", step=0.0001)
sl_pip = 50 * pip
tp1_pip = 40 * pip
tp2_pip = 70 * pip
tp3_pip = 100 * pip
lookback = input.int(20, "Lookback for S/R", minval=5)
// === SNR ===
pivotHigh = ta.pivothigh(high, lookback, lookback)
pivotLow = ta.pivotlow(low, lookback, lookback)
supportZone = not na(pivotLow)
resistanceZone = not na(pivotHigh)
plotshape(supportZone, title="Support", location=location.belowbar, color=color.blue, style=shape.triangleup, size=size.tiny)
plotshape(resistanceZone, title="Resistance", location=location.abovebar, color=color.red, style=shape.triangledown, size=size.tiny)
// === Price Action ===
bullishEngulfing = close < open and close > open and close > open and open <= close
bearishEngulfing = close > open and close < open and close < open and open >= close
bullishPinBar = close < open and (low - math.min(open, close)) > 1.5 * math.abs(close - open)
bearishPinBar = close > open and (high - math.max(open, close)) > 1.5 * math.abs(close - open)
buySignal = supportZone and (bullishEngulfing or bullishPinBar)
sellSignal = resistanceZone and (bearishEngulfing or bearishPinBar)
// === SL & TP ===
rawBuySL = low - 10 * pip
buySL = math.max(close - sl_pip, rawBuySL)
buyTP1 = close + tp1_pip
buyTP2 = close + tp2_pip
buyTP3 = close + tp3_pip
rawSellSL = high + 10 * pip
sellSL = math.min(close + sl_pip, rawSellSL)
sellTP1 = close - tp1_pip
sellTP2 = close - tp2_pip
sellTP3 = close - tp3_pip
// === Plot Lines ===
plot(buySignal ? buySL : na, title="Buy SL", color=color.red, style=plot.style_line, linewidth=1)
plot(buySignal ? buyTP1 : na, title="Buy TP1", color=color.green, style=plot.style_line, linewidth=1)
plot(buySignal ? buyTP2 : na, title="Buy TP2", color=color.green, style=plot.style_line, linewidth=1)
plot(buySignal ? buyTP3 : na, title="Buy TP3", color=color.green, style=plot.style_line, linewidth=1)
plot(sellSignal ? sellSL : na, title="Sell SL", color=color.red, style=plot.style_line, linewidth=1)
plot(sellSignal ? sellTP1 : na, title="Sell TP1", color=color.green, style=plot.style_line, linewidth=1)
plot(sellSignal ? sellTP2 : na, title="Sell TP2", color=color.green, style=plot.style_line, linewidth=1)
plot(sellSignal ? sellTP3 : na, title="Sell TP3", color=color.green, style=plot.style_line, linewidth=1)
// === Floating Labels on Right Side ===
if buySignal
label.new(x=bar_index + 50, y=buySL, text="SL", style=label.style_label_right, color=color.red, textcolor=color.white)
label.new(x=bar_index + 50, y=buyTP1, text="TP1", style=label.style_label_right, color=color.green, textcolor=color.white)
label.new(x=bar_index + 50, y=buyTP2, text="TP2", style=label.style_label_right, color=color.green, textcolor=color.white)
label.new(x=bar_index + 50, y=buyTP3, text="TP3", style=label.style_label_right, color=color.green, textcolor=color.white)
if sellSignal
label.new(x=bar_index + 50, y=sellSL, text="SL", style=label.style_label_right, color=color.red, textcolor=color.white)
label.new(x=bar_index + 50, y=sellTP1, text="TP1", style=label.style_label_right, color=color.green, textcolor=color.white)
label.new(x=bar_index + 50, y=sellTP2, text="TP2", style=label.style_label_right, color=color.green, textcolor=color.white)
label.new(x=bar_index + 50, y=sellTP3, text="TP3", style=label.style_label_right, color=color.green, textcolor=color.white)
// === Signal Markers ===
plotshape(buySignal, title="Buy Signal", location=location.belowbar, color=color.green, style=shape.labelup, text="BUY")
plotshape(sellSignal, title="Sell Signal", location=location.abovebar, color=color.red, style=shape.labeldown, text="SELL")
// === Alerts ===
alertcondition(buySignal, title="Buy Alert", message="🟢 BUY at Support Zone + Price Action")
alertcondition(sellSignal, title="Sell Alert", message="🟡 SELL at Resistance Zone + Price Action")

Previous 10 Weekly Highs/Lowsvbcsvbabvdvbnsvnsiavonvbdobvasvbjsdavbdsoajvbdjaovbajv bajv adsjkv jksdv jkav kjsdf

Momentum SNR VIP [3 TP + Max 50 Pip SL]//@version=6
indicator("Momentum SNR VIP ", overlay=true)
// === Settings ===
pip = input.float(0.0001, "Pip Size", step=0.0001)
sl_pip = 50 * pip
tp1_pip = 40 * pip
tp2_pip = 70 * pip
tp3_pip = 100 * pip
lookback = input.int(20, "Lookback for S/R", minval=5)
// === SNR ===
pivotHigh = ta.pivothigh(high, lookback, lookback)
pivotLow = ta.pivotlow(low, lookback, lookback)
supportZone = not na(pivotLow)
resistanceZone = not na(pivotHigh)
plotshape(supportZone, title="Support", location=location.belowbar, color=color.blue, style=shape.triangleup, size=size.tiny)
plotshape(resistanceZone, title="Resistance", location=location.abovebar, color=color.red, style=shape.triangledown, size=size.tiny)
// === Price Action ===
bullishEngulfing = close < open and close > open and close > open and open <= close
bearishEngulfing = close > open and close < open and close < open and open >= close
bullishPinBar = close < open and (low - math.min(open, close)) > 1.5 * math.abs(close - open)
bearishPinBar = close > open and (high - math.max(open, close)) > 1.5 * math.abs(close - open)
buySignal = supportZone and (bullishEngulfing or bullishPinBar)
sellSignal = resistanceZone and (bearishEngulfing or bearishPinBar)
// === SL & TP ===
rawBuySL = low - 10 * pip
buySL = math.max(close - sl_pip, rawBuySL)
buyTP1 = close + tp1_pip
buyTP2 = close + tp2_pip
buyTP3 = close + tp3_pip
rawSellSL = high + 10 * pip
sellSL = math.min(close + sl_pip, rawSellSL)
sellTP1 = close - tp1_pip
sellTP2 = close - tp2_pip
sellTP3 = close - tp3_pip
// === Plot Buy/Sell Signal
plotshape(buySignal, title="Buy Signal", location=location.belowbar, color=color.green, style=shape.labelup, text="BUY")
plotshape(sellSignal, title="Sell Signal", location=location.abovebar, color=color.red, style=shape.labeldown, text="SELL")
// === Plot SL & TP lines
plot(buySignal ? buySL : na, title="Buy SL", color=color.red, style=plot.style_linebr, linewidth=1)
plot(buySignal ? buyTP1 : na, title="Buy TP1", color=color.green, style=plot.style_linebr, linewidth=1)
plot(buySignal ? buyTP2 : na, title="Buy TP2", color=color.green, style=plot.style_linebr, linewidth=1)
plot(buySignal ? buyTP3 : na, title="Buy TP3", color=color.green, style=plot.style_linebr, linewidth=1)
plot(sellSignal ? sellSL : na, title="Sell SL", color=color.red, style=plot.style_linebr, linewidth=1)
plot(sellSignal ? sellTP1 : na, title="Sell TP1", color=color.green, style=plot.style_linebr, linewidth=1)
plot(sellSignal ? sellTP2 : na, title="Sell TP2", color=color.green, style=plot.style_linebr, linewidth=1)
plot(sellSignal ? sellTP3 : na, title="Sell TP3", color=color.green, style=plot.style_linebr, linewidth=1)
// === Labels
if buySignal
label.new(x=bar_index, y=buySL, text="SL : " + str.tostring(buySL, "#.0000"), style=label.style_label_down, color=color.red, textcolor=color.white)
label.new(x=bar_index, y=buyTP1, text="TP1 : " + str.tostring(buyTP1, "#.0000"), style=label.style_label_up, color=color.green, textcolor=color.white)
label.new(x=bar_index, y=buyTP2, text="TP2 : " + str.tostring(buyTP2, "#.0000"), style=label.style_label_up, color=color.green, textcolor=color.white)
label.new(x=bar_index, y=buyTP3, text="TP3 : " + str.tostring(buyTP3, "#.0000"), style=label.style_label_up, color=color.green, textcolor=color.white)
if sellSignal
label.new(x=bar_index, y=sellSL, text="SL : " + str.tostring(sellSL, "#.0000"), style=label.style_label_up, color=color.red, textcolor=color.white)
label.new(x=bar_index, y=sellTP1, text="TP1 : " + str.tostring(sellTP1, "#.0000"), style=label.style_label_down, color=color.green, textcolor=color.white)
label.new(x=bar_index, y=sellTP2, text="TP2 : " + str.tostring(sellTP2, "#.0000"), style=label.style_label_down, color=color.green, textcolor=color.white)
label.new(x=bar_index, y=sellTP3, text="TP3 : " + str.tostring(sellTP3, "#.0000"), style=label.style_label_down, color=color.green, textcolor=color.white)
// === Alerts
alertcondition(buySignal, title="Buy Alert", message="🟢 BUY at Support Zone + Price Action")
alertcondition(sellSignal, title="Sell Alert", message="🟡 SELL at Resistance Zone + Price Action")

Momentum SNR VIP [INDICATOR ONLY]//@version=6
indicator("Momentum SNR VIP ", overlay=true)
// === Inputs ===
lookback = input.int(20, "Lookback for S/R", minval=5)
rr_ratio = input.float(2.0, "Risk-Reward Ratio", minval=0.5, step=0.1)
// === SNR Detection ===
pivotHigh = ta.pivothigh(high, lookback, lookback)
pivotLow = ta.pivotlow(low, lookback, lookback)
supportZone = not na(pivotLow)
resistanceZone = not na(pivotHigh)
plotshape(supportZone, title="Support", location=location.belowbar, color=color.blue, style=shape.triangleup, size=size.tiny)
plotshape(resistanceZone, title="Resistance", location=location.abovebar, color=color.red, style=shape.triangledown, size=size.tiny)
// === Price Action ===
bullishEngulfing = close < open and close > open and close > open and open <= close
bearishEngulfing = close > open and close < open and close < open and open >= close
bullishPinBar = close < open and (low - math.min(open, close)) > 1.5 * math.abs(close - open)
bearishPinBar = close > open and (high - math.max(open, close)) > 1.5 * math.abs(close - open)
buySignal = supportZone and (bullishEngulfing or bullishPinBar)
sellSignal = resistanceZone and (bearishEngulfing or bearishPinBar)
// === SL & TP ===
buySL = low - 10
buyTP = close + (close - buySL) * rr_ratio
sellSL = high + 10
sellTP = close - (sellSL - close) * rr_ratio
// === Plot Signals
plotshape(buySignal, title="Buy Signal", location=location.belowbar, color=color.green, style=shape.labelup, text="BUY")
plotshape(sellSignal, title="Sell Signal", location=location.abovebar, color=color.red, style=shape.labeldown, text="SELL")
plot(buySignal ? buySL : na, title="Buy SL", color=color.red, style=plot.style_linebr, linewidth=1)
plot(buySignal ? buyTP : na, title="Buy TP", color=color.green, style=plot.style_linebr, linewidth=1)
plot(sellSignal ? sellSL : na, title="Sell SL", color=color.red, style=plot.style_linebr, linewidth=1)
plot(sellSignal ? sellTP : na, title="Sell TP", color=color.green, style=plot.style_linebr, linewidth=1)
// === Labels (Fixed)
if buySignal
label.new(x=bar_index, y=buySL, text="SL : " + str.tostring(buySL, "#.00"), style=label.style_label_down, color=color.red, textcolor=color.white)
label.new(x=bar_index, y=buyTP, text="TP 1 : " + str.tostring(buyTP, "#.00"), style=label.style_label_up, color=color.green, textcolor=color.white)
if sellSignal
label.new(x=bar_index, y=sellSL, text="SL : " + str.tostring(sellSL, "#.00"), style=label.style_label_up, color=color.red, textcolor=color.white)
label.new(x=bar_index, y=sellTP, text="TP 1 : " + str.tostring(sellTP, "#.00"), style=label.style_label_down, color=color.green, textcolor=color.white)
// === Alerts
alertcondition(buySignal, title="Buy Alert", message="🟢 BUY at Support Zone + Price Action")
alertcondition(sellSignal, title="Sell Alert", message="🟡 SELL at Resistance Zone + Price Action")


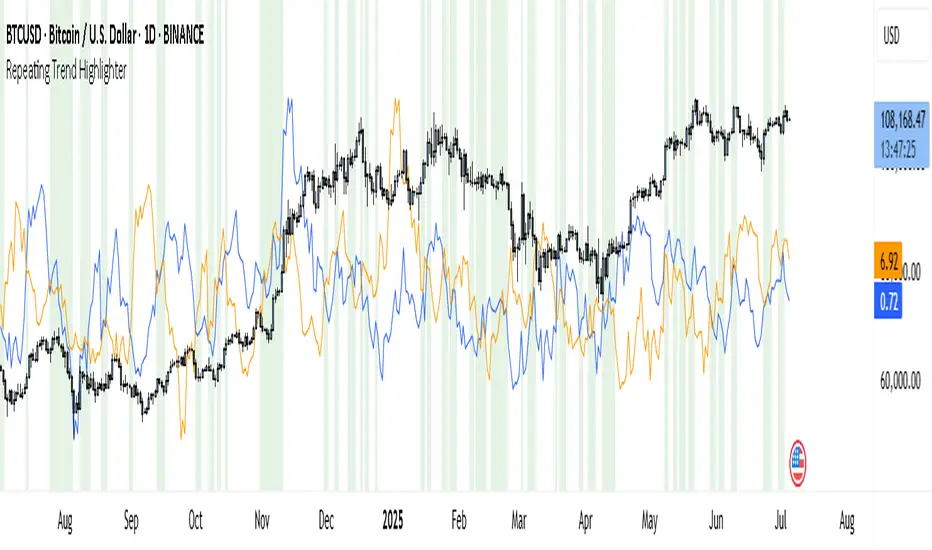
Repeating Trend HighlighterThis custom indicator helps you see when the current price trend is similar to a past trend over the same number of candles. Think of it like checking whether the market is repeating itself.
You choose three settings:
• Lookback Period: This is how many candles you want to measure. For example, if you set it to 10, it looks at the price change over the last 10 bars.
• Offset Bars Ago: This tells the indicator how far back in time to look for a similar move. If you set it to 50, it compares the current move to what happened 50 bars earlier.
• Tolerance (%): This is how closely the moves must match to be considered similar. A smaller number means you only get a signal if the moves are almost the same, while a larger number allows more flexibility.
When the current price move is close enough to the past move you picked, the background of your chart turns light green. This makes it easy to spot repeating trends without studying numbers manually.
You’ll also see two lines under your chart if you enable them: a blue line showing the percentage change of the current move and an orange line showing the change in the past move. These help you compare visually.
This tool is useful in several ways. You can use it to confirm your trading setups, for example if you suspect that a strong rally or pullback is happening again. You can also use it to filter trades by combining it with other indicators, so you only enter when trends repeat. Many traders use it as a learning tool, experimenting with different lookback periods and offsets to understand how often similar moves happen.
If you are a scalper working on short timeframes, you can set the lookback to a small number like 3–5 bars. Swing traders who prefer daily or weekly charts might use longer lookbacks like 20–30 bars.
Keep in mind that this indicator doesn’t guarantee price will move the same way again—it only shows similarity in how price changed over time. It works best when you use it together with other signals or market context.
In short, it’s like having a simple spotlight that tells you: “This move looks a lot like what happened before.” You can then decide if you want to act on that information.
If you’d like, I can help you tweak the settings or combine it with alerts so it notifies you when these patterns appear.
Momentum SNR VIP (Step 2)//@version=6
indicator("Momentum SNR VIP (Step 2)", overlay=true)
// === Inputs ===
lookback = input.int(20, "Lookback for S/R", minval=5)
rr_ratio = input.float(2.0, "Risk-Reward Ratio", minval=0.5, step=0.1)
plot(close, color=color.orange)
