Folter_TOP_ROMASHKA]The indicator helps to filter out the signals. In the settings, you need to set CCI Length=200.
After that, the probability of processing the TOR Camomile signal is higher if the signal appears at a value of this indicator below or near 0 level.
Chart patterns

[L0!FT] bartrulez Buy/Sell Indicator Sequential bartrulez Buy/Sell Indicator Sequential - 14 Days RSI, 200 SMA + SELL & BUY Signals

EMA 9 vs EMA 150 Cross Indicator//@version=5
indicator("EMA 9 vs EMA 150 Cross Indicator", overlay=true)
// Input EMAs
shortEmaLen = input.int(9, title="Short EMA (Fast)")
longEmaLen = input.int(150, title="Long EMA (Slow)")
// Calculate EMAs
emaShort = ta.ema(close, shortEmaLen)
emaLong = ta.ema(close, longEmaLen)
// Detect Crosses
bullishCross = ta.crossover(emaShort, emaLong)
bearishCross = ta.crossunder(emaShort, emaLong)
// Plot EMAs
plot(emaShort, title="EMA 9", color=color.gray)
emaColor = emaShort > emaLong ? color.green : color.red
plot(emaLong, title="EMA 150", color=emaColor, linewidth=2)
// Plot Arrows
plotshape(bullishCross, title="Buy Signal", location=location.belowbar, color=color.green, style=shape.arrowup, size=size.small)
plotshape(bearishCross, title="Sell Signal", location=location.abovebar, color=color.red, style=shape.arrowdown, size=size.small)

BG CloseCandleThis simple yet effective strategy script allows you to schedule automated entries (Buy or Sell) at three customizable times throughout the trading day. Each session can be individually enabled, with its own execution time and trade direction.
You can define:
• Entry time (Hour & Minute) for each session
• Whether each session should execute a Buy or a Sell order
• Your preferred Take Profit and Stop Loss levels (in ticks)
• Lot size per order
The strategy is designed specifically for the 1-minute timeframe, offering the most precise execution of time-based entries. It resets automatically each day and limits the number of trades to a maximum of three per session.
📌 I personally use this strategy on the Nasdaq 100 E-mini Futures (NQ) for intraday setups and session-based candle closes.
Perfect for testing market behavior at defined moments — ideal for overnight, premarket, or close-of-candle strategies.
Thank you for your interest, and wishing you profitable trading

EMA 9 & 150 Cross Arrow//@version=5
indicator("EMA 9 & 150 Cross Arrow", overlay=true)
// Input EMAs
emaShort = ta.ema(close, 9)
emaLong = ta.ema(close, 150)
// Detect Crosses
bullishCross = ta.crossover(emaShort, emaLong)
bearishCross = ta.crossunder(emaShort, emaLong)
// Plot EMAs
plot(emaShort, color=color.green, title="EMA 9")
plot(emaLong, color=color.red, title="EMA 150")
// Plot Arrows
plotshape(bullishCross, title="Bullish Cross", location=location.belowbar, color=color.green, style=shape.arrowup, size=size.small)
plotshape(bearishCross, title="Bearish Cross", location=location.abovebar, color=color.red, style=shape.arrowdown, size=size.small)

X HL QA market structure tool designed to frame price action within a defined context of prior session dynamics. It accomplishes this by anchoring a set of reference levels to the high, low, and open prices of a user-specified higher timeframe (e.g., 4H, 1D, etc.) and projecting those levels onto the current chart for ongoing analysis.
At its core, the indicator establishes a reference range—derived from the previous completed instance of the selected timeframe—and overlays this on the current timeframe. This range serves as a foundational structure for price interpretation in the current session.
Building upon this framework, the script constructs a set of symmetrical quadrants (or deviation zones) both inside and outside of the prior range. These include:
The midpoint (EQ) of the prior range
Levels at ±0.25x, ±0.75x, ±1.0x, ±1.5x, and ±2.0x the range height
These levels act as contextual zones that traders can use to interpret price behavior—whether it's consolidating within the prior range, approaching fair value (EQ), or expanding into directional continuation or reversal zones beyond the range.
The script operates in both real-time and historical contexts. On live bars, it dynamically updates the key levels to provide an evolving view of current price positioning. Simultaneously, it supports the display of historical levels for past sessions, enabling robust backtesting and comparative analysis of price behavior relative to previous quadrant structures.
Ultimately, this tool serves as a positional map, helping traders assess where price is trading relative to significant levels from the prior session, offering insights into potential support/resistance, overextension, or mean reversion scenarios.
Key Technical Features
Multi-Timeframe Support:
request.security() is used to pull data from a user-defined higher timeframe regardless of the current chart interval.
Visual Flexibility:
Toggle between "line" and "channel" mode.
Line color, width, and visibility are all user-controlled.
Anchoring Options:
Deviation levels can be calculated from either the previous period's open or its EQ (midpoint), giving flexibility depending on analytical preference.
Efficient Labeling:
Labels are only rendered on the last bar and are automatically cleared and redrawn to prevent duplication.
Label style, size, text color, and background color are all user-configurable.
Trading Application
This indicator is especially suited for:
1. Mean Reversion Strategies
When price moves beyond +1.0 or +1.5 deviations from the EQ or open, it may signal overextension and a potential snap back to the midpoint or range.
2. Breakout Confirmation
Sustained price action beyond ±1.0 levels may indicate trend strength or continuation beyond historical balance zones.
3. Contextual Range Awareness
EQ and Open provide structure from which traders can judge whether price is in a state of balance or imbalance.
Labels offer at-a-glance interpretation of key levels across any chosen timeframe.
4. Fractal and Multi-Session Analysis
Analysts can layer daily, weekly, and monthly versions of this indicator to observe confluence or divergence of higher timeframe structure.

Moving Average ExponentialThis indicator plots 8 Exponential Moving Averages (EMAs) with customizable lengths: 20, 25, 30, 35, 40, 45, 50, and 55. It also includes optional smoothing using various moving average types (SMA, EMA, WMA, etc.) and an optional Bollinger Bands overlay based on the EMA. It helps identify trend direction, momentum, and potential reversal zones.

Boomerang Trading Indicator# Boomerang News Trading Indicator
## Overview
The Boomerang Trading Indicator is designed to identify potential reversal opportunities following major economic news releases. This indicator analyzes the initial market reaction to news events and provides visual cues for potential counter-trend trading opportunities based on Fibonacci retracement levels.
## How It Works
### News Event Detection
- Automatically detects major news release times (NFP, CPI, FOMC, etc.)
- Analyzes the first significant price movement following news releases
- Requires minimum candle size threshold to filter out weak reactions
### First Move Analysis
The indicator employs multiple analytical methods to determine the initial market direction:
**Simple Analysis (High Confidence):**
- When the news candle has ≥70% body-to-total ratio, uses straightforward bullish/bearish classification
**Advanced Analysis (Complex Cases):**
- Volume-weighted direction analysis
- Momentum and wick pattern analysis
- Market structure and gap analysis
- Weighted voting system combining all methods
### Entry Signal Generation
Based on the "boomerang" concept where markets often reverse after initial news reactions:
**For Bullish First Moves (Price Up Initially):**
- Generates SHORT entry signals when price retraces to 1.25-1.5 Fibonacci levels
- Visual: Red triangles above price bars
**For Bearish First Moves (Price Down Initially):**
- Generates LONG entry signals when price retraces to -0.25 to -0.5 Fibonacci levels
- Visual: Green triangles below price bars
## Key Features
### Visual Elements
- **Fibonacci Levels**: Displays key retracement levels based on the initial reaction range
- **Entry Zones**: Clear visual marking of optimal entry areas
- **Direction Arrows**: Shows the initial market reaction direction
- **Target Levels**: Displays profit target zones at 50% and 100% retracement levels
### Information Panel
Real-time display showing:
- Current setup status
- First move direction and body percentage
- Recommended trade direction
- Key price levels (reaction high/low)
- Profit targets with historical success rates
### Alert System
- Pre-news warnings (customizable timing)
- News event notifications
- Setup activation alerts
- Entry signal notifications
### Success Tracking
- Visual "BOOM!" animations when targets are hit
- Target 1 (50% level): ~95% historical success rate
- Target 2 (Main target): ~80% historical success rate
## Configuration Options
### Time Settings
- News release hour and minute (customizable for different events)
- Pre-news alert timing
- Setup duration (default 60 bars after news)
### Fibonacci Levels
- Adjustable retracement percentages
- Customizable target levels
- Mid-level importance weighting
### Risk Management
- Minimum reaction candle size filter
- Maximum risk point setting
- Visual risk/reward display
### Display Options
- Toggle Fibonacci level visibility
- Toggle target level display
- Toggle animation effects
- Customizable alert preferences
## Applicable News Events
This indicator is designed for high-impact economic releases:
- Non-Farm Payrolls (NFP) - First Friday, 8:30 AM ET
- Consumer Price Index (CPI) - Monthly, 8:30 AM ET
- Producer Price Index (PPI) - Monthly, 8:30 AM ET
- Gross Domestic Product (GDP) - Quarterly, 8:30 AM ET
- FOMC Interest Rate Decisions - 8 times yearly, 2:00 PM ET
## Trading Strategy Framework
### Core Principle
Markets often overreact to news initially, then reverse toward more rational price levels. This "boomerang effect" creates short-term trading opportunities.
### Entry Strategy
1. Wait for significant initial reaction (>10 points minimum)
2. Identify the initial direction using multi-factor analysis
3. Trade opposite to the initial reaction when price reaches sweet spot zones
4. Use Fibonacci retracement levels as entry triggers
### Risk Management
- Always use appropriate position sizing
- Set stop losses beyond recent swing levels
- Consider market volatility and news importance
- Monitor for setup invalidation signals
## Important Notes
### Educational Purpose
This indicator is for educational and analytical purposes. Users should:
- Thoroughly test strategies in demo environments
- Understand the risks involved in news trading
- Consider market conditions and volatility
- Use proper risk management techniques
### Market Considerations
- High volatility during news events increases both opportunity and risk
- Spreads may widen significantly during news releases
- Different brokers may have varying execution conditions
- Economic calendar timing may vary between sources
### Limitations
- Past performance does not guarantee future results
- Market conditions can change, affecting strategy effectiveness
- News events may have unexpected outcomes affecting normal patterns
- Technical analysis should be combined with fundamental analysis
## Version Information
- Compatible with TradingView Pine Script v5
- Designed for 1-minute timeframe optimal performance
- Works on major forex pairs, indices, and commodities
- Regular updates based on market condition changes
---
**Disclaimer:** This indicator is provided for educational purposes only. Trading involves substantial risk and is not suitable for all investors. Past performance is not indicative of future results. Users should conduct their own research and consider their financial situation before making trading decisions.


unprofitable stratThe indicator is a comprehensive trend-following indicator for TradingView. It's designed to identify and trade in the direction of the market's primary trend while using a dynamic, volatility-based system for exits. It filters out counter-trend noise and provides a clear visual dashboard of market conditions.
Core Trading Strategy
The indicator's logic is based on a two-part confirmation system to ensure trades are only taken in favorable conditions.
Master Trend Filter: The indicator first determines the "master trend" by checking if the price is above or below a long-term (200-period) Exponential Moving Average (EMA). It will only look for BUY signals when the price is above this EMA (in a master bullish trend) and only look for SELL signals when the price is below it. This prevents fighting the main market current.
Entry Trigger: Once the master trend is confirmed, the indicator doesn't enter immediately. It waits for a secondary confirmation: a breakout above a recent swing high (for a BUY) or a breakdown below a recent swing low. This ensures that short-term momentum has aligned with the long-term trend before a signal is generated.
Dynamic Exit Strategy
Exits are not based on a fixed target. Instead, the indicator uses a professional-grade ATR-based Trailing Stop Loss.
This "smart" stop loss automatically trails behind a profitable trade. It moves up to lock in gains during a BUY trade but never moves down.
The distance of the stop from the price is determined by the Average True Range (ATR), meaning it gives the trade more room to breathe in volatile markets and tightens up to protect profits in calm markets.
An "EXIT" signal appears on the chart when the price finally pulls back and hits this trailing stop line.
Visual Features on the Chart
The indicator provides several visual aids to make the trading process clear and intuitive.
Custom-Plotted Candles: The indicator draws its own candlesticks that are colored based on the trade status:
Blue: An active BUY trade is in progress.
Purple: An active SELL trade is in progress.
Gray: The indicator is flat with no active trade.
Signal Labels: Clear "BUY", "SELL", and "EXIT" labels are plotted directly on the chart at the moment they occur.
Trailing Stop Line: A bright orange line appears and follows the price during a trade, showing you the exact level of your trailing stop loss.
Multi-Timeframe Table: An optional dashboard in the top-right corner displays the master trend status ("Bullish" or "Bearish") on the 1m, 5m, 15m, 1-hour, and 4-hour timeframes simultaneously.
Trend Background: An optional feature allows you to color the entire chart background light blue or purple to match the master trend direction.

JG | RSI Overbought/OversoldRSI Overbought/Oversold Indicator
Shows backgrounds for each condition and allows alerts as well.
Enjoy ^-^

🚀 Kapsamlı Kripto Teknik Analizkta fib crt göstergesi crt bölgesi beyaz mum ile belirtilmiş fib seviyeleri otomatik yeniler

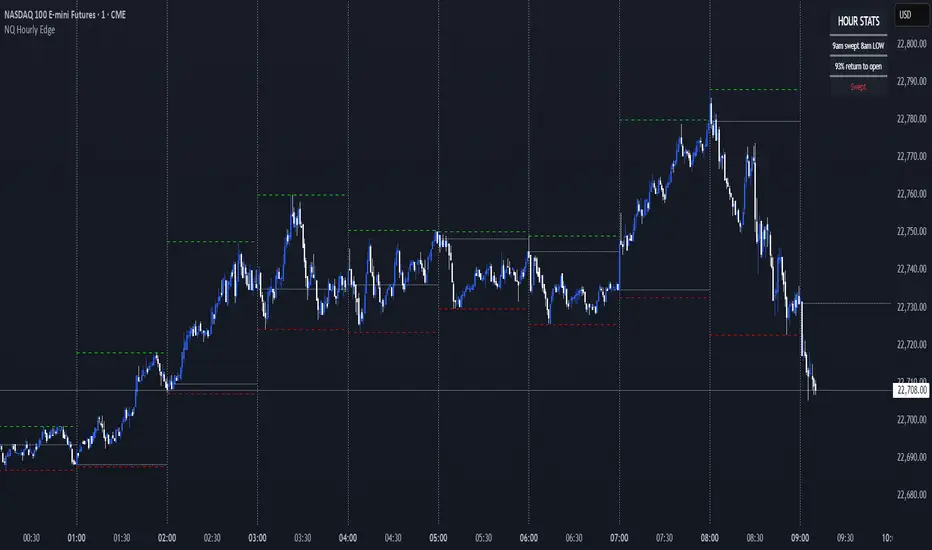
NQ Hourly Edge (By Scalpr)📊 Hourly Edge (Lorden) - Statistical Trading Edge Indicator
Transform your NQ1! trading with data-driven hourly analysis and high-probability setups based on extensive backtesting.
🎯 What This Indicator Does
The Hourly Edge indicator identifies high-probability "return to open" scenarios during the New York trading session (8am-4pm ET) specifically for NQ1! (Nasdaq futures). When the current hour opens inside the previous hour's range and then sweeps the previous high or low, statistical data shows strong probabilities of price returning to the hourly open.
📈 Key Features
Statistical Edge Detection
Real-time sweep detection with tick-by-tick accuracy
Probability percentages based on extensive NQ1! backtesting data
Color-coded probability levels: Green (75%+), Yellow (51-74%), Red (<50%)
Status tracking: Waiting → Swept → Returned
Visual Trading Tools
Hourly/Custom interval lines with full customization
High/Low tracking with optional current hour hiding
Opening price reference lines
Configurable line styles, colors, and widths
Smart Session Management
NY timezone awareness (8am-4pm ET focus)
"Waiting for 8am" display outside trading hours
20-minute segment analysis for refined probability calculations
🔧 Customization Options
Timeframe Flexibility
Multiple preset intervals: 4H, 1H, 30m, 15m, 10m, 5m
Custom timeframe input (hours + minutes)
Works on any chart timeframe
Display Controls
Show/hide any line type independently
Moveable info box (4 corner positions)
Adjustable text sizes
Historical line limit (1-500 bars)
Line Styling
Individual color settings for each line type
Style options: Solid, Dashed, Dotted
Width control: 1, 2, or 3 pixels
📊 How to Use
Add to NQ1! charts during NY session hours
Watch for sweep notifications in the info box
Check probability percentages for trade confidence
Monitor return status for entry/exit timing
Use alerts for high-probability setups (75%+ edge)
⚡ Best Practices
Optimal timeframes: 1m-15m for entries, 1H for context
Focus on 75%+ probability setups for highest edge
Wait for "moved away from open" confirmation before expecting returns
Combine with your existing NQ1! strategy for enhanced timing
🎯 Perfect For
NQ1! scalpers seeking high-probability entries
Nasdaq day traders wanting statistical edge confirmation
Futures strategy developers incorporating hourly analysis
Risk managers looking for data-driven NQ1! setups
Price Density Strategy ScoreBased on the rules we defined, a composite score (-3 to +3) is calculated and displayed as colored bars below the chart:
Dark green (+3): Strong buy signal
Light green (+1, +2): Mildly bullish
Gray (0): Neutral
Light red (-1, -2): Mildly bearish
Dark red (-3): Strong sell signal
根据我们定义的规则,计算一个综合分数(-3 到 +3),并在图表下方用不同颜色的柱状图显示出来:
深绿色 (+3):强力买入信号
浅绿色 (+1, +2):温和看涨
灰色 (0):中性
浅红色 (-1, -2):温和看跌
深红色 (-3):强力卖出信号


BanShen MACD Ultimate[SpeculationLab]🧠 BanShen MACD Ultimate – Public Edition by SpeculationLab
这是 BanShen MACD 系统的公开版,一个完全从零开发的多信号综合技术分析工具包。
它融合了多个高级模块,帮助交易者实时识别关键的进出场位置和趋势动能。
✅ 内置核心模块:
MACD 背离识别
(支持基础背离和连续波峰/波谷背离识别)
RSI 背离信号模块
OBV 背离信号模块
Vegas 隧道趋势过滤器
吞没形态识别(Engulfing Pattern)
基于 ATR 的动态止损线系统
FVG(公平价值缺口)自动识别与绘制
多模块动态信号表格
自定义水印(图表品牌展示)
🔎 想要更轻量的版本?
可以尝试 **半神MACD究极指标 ** —— 极简设计,移动端也能流畅运行。
🚀 需要更高级的功能?
**BanShen MACD Pro** 即将推出,包含:
✅ Order Block 标记模块
✅ 未填补 CME 缺口(Unfilled Gaps)探测器
✅ 主力大单跟踪(Whale Order Tracker)
欢迎关注我以获得优先体验!
📬 加入我的 Telegram 群获取更多更新信息: (t.me)
=========================
This is the **Public Edition** of the BanShen MACD system — a fully integrated, multi-signal technical analysis toolkit developed entirely from scratch.
It combines multiple advanced modules to help traders identify key entry/exit zones and trend momentum in real time.
✅ Core Modules Included:
- MACD Divergence Detection
(Supports both basic and consecutive peak detection)
- **RSI Divergence Signal Module**
- **OBV Divergence Signal Module**
- **Vegas Tunnel Trend Filter**
- **Engulfing Pattern**
- **ATR-Based Dynamic Stop Loss Finder**
- **FVG (Fair Value Gap) Auto Detection & Plotting**
- **Smart Signal Table** showing multi-module output
- **Custom Watermark** for chart branding
🔎 Looking for a lighter version?
Try **BanShen MACD Basic** – minimal and mobile-friendly.
🚀 Want even more features?
**BanShen MACD Pro** is coming soon, featuring:
- Order Block Detection
- Unfilled CME Gap Finder
- Whale Order Tracker
Follow for early access!
📬 Join my Telegram for more updates: (t.me)
=========================
⚠️ **免责声明 / Disclaimer / 免責事項**
本脚本仅供学习与参考用途,所有交易行为风险自负。作者不对任何因使用本指标而产生的损失负责。本指标中的所有逻辑均为原创,未经许可,禁止复制、转载或商用。
This script is for educational and informational purposes only. All trading decisions are made at your own risk. The author is not responsible for any financial losses resulting from the use of this indicator. All code is original. Redistribution, resale, or reproduction without permission is strictly prohibited.
このスクリプトは学習および情報提供のみを目的としています。すべての取引は自己責任で行ってください。本インジケーターの使用による損失について、作者は一切の責任を負いません。コードはすべてオリジナルであり、無断転載、再配布、商用利用は禁止されています。

Step 1: Draw Thursday HighScript Description: Thursday High Marker
This is an automated charting tool designed to identify the high of each Thursday and display it as a key reference level for future trading sessions.
Core Functionality:
The script's logic is simple and precise. It waits for the trading session on Thursday to complete. At the very beginning of Friday, it looks back, finds the highest price from Thursday, and draws a clean, white horizontal line at that level.
Key Features:
Automatic: You don't need to do anything. The script finds and draws the level on its own every week.
Forward-Looking: The line extends to the right indefinitely, allowing you to see how future price action interacts with this key level.
Self-Cleaning: To keep your chart uncluttered, the script automatically deletes the previous week's line when it draws the new one.
Lightweight: It performs a single, simple task, so it doesn't slow down your chart.
Purpose in Trading:
Traders use this kind of indicator to track significant weekly price points. The high of a late-week session like Thursday is often considered an important liquidity level. A break above this line can signal bullish strength or a "liquidity sweep," making it a valuable point of interest for making trading decisions on Friday and into the following week.

JS Elite XAUUSD Scalper v1.0📈 Elite XAUUSD Scalper v1.0 – A Premium Scalping Strategy for Gold
The Elite XAUUSD Scalper v1.0 is a high-performance scalping strategy designed to capture quick price movements in the XAUUSD (Gold) market. Built with precision and optimized for intraday trading, this strategy uses a combination of Fast & Slow EMAs, ATR (Average True Range), and advanced Order Block & Liquidity Sweep logic to identify profitable opportunities in real-time.
Key Features:
Multiple Confluences: The strategy utilizes the HTF Trend Filter, RSI, Volume Analysis, and Order Blocks to ensure that trades are placed with the highest probability of success.
Real-time Entry & Exit Signals: Automated long and short entries with Take-Profit (TP), Stop-Loss (SL), and Partial TP levels for precise risk management.
Trailing Stop: Automatically trails stop-loss to lock in profits as the price moves in your favor, ensuring that you can ride the trend while protecting your gains.
Alerts: Get notified of long and short signals in real-time via TradingView alerts. Never miss a trade!
Strategy Logic:
Trend Filter: The strategy incorporates a higher time-frame (HTF) trend filter, which ensures that trades are taken only in the direction of the overall trend.
Scalping Precision: The Fast EMA (4) and Slow EMA (14) ensure timely entry and exit points, while the ATR (2) adds an extra layer of risk management, ensuring your stops are intelligently placed.
Risk-to-Reward: Set to a 2:1 reward-to-risk ratio, with an option for partial take-profit at 1.2x RR, allowing you to lock in gains while letting the trade run.
Order Block & Liquidity Sweep: Identifies price levels with high institutional interest, ensuring your trades align with market liquidity.
Ideal For:
Intraday Traders: This strategy is perfect for traders looking to capitalize on fast, small price movements in XAUUSD (Gold).
Scalpers & Swing Traders: It’s designed to handle quick moves while minimizing drawdown and securing profits during market swings.
Why Choose Elite XAUUSD Scalper v1.0?
Customizable: Adjust the strategy's risk parameters, trailing stop, and partial TP to suit your trading style and risk tolerance.
Highly Accurate: Combining the Fast & Slow EMAs, ATR, and order block logic, this strategy increases the accuracy of your trades, helping you stay ahead of market movements.
Automated: Set it and forget it — the strategy takes care of entries, exits, and risk management, freeing you to focus on other markets or activities.
🚀 Start Trading with Elite XAUUSD Scalper v1.0 Today!
Unlock the power of high-frequency scalping with the Elite XAUUSD Scalper v1.0. Get access to the strategy and start trading smarter today.
💬 Disclaimer
This strategy is for educational purposes only. Past performance is not indicative of future results. Use this strategy at your own risk and ensure that you fully understand its features and risks before trading with real capital.
🎯 Ready to Take Your Trading to the Next Level?
Access the strategy via Invite-Only access on TradingView
Enjoy personalized, automated, and highly accurate signals that can boost your trading potential
Start making consistent profits with a professional trading approach

Agni cpr IndicatorsMulti tf cpr
camarilla
pdh+r1 colour coding
sma ema
tomorrow cpr
Apr 7
Release Notes
some features
Apr 22
Release Notes
Added n some features
Apr 23
Release Notes
line editing

Agni crypto MAGICAL Indicatorsvery useful for crypto and indian market
can use dynamic fib
cpr 360,720 W,M,D
EMA

半神MACD究极指标[Speculation Lab]// 加入我们的 Telegram 群组,与其他交易员一起讨论此脚本的使用方法和策略优化建议( t.me/+iZZx-_OY9YM5MmJl ) (微信群组:toujixiaozhushou)
//Join our Telegram group to discuss the usage of this script and share strategy optimization tips with other traders.( t.me/+iZZx-_OY9YM5MmJl )
//本脚本源自此前的仅限邀请指标,已对部分功能进行简化,以便公开使用。所有代码均为本人原创开发。
//This script is derived from my invite-only indicator, with simplified features for public use. All code is original and developed by @SpeculationLab.
📌 **免责声明**
- 本指标仅供**教育和信息参考**,不构成任何投资建议。
- 本指标不应被视为**买卖任何金融工具的要约、招揽或推荐**。
- 交易涉及**重大风险**,过去的表现**不能保证未来收益**。
- 指标开发者和发布者**不对任何交易损失、财务损害或因使用本指标而产生的任何后果负责**。
- 使用者应自行进行**充分的市场调研和风险评估**,并在做出投资决策前咨询**持牌金融专业人士**。
- **使用本指标即代表您已知晓并接受,所有交易和投资行为由您自行承担责任**。
📌 **Disclaimer:**
- This indicator is provided for **educational and informational purposes only** and should not be considered financial advice.
- It does not constitute **an offer, solicitation, or recommendation** to buy or sell any financial instruments.
- Trading in financial markets involves **significant risk**, and past performance does **not guarantee future results**.
- The developer and publisher **do not assume any responsibility** for trading losses, financial damages, or any consequences resulting from the use of this indicator.
- Users should conduct their own due diligence and consult a **licensed financial professional** before making any investment decisions.
- By using this indicator, you acknowledge and accept that you are solely responsible for your trading and investment activities.
📌 **免責事項**
- 本インジケーターは**教育および情報提供のみを目的としており**、投資アドバイスを提供するものではありません。
- 本インジケーターは**金融商品の売買を推奨または勧誘するものではありません**。
- 取引には**重大なリスク**が伴い、過去のパフォーマンスは**将来の成果を保証するものではありません**。
- 開発者および提供者は、**本インジケーターの使用による取引損失、財務的損害、またはその他の結果について一切の責任を負いません**。
- ユーザーは、**投資判断を行う前に十分な市場調査とリスク評価を行い、必要に応じて** **ライセンスを持つ金融専門家に相談してください**。
- **本インジケーターを使用することにより、すべての取引および投資活動について自己責任であることを理解し、同意したものとみなされます。**

Multi Horizontal Lines 1000 Bars
This indicator is not my code, I have copied this from another user and extened the lines so they go back 1000 bars for back testing.
I use this indicator to trade Crude Oil and set the horizontal lines to 20 cents increments, 0.2 is 20 cents. You can change the horizontal lines to any price distance to suit your style of trading.
My idea is when price crosses over a horizontal line I will enter a trade long or short looking to secure 20 cents.
