9 EMA Angle Color Indicator//@version=5
indicator("9 EMA Angle Color Indicator", overlay=true)
// === INPUTS ===
emaLength = input.int(9, title="EMA Length")
angleThreshold = input.float(20.0, title="Angle Threshold (Degrees)", minval=0.1)
lookbackBars = input.int(5, title="Bars to Calculate Angle", minval=1)
// === EMA CALCULATION ===
emaValue = ta.ema(close, emaLength)
// === ANGLE CALCULATION (in degrees) ===
// Use simple slope * 100 and arc tangent conversion to degrees
slope = (emaValue - emaValue ) / lookbackBars
angle = math.atan(slope) * (180 / math.pi)
// === COLOR LOGIC ===
var color emaColor = color.black
// Initial color: black when angle is within range
emaColor := color.black
// Price and angle-based color change
if angle > angleThreshold and close > emaValue
emaColor := color.green
else if angle < -angleThreshold and close < emaValue
emaColor := color.red
else
emaColor := color.black
// === PLOT EMA ===
plot(emaValue, color=emaColor, linewidth=2, title="9 EMA Colored")
Chart patterns

DIP BUYING by HAZEREAL BUY THE DIP - Educational Price Movement Indicator
This technical indicator is designed for educational purposes to help traders identify potential price reversal opportunities in equity markets, particularly focusing on NASDAQ-100 index tracking instruments and technology sector ETFs.
Key Features:
Monitors price movements relative to recent highs over customizable lookback periods
Identifies two distinct price decline thresholds: standard (5%+) and extreme (12.3%+)
Visual signals with triangular markers and background color zones
Real-time data table showing current metrics and status
Customizable alert system with webhook-ready JSON formatting
Clean overlay design that doesn't obstruct price action
How It Works:
The indicator tracks the highest price within a specified lookback period and calculates the percentage decline from that high. When price drops below the minimum threshold, it generates visual buy signals. The extreme threshold triggers enhanced alerts for more significant market movements.
Best Use Cases:
Educational analysis of market volatility patterns
Identifying potential support levels during market corrections
Studying historical price behavior around significant declines
Risk management and position sizing education
Important Note: This is a technical analysis tool for educational purposes only. All trading decisions should be based on comprehensive analysis and appropriate risk management. Past performance does not guarantee future results.

我的策略
The specific implementation of the dominant_cycle function needs to be done using ta.ht_dominant_cycle_period or by calculating the rate of change of the phase, which requires detailed technical processing in actual coding.
How to use the "Market Mathieu Oscillator":
• Green background (stable zone): The market is likely to be in a consolidation or mean reversion state. Trend strategies are riskier, while range trading or option seller strategies may be more dominant.
• Yellow background (warning zone): The market has entered a "flammable" state where resonance may occur. Counter-trend trading should be reduced, and preparations for potential breakthroughs should be started, tightening stops.
• Red background (unstable/resonance zone): **Highest alert! ** This shows that the market is not only "flammable", but also has a "spark" (strong driving force). This is the stage where the trend is most likely to accelerate and sustain itself. Counter-trend operations should be strictly avoided, and trend-following strategies should be actively adopted.
• Q Oscillator:
• The rising q value means that emotions are moving to extremes and the "fuel" of the trend is increasing.
• The q-value is falling, indicating that sentiment is returning to neutrality and the "fuel" of the trend is decreasing, which may indicate the exhaustion of the trend or the beginning of consolidation.
• When the q-value exceeds the red threshold line, it indicates that the driving force is extremely strong, which is one of the necessary conditions for entering the red background.
The "Market Mathieu Oscillator" is an innovative attempt to transform a profound physical and financial theory into an intuitive decision-making aid available on TradingView through a proxy and simplified approach. It cannot make precise quantitative predictions like theoretical models, but it provides a whole new dimension to observe the market: it no longer focuses solely on the price itself, but on the relationship between the "force" that drives the price and the "rhythm" of the market itself. Through this lens, traders can better understand when the market may turn from stability to turbulence, and make more strategic decisions.

Momentum SNR VIP [3 TP + Max 50 Pip SL]//@version=6
indicator("Momentum SNR VIP ", overlay=true)
// === Settings ===
pip = input.float(0.0001, "Pip Size", step=0.0001)
sl_pip = 50 * pip
tp1_pip = 40 * pip
tp2_pip = 70 * pip
tp3_pip = 100 * pip
lookback = input.int(20, "Lookback for S/R", minval=5)
// === SNR ===
pivotHigh = ta.pivothigh(high, lookback, lookback)
pivotLow = ta.pivotlow(low, lookback, lookback)
supportZone = not na(pivotLow)
resistanceZone = not na(pivotHigh)
plotshape(supportZone, title="Support", location=location.belowbar, color=color.blue, style=shape.triangleup, size=size.tiny)
plotshape(resistanceZone, title="Resistance", location=location.abovebar, color=color.red, style=shape.triangledown, size=size.tiny)
// === Price Action ===
bullishEngulfing = close < open and close > open and close > open and open <= close
bearishEngulfing = close > open and close < open and close < open and open >= close
bullishPinBar = close < open and (low - math.min(open, close)) > 1.5 * math.abs(close - open)
bearishPinBar = close > open and (high - math.max(open, close)) > 1.5 * math.abs(close - open)
buySignal = supportZone and (bullishEngulfing or bullishPinBar)
sellSignal = resistanceZone and (bearishEngulfing or bearishPinBar)
// === SL & TP ===
rawBuySL = low - 10 * pip
buySL = math.max(close - sl_pip, rawBuySL)
buyTP1 = close + tp1_pip
buyTP2 = close + tp2_pip
buyTP3 = close + tp3_pip
rawSellSL = high + 10 * pip
sellSL = math.min(close + sl_pip, rawSellSL)
sellTP1 = close - tp1_pip
sellTP2 = close - tp2_pip
sellTP3 = close - tp3_pip
// === Plot Lines ===
plot(buySignal ? buySL : na, title="Buy SL", color=color.red, style=plot.style_line, linewidth=1)
plot(buySignal ? buyTP1 : na, title="Buy TP1", color=color.green, style=plot.style_line, linewidth=1)
plot(buySignal ? buyTP2 : na, title="Buy TP2", color=color.green, style=plot.style_line, linewidth=1)
plot(buySignal ? buyTP3 : na, title="Buy TP3", color=color.green, style=plot.style_line, linewidth=1)
plot(sellSignal ? sellSL : na, title="Sell SL", color=color.red, style=plot.style_line, linewidth=1)
plot(sellSignal ? sellTP1 : na, title="Sell TP1", color=color.green, style=plot.style_line, linewidth=1)
plot(sellSignal ? sellTP2 : na, title="Sell TP2", color=color.green, style=plot.style_line, linewidth=1)
plot(sellSignal ? sellTP3 : na, title="Sell TP3", color=color.green, style=plot.style_line, linewidth=1)
// === Floating Labels on Right Side ===
if buySignal
label.new(x=bar_index + 50, y=buySL, text="SL", style=label.style_label_right, color=color.red, textcolor=color.white)
label.new(x=bar_index + 50, y=buyTP1, text="TP1", style=label.style_label_right, color=color.green, textcolor=color.white)
label.new(x=bar_index + 50, y=buyTP2, text="TP2", style=label.style_label_right, color=color.green, textcolor=color.white)
label.new(x=bar_index + 50, y=buyTP3, text="TP3", style=label.style_label_right, color=color.green, textcolor=color.white)
if sellSignal
label.new(x=bar_index + 50, y=sellSL, text="SL", style=label.style_label_right, color=color.red, textcolor=color.white)
label.new(x=bar_index + 50, y=sellTP1, text="TP1", style=label.style_label_right, color=color.green, textcolor=color.white)
label.new(x=bar_index + 50, y=sellTP2, text="TP2", style=label.style_label_right, color=color.green, textcolor=color.white)
label.new(x=bar_index + 50, y=sellTP3, text="TP3", style=label.style_label_right, color=color.green, textcolor=color.white)
// === Signal Markers ===
plotshape(buySignal, title="Buy Signal", location=location.belowbar, color=color.green, style=shape.labelup, text="BUY")
plotshape(sellSignal, title="Sell Signal", location=location.abovebar, color=color.red, style=shape.labeldown, text="SELL")
// === Alerts ===
alertcondition(buySignal, title="Buy Alert", message="🟢 BUY at Support Zone + Price Action")
alertcondition(sellSignal, title="Sell Alert", message="🟡 SELL at Resistance Zone + Price Action")


Momentum SNR VIP (Step 2)//@version=6
indicator("Momentum SNR VIP (Step 2)", overlay=true)
// === Inputs ===
lookback = input.int(20, "Lookback for S/R", minval=5)
rr_ratio = input.float(2.0, "Risk-Reward Ratio", minval=0.5, step=0.1)
plot(close, color=color.orange)

TVI-3 Z-Score: MA + VWAP + BB Composite🔧 Overview:
It combines:
Z-score of price relative to the 200-period simple moving average (MA)
Z-score of price relative to the 200-period VWAP (volume-weighted average price)
Z-score of Bollinger Band width
The result is an average of these three Z-scores, plotted as a composite indicator for identifying overvalued and undervalued conditions.

Nến Tô Màu Theo Volume / MA(21)Condition
Point color
Volume ≥ 3× MA(24)
Violet
Volume ≥ 1.5× MA(24)
Red
Volume < 1.5× MA(24) & bullish
White
Volume < 1.5× MA(24) & bearish
Black


Momentum SNR VIP [3 TP + Max 50 Pip SL]//@version=6
indicator("Momentum SNR VIP ", overlay=true)
// === Settings ===
pip = input.float(0.0001, "Pip Size", step=0.0001)
sl_pip = 50 * pip
tp1_pip = 40 * pip
tp2_pip = 70 * pip
tp3_pip = 100 * pip
lookback = input.int(20, "Lookback for S/R", minval=5)
// === SNR ===
pivotHigh = ta.pivothigh(high, lookback, lookback)
pivotLow = ta.pivotlow(low, lookback, lookback)
supportZone = not na(pivotLow)
resistanceZone = not na(pivotHigh)
plotshape(supportZone, title="Support", location=location.belowbar, color=color.blue, style=shape.triangleup, size=size.tiny)
plotshape(resistanceZone, title="Resistance", location=location.abovebar, color=color.red, style=shape.triangledown, size=size.tiny)
// === Price Action ===
bullishEngulfing = close < open and close > open and close > open and open <= close
bearishEngulfing = close > open and close < open and close < open and open >= close
bullishPinBar = close < open and (low - math.min(open, close)) > 1.5 * math.abs(close - open)
bearishPinBar = close > open and (high - math.max(open, close)) > 1.5 * math.abs(close - open)
buySignal = supportZone and (bullishEngulfing or bullishPinBar)
sellSignal = resistanceZone and (bearishEngulfing or bearishPinBar)
// === SL & TP ===
rawBuySL = low - 10 * pip
buySL = math.max(close - sl_pip, rawBuySL)
buyTP1 = close + tp1_pip
buyTP2 = close + tp2_pip
buyTP3 = close + tp3_pip
rawSellSL = high + 10 * pip
sellSL = math.min(close + sl_pip, rawSellSL)
sellTP1 = close - tp1_pip
sellTP2 = close - tp2_pip
sellTP3 = close - tp3_pip
// === Plot Buy/Sell Signal
plotshape(buySignal, title="Buy Signal", location=location.belowbar, color=color.green, style=shape.labelup, text="BUY")
plotshape(sellSignal, title="Sell Signal", location=location.abovebar, color=color.red, style=shape.labeldown, text="SELL")
// === Plot SL & TP lines
plot(buySignal ? buySL : na, title="Buy SL", color=color.red, style=plot.style_linebr, linewidth=1)
plot(buySignal ? buyTP1 : na, title="Buy TP1", color=color.green, style=plot.style_linebr, linewidth=1)
plot(buySignal ? buyTP2 : na, title="Buy TP2", color=color.green, style=plot.style_linebr, linewidth=1)
plot(buySignal ? buyTP3 : na, title="Buy TP3", color=color.green, style=plot.style_linebr, linewidth=1)
plot(sellSignal ? sellSL : na, title="Sell SL", color=color.red, style=plot.style_linebr, linewidth=1)
plot(sellSignal ? sellTP1 : na, title="Sell TP1", color=color.green, style=plot.style_linebr, linewidth=1)
plot(sellSignal ? sellTP2 : na, title="Sell TP2", color=color.green, style=plot.style_linebr, linewidth=1)
plot(sellSignal ? sellTP3 : na, title="Sell TP3", color=color.green, style=plot.style_linebr, linewidth=1)
// === Labels
if buySignal
label.new(x=bar_index, y=buySL, text="SL : " + str.tostring(buySL, "#.0000"), style=label.style_label_down, color=color.red, textcolor=color.white)
label.new(x=bar_index, y=buyTP1, text="TP1 : " + str.tostring(buyTP1, "#.0000"), style=label.style_label_up, color=color.green, textcolor=color.white)
label.new(x=bar_index, y=buyTP2, text="TP2 : " + str.tostring(buyTP2, "#.0000"), style=label.style_label_up, color=color.green, textcolor=color.white)
label.new(x=bar_index, y=buyTP3, text="TP3 : " + str.tostring(buyTP3, "#.0000"), style=label.style_label_up, color=color.green, textcolor=color.white)
if sellSignal
label.new(x=bar_index, y=sellSL, text="SL : " + str.tostring(sellSL, "#.0000"), style=label.style_label_up, color=color.red, textcolor=color.white)
label.new(x=bar_index, y=sellTP1, text="TP1 : " + str.tostring(sellTP1, "#.0000"), style=label.style_label_down, color=color.green, textcolor=color.white)
label.new(x=bar_index, y=sellTP2, text="TP2 : " + str.tostring(sellTP2, "#.0000"), style=label.style_label_down, color=color.green, textcolor=color.white)
label.new(x=bar_index, y=sellTP3, text="TP3 : " + str.tostring(sellTP3, "#.0000"), style=label.style_label_down, color=color.green, textcolor=color.white)
// === Alerts
alertcondition(buySignal, title="Buy Alert", message="🟢 BUY at Support Zone + Price Action")
alertcondition(sellSignal, title="Sell Alert", message="🟡 SELL at Resistance Zone + Price Action")

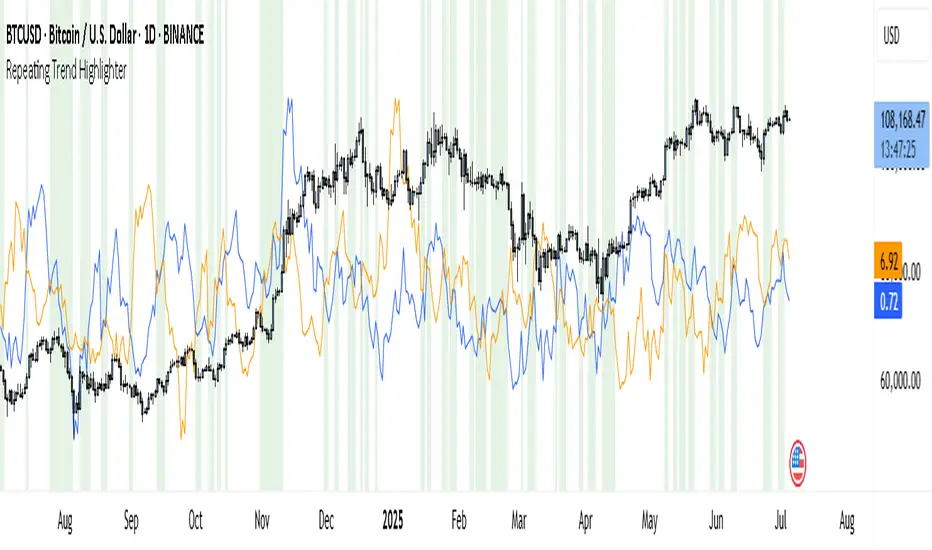
Repeating Trend HighlighterThis custom indicator helps you see when the current price trend is similar to a past trend over the same number of candles. Think of it like checking whether the market is repeating itself.
You choose three settings:
• Lookback Period: This is how many candles you want to measure. For example, if you set it to 10, it looks at the price change over the last 10 bars.
• Offset Bars Ago: This tells the indicator how far back in time to look for a similar move. If you set it to 50, it compares the current move to what happened 50 bars earlier.
• Tolerance (%): This is how closely the moves must match to be considered similar. A smaller number means you only get a signal if the moves are almost the same, while a larger number allows more flexibility.
When the current price move is close enough to the past move you picked, the background of your chart turns light green. This makes it easy to spot repeating trends without studying numbers manually.
You’ll also see two lines under your chart if you enable them: a blue line showing the percentage change of the current move and an orange line showing the change in the past move. These help you compare visually.
This tool is useful in several ways. You can use it to confirm your trading setups, for example if you suspect that a strong rally or pullback is happening again. You can also use it to filter trades by combining it with other indicators, so you only enter when trends repeat. Many traders use it as a learning tool, experimenting with different lookback periods and offsets to understand how often similar moves happen.
If you are a scalper working on short timeframes, you can set the lookback to a small number like 3–5 bars. Swing traders who prefer daily or weekly charts might use longer lookbacks like 20–30 bars.
Keep in mind that this indicator doesn’t guarantee price will move the same way again—it only shows similarity in how price changed over time. It works best when you use it together with other signals or market context.
In short, it’s like having a simple spotlight that tells you: “This move looks a lot like what happened before.” You can then decide if you want to act on that information.
If you’d like, I can help you tweak the settings or combine it with alerts so it notifies you when these patterns appear.
Range Bar Gaps DetectorRange Bar Gaps Detector
Overview
The Range Bar Gaps Detector identifies price gaps across multiple range bar sizes (12, 24, 60, and 120) on any trading instrument, helping traders spot potential support/resistance zones or breakout opportunities. Designed for Pine Script v6, this indicator detects gaps on range bars and exports data for use in companion scripts like Range Bar Gaps Overlap, making it ideal for multi-timeframe gap analysis.
Key Features
Multi-Range Gap Detection: Identifies gaps on 12, 24, 60, and 120-range bars, capturing both bullish (gap up) and bearish (gap down) price movements.
Customizable Sensitivity: Includes a user-defined minimum deviation (default: 10% of 14-period SMA) for 12-range gaps to filter out noise.
7-Day Lookback: Automatically prunes gaps older than 7 days to focus on recent, relevant price levels.
Data Export: Serializes up to 10 gaps per range (tops, bottoms, start bars, highest/lowest prices, and age) for seamless integration with overlap analysis scripts.
Debugging Support: Plots gap counts and aggregation data in the Data Window for easy verification of detected gaps.
How It Works
The indicator aggregates price movements to simulate higher range bars (24, 60, 120) from a base range bar chart. It detects gaps when the price jumps significantly between bars, ensuring gaps meet the minimum deviation threshold for 12-range bars. Gaps are stored in arrays, serialized for external use, and pruned after 7 days to maintain efficiency.
Usage
Add to your range bar chart (e.g., 12-range) to detect gaps across multiple ranges.
Use alongside the Range Bar Gaps Overlap indicator to visualize gaps and their overlaps as boxes on the chart.
Check the Data Window to confirm gap counts and sizes for each range (12, 24, 60, 120).
Adjust the "Minimal Deviation (%) for 12-Range" input to control gap detection sensitivity.
Settings
Minimal Deviation (%) for 12-Range: Set the minimum gap size for 12-range bars (default: 10% of 14-period SMA).
Range Sizes: Fixed at 24, 60, and 120 for higher range bar aggregation.
Notes
Ensure the script is published under your TradingView username (e.g., GreenArrow2005) for use with companion scripts.
Best used on range bar charts to maintain consistent gap detection.
For advanced overlap analysis, pair with the Range Bar Gaps Overlap indicator to highlight zones where gaps from different ranges align.
Ideal For
Traders seeking to identify key price levels for support/resistance or breakout strategies.
Multi-timeframe analysts combining gap data across various range bar sizes.
Developers building custom indicators that leverage gap data for advanced charting.

Normalized Reserve Risk (Proxy Z-Score)normalised version of the reserve risk indicator on btc magazine because the btc magazine one is poo .

My script//@version=5
indicator("MA + OI + Volume Breakout", overlay=true)
// === MA Parameters ===
ma_type = input.string("EMA", title="MA Type", options= )
ma(src, len, type) =>
type == "SMA" ? ta.sma(src, len) :
type == "EMA" ? ta.ema(src, len) :
ta.wma(src, len)
ma5 = ma(close, 5, ma_type)
ma21 = ma(close, 21, ma_type)
ma50 = ma(close, 50, ma_type)
ma100 = ma(close, 100, ma_type)
plot(ma5, "5-day MA", color=color.yellow, linewidth=2)
plot(ma21, "21-day MA", color=color.orange, linewidth=2)
plot(ma50, "50-day MA", color=color.fuchsia, linewidth=2)
plot(ma100, "100-day MA", color=color.blue, linewidth=2)
// === Trend Signal ===
bullish_trend = ma5 > ma21 and ma21 > ma50 and ma50 > ma100
bearish_trend = ma5 < ma21 and ma21 < ma50 and ma50 < ma100
bgcolor(bullish_trend ? color.new(color.green, 85) : bearish_trend ? color.new(color.red, 85) : na)
// === Volume Breakout ===
vol_avg = ta.sma(volume, 20)
vol_breakout = volume > 1.5 * vol_avg
plotshape(vol_breakout, title="Volume Breakout", location=location.belowbar, style=shape.circle, color=color.aqua, size=size.tiny)
// === Open Interest Overlay (assumes OI data via external input or future integration) ===
// Placeholder: simulate OI input (replace with `request.security(syminfo.tickerid, ..., ...)` if available)
oi = input.float(na, title="Open Interest (external feed)")
oi_avg = ta.sma(oi, 20)
oi_breakout = oi > 1.2 * oi_avg
plotshape(not na(oi) and oi_breakout, title="OI Spike", location=location.belowbar, style=shape.diamond, color=color.purple, size=size.tiny)
plot(oi, title="Open Interest", color=color.gray, display=display.none) // Optional: hidden line for alerts
// === Composite Signal ===
strong_long = bullish_trend and vol_breakout and oi_breakout
plotshape(strong_long, title="Strong Long Signal", location=location.belowbar, style=shape.labelup, text="LONG", size=size.small, color=color.lime)
// === Screener Logic ===
// Use `strong_long` as your filter condition in a screener or dashboard output

Previous 10 Weekly Highs/Lowsvbcsvbabvdvbnsvnsiavonvbdobvasvbjsdavbdsoajvbdjaovbajv bajv adsjkv jksdv jkav kjsdf

Momentum SNR VIP [INDICATOR ONLY]//@version=6
indicator("Momentum SNR VIP ", overlay=true)
// === Inputs ===
lookback = input.int(20, "Lookback for S/R", minval=5)
rr_ratio = input.float(2.0, "Risk-Reward Ratio", minval=0.5, step=0.1)
// === SNR Detection ===
pivotHigh = ta.pivothigh(high, lookback, lookback)
pivotLow = ta.pivotlow(low, lookback, lookback)
supportZone = not na(pivotLow)
resistanceZone = not na(pivotHigh)
plotshape(supportZone, title="Support", location=location.belowbar, color=color.blue, style=shape.triangleup, size=size.tiny)
plotshape(resistanceZone, title="Resistance", location=location.abovebar, color=color.red, style=shape.triangledown, size=size.tiny)
// === Price Action ===
bullishEngulfing = close < open and close > open and close > open and open <= close
bearishEngulfing = close > open and close < open and close < open and open >= close
bullishPinBar = close < open and (low - math.min(open, close)) > 1.5 * math.abs(close - open)
bearishPinBar = close > open and (high - math.max(open, close)) > 1.5 * math.abs(close - open)
buySignal = supportZone and (bullishEngulfing or bullishPinBar)
sellSignal = resistanceZone and (bearishEngulfing or bearishPinBar)
// === SL & TP ===
buySL = low - 10
buyTP = close + (close - buySL) * rr_ratio
sellSL = high + 10
sellTP = close - (sellSL - close) * rr_ratio
// === Plot Signals
plotshape(buySignal, title="Buy Signal", location=location.belowbar, color=color.green, style=shape.labelup, text="BUY")
plotshape(sellSignal, title="Sell Signal", location=location.abovebar, color=color.red, style=shape.labeldown, text="SELL")
plot(buySignal ? buySL : na, title="Buy SL", color=color.red, style=plot.style_linebr, linewidth=1)
plot(buySignal ? buyTP : na, title="Buy TP", color=color.green, style=plot.style_linebr, linewidth=1)
plot(sellSignal ? sellSL : na, title="Sell SL", color=color.red, style=plot.style_linebr, linewidth=1)
plot(sellSignal ? sellTP : na, title="Sell TP", color=color.green, style=plot.style_linebr, linewidth=1)
// === Labels (Fixed)
if buySignal
label.new(x=bar_index, y=buySL, text="SL : " + str.tostring(buySL, "#.00"), style=label.style_label_down, color=color.red, textcolor=color.white)
label.new(x=bar_index, y=buyTP, text="TP 1 : " + str.tostring(buyTP, "#.00"), style=label.style_label_up, color=color.green, textcolor=color.white)
if sellSignal
label.new(x=bar_index, y=sellSL, text="SL : " + str.tostring(sellSL, "#.00"), style=label.style_label_up, color=color.red, textcolor=color.white)
label.new(x=bar_index, y=sellTP, text="TP 1 : " + str.tostring(sellTP, "#.00"), style=label.style_label_down, color=color.green, textcolor=color.white)
// === Alerts
alertcondition(buySignal, title="Buy Alert", message="🟢 BUY at Support Zone + Price Action")
alertcondition(sellSignal, title="Sell Alert", message="🟡 SELL at Resistance Zone + Price Action")

CME Crude Oil 15-Min Multi-Unified Entry Zones (Dot Signals)//@version=6
indicator("CME Crude Oil 15-Min Multi-Unified Entry Zones (Dot Signals)", overlay=true)
// --- Input Parameters ---
emaLength = input.int(11, title="EMA Length", minval=1)
// Ichimoku Cloud Inputs (Adjusted for higher sensitivity)
conversionLineLength = input.int(7, title="Ichimoku Conversion Line Length (Sensitive)", minval=1)
baseLineLength = input.int(20, title="Ichimoku Base Line Length (Sensitive)", minval=1)
laggingSpanLength = input.int(40, title="Ichimoku Lagging Span Length (Sensitive)", minval=1)
displacement = input.int(26, title="Ichimoku Displacement", minval=1)
// MACD Inputs (Adjusted for higher sensitivity)
fastLength = input.int(9, title="MACD Fast Length (Sensitive)", minval=1)
slowLength = input.int(21, title="MACD Slow Length (Sensitive)", minval=1)
signalLength = input.int(6, title="MACD Signal Length (Sensitive)", minval=1)
// RSI Inputs
rsiLength = input.int(8, title="RSI Length", minval=1)
rsiOverbought = input.int(70, title="RSI Overbought Level", minval=50, maxval=90)
rsiOversold = input.int(30, title="RSI Oversold Level", minval=10, maxval=50)
// ADX Inputs
adxLength = input.int(14, title="ADX Length", minval=1)
adxTrendStrengthThreshold = input.int(20, title="ADX Trend Strength Threshold", minval=10, maxval=50)
// Weak Entry Threshold (50 ticks for Crude Oil, where 1 tick = $0.01)
// 50 ticks = $0.50
weakEntryTickThreshold = input.float(0.50, title="Weak Entry Threshold (in $)", minval=0.01)
// --- Indicator Calculations ---
// 1. EMA 11
ema11 = ta.ema(close, emaLength)
// 2. Ichimoku Cloud
donchian(len) => math.avg(ta.lowest(len), ta.highest(len))
tenkanSen = donchian(conversionLineLength)
kijunSen = donchian(baseLineLength)
senkouSpanA = math.avg(tenkanSen, kijunSen)
senkouSpanB = donchian(laggingSpanLength)
// Shifted for plotting (future projection)
senkouSpanA_plot = senkouSpanA
senkouSpanB_plot = senkouSpanB
// Chikou Span (lagging span, plotted 26 periods back)
chikouSpan = close
// 3. MACD
= ta.macd(close, fastLength, slowLength, signalLength)
// 4. RSI
rsi = ta.rsi(close, rsiLength)
// 5. ADX
= ta.dmi(adxLength, adxLength)
// --- Price Volume Pattern Logic ---
// Simplified volume confirmation:
isVolumeIncreasing = volume > volume
isVolumeDecreasing = volume < volume
isPriceUp = close > close
isPriceDown = close < close
bullishVolumeConfirmation = (isPriceUp and isVolumeIncreasing) or (isPriceDown and isVolumeDecreasing)
bearishVolumeConfirmation = (isPriceDown and isVolumeIncreasing) or (isPriceUp and isVolumeDecreasing)
// --- Daily Pivot Point Calculation (Critical Support/Resistance) ---
// Request daily High, Low, Close for pivot calculation
= request.security(syminfo.tickerid, "D", [high , low , close ])
// Classic Pivot Point Formula
dailyPP = (dailyHigh + dailyLow + dailyClose) / 3
dailyR1 = (2 * dailyPP) - dailyLow
dailyS1 = (2 * dailyPP) - dailyHigh
dailyR2 = dailyPP + (dailyHigh - dailyLow)
dailyS2 = dailyPP - (dailyHigh - dailyLow)
// --- Crosses and States for Unified Entry 1 (EMA & MACD) ---
// Moved ta.cross() calls outside of conditional blocks for consistent calculation.
emaGoldenCrossCondition = ta.cross(close, ema11)
emaDeathCrossCondition = ta.cross(ema11, close)
macdGoldenCrossCondition = ta.cross(macdLine, signalLine)
macdDeathCrossCondition = ta.cross(signalLine, macdLine)
emaIsBullish = close > ema11
emaIsBearish = close < ema11
macdIsBullishStrong = macdLine > signalLine and macdLine > 0
macdIsBearishStrong = macdLine < signalLine and macdLine < 0
// --- Unified Entry 1 Logic (EMA & MACD) ---
unifiedLongEntry1 = false
unifiedShortEntry1 = false
if (emaGoldenCrossCondition and macdIsBullishStrong )
unifiedLongEntry1 := true
else if (macdGoldenCrossCondition and emaIsBullish )
unifiedLongEntry1 := true
if (emaDeathCrossCondition and macdIsBearishStrong )
unifiedShortEntry1 := true
else if (macdDeathCrossCondition and emaIsBearish )
unifiedShortEntry1 := true
// --- Unified Entry 2 Logic (Ichimoku & EMA/Volume) ---
unifiedLongEntry2 = false
unifiedShortEntry2 = false
ichimokuCloudBullish = close > senkouSpanA_plot and close > senkouSpanB_plot and
senkouSpanA_plot > senkouSpanB_plot and
tenkanSen > kijunSen and
chikouSpan > close
ichimokuCloudBearish = close < senkouSpanA_plot and close < senkouSpanB_plot and
senkouSpanB_plot > senkouSpanA_plot and
tenkanSen < kijunSen and
chikouSpan < close
// Moved ta.cross() calls outside of conditional blocks for consistent calculation.
ichimokuBullishTriggerCondition = ta.cross(tenkanSen, kijunSen)
ichimokuBearishTriggerCondition = ta.cross(kijunSen, tenkanSen)
priceCrossAboveSenkouA = ta.cross(close, senkouSpanA_plot)
priceCrossBelowSenkouA = ta.cross(senkouSpanA_plot, close)
if (ichimokuBullishTriggerCondition or (priceCrossAboveSenkouA and close > senkouSpanB_plot)) and
emaIsBullish and
bullishVolumeConfirmation
unifiedLongEntry2 := true
if (ichimokuBearishTriggerCondition or (priceCrossBelowSenkouA and close < senkouSpanB_plot)) and
emaIsBearish and
bearishVolumeConfirmation
unifiedShortEntry2 := true
// --- Weak Entry Logic ---
weakLongEntry = false
weakShortEntry = false
// Function to check for weak long entry
// Checks if the distance to the nearest resistance (R1 or R2) is less than the threshold
f_isWeakLongEntry(currentPrice) =>
bool isWeak = false
// Check R1 if it's above current price and within threshold
if dailyR1 > currentPrice and (dailyR1 - currentPrice < weakEntryTickThreshold)
isWeak := true
// Check R2 if it's above current price and within threshold (only if not already weak by R1)
else if dailyR2 > currentPrice and (dailyR2 - currentPrice < weakEntryTickThreshold)
isWeak := true
isWeak
// Function to check for weak short entry
// Checks if the distance to the nearest support (S1 or S2) is less than the threshold
f_isWeakShortEntry(currentPrice) =>
bool isWeak = false
// Check S1 if it's below current price and within threshold
if dailyS1 < currentPrice and (currentPrice - dailyS1 < weakEntryTickThreshold)
isWeak := true
// Check S2 if it's below current price and within threshold (only if not already weak by S1)
else if dailyS2 < currentPrice and (currentPrice - dailyS2 < weakEntryTickThreshold)
isWeak := true
isWeak
// Apply weak entry check to Unified Entry 1
if unifiedLongEntry1 and f_isWeakLongEntry(close)
weakLongEntry := true
if unifiedShortEntry1 and f_isWeakShortEntry(close)
weakShortEntry := true
// Apply weak entry check to Unified Entry 2
if unifiedLongEntry2 and f_isWeakLongEntry(close)
weakLongEntry := true
if unifiedShortEntry2 and f_isWeakShortEntry(close)
weakShortEntry := true
// --- Enhanced Entry Conditions with RSI and ADX ---
// Removed candlestick pattern requirement.
// Only consider an entry if RSI is not overbought/oversold AND ADX indicates trend strength.
// Enhanced Long Entry Condition
enhancedLongEntry = (unifiedLongEntry1 or unifiedLongEntry2) and
(rsi < rsiOverbought) and // RSI not overbought
(adx > adxTrendStrengthThreshold) // ADX shows trend strength
// Enhanced Short Entry Condition
enhancedShortEntry = (unifiedShortEntry1 or unifiedShortEntry2) and
(rsi > rsiOversold) and // RSI not oversold
(adx > adxTrendStrengthThreshold) // ADX shows trend strength
// --- Define colors as variables for clarity and to potentially resolve parsing issues ---
// Changed named color constants to hexadecimal values
var color strongBuyDotColor = #FFD700 // Gold
var color weakBuyDotColor = #008000 // Green
var color strongSellDotColor = #FFFFFF // White
var color weakSellDotColor = #FF0000 // Red
// --- Plotting Entry Dots on Candlesticks ---
// Define conditions for plotting only on the *first* occurrence of a signal
isNewStrongBuy = enhancedLongEntry and not weakLongEntry and not (enhancedLongEntry and not weakLongEntry )
isNewWeakBuy = enhancedLongEntry and weakLongEntry and not (enhancedLongEntry and weakLongEntry )
isNewStrongSell = enhancedShortEntry and not weakShortEntry and not (enhancedShortEntry and not weakShortEntry )
isNewWeakSell = enhancedShortEntry and weakShortEntry and not (enhancedShortEntry and weakShortEntry )
// Helper functions to check candlestick type
isCurrentCandleBullish = close > open
isCurrentCandleBearish = close < open
// Strong Buy: Gold dot (only on bullish candles)
plotshape(isNewStrongBuy and isCurrentCandleBullish ? close : na, title="Strong B", location=location.absolute, color=strongBuyDotColor, style=shape.circle, size=size.tiny)
// Weak Buy: Solid Green dot (no candlestick filter for weak buys)
// Changed text to "" and style to shape.triangleup for symbol only
plotshape(isNewWeakBuy ? close : na, title="Weak B", location=location.absolute, color=weakBuyDotColor, style=shape.triangleup, size=size.tiny)
// Strong Sell: White dot (only on bearish candles)
plotshape(isNewStrongSell and isCurrentCandleBearish ? close : na, title="Strong S", location=location.absolute, color=strongSellDotColor, style=shape.circle, size=size.tiny)
// Weak Sell: Red dot (no candlestick filter for weak sells)
// Changed text to "" and style to shape.triangledown for symbol only
plotshape(isNewWeakSell ? close : na, title="Weak S", location=location.absolute, color=weakSellDotColor, style=shape.triangledown, size=size.tiny)
// --- Plotting Indicators (Optional, for visual confirmation) ---
// All indicator plots have been removed as requested.
// plot(ema11, title="EMA 11", color=emaColor)
// plot(tenkanSen, title="Tenkan-Sen", color=tenkanColor)
// plot(kijunSen, title="Kijun-Sen", color=kijunColor)
// plot(senkouSpanA_plot, title="Senkou Span A", color=senkouAColor, offset=displacement)
// plot(senkouSpanB_plot, title="Senkou Span B", color=senkouBColor, offset=displacement)
// fill(plot(senkouSpanA_plot, offset=displacement), plot(senkouSpanB_plot, offset=displacement), color=cloudFillBullishColor, title="Cloud Fill Bullish")
// fill(plot(senkouSpanA_plot, offset=displacement), plot(senkouSpanB_plot, offset=displacement), color=cloudFillBearishColor, title="Cloud Fill Bearish")
// plot(chikouSpan, title="Chikou Span", color=chikouColor, offset=-displacement)
// plot(macdLine, title="MACD Line", color=macdLineColor, display=display.pane)
// plot(signalLine, title="Signal Line", color=signalLineColor, display=display.pane)
// plot(hist, title="Histogram", color=hist >= 0 ? histGreenColor : histRedColor, style=plot.style_columns, display=display.pane)
// plot(rsi, title="RSI", color=rsiPlotColor, display=display.pane)
// hline(rsiOverbought, "RSI Overbought", color=rsiHlineRedColor, linestyle=hline.style_dashed, display=display.all)
// hline(rsiOversold, "RSI Oversold", color=rsiHlineGreenColor, linestyle=hline.style_dashed, display=display.all)
// plot(adx, title="ADX", color=adxPlotColor, display=display.pane)
// hline(adxTrendStrengthThreshold, "ADX Threshold", color=adxHlineColor, linestyle=hline.style_dashed, display=display.all)
// plot(diPlus, title="+DI", color=diPlusColor, display=display.pane)
// plot(diMinus, title="-DI", color=diMinusColor, display=display.pane)
// plot(dailyPP, title="Daily PP", color=dailyPPColor, style=plot.style_line, linewidth=1)
// plot(dailyR1, title="Daily R1", color=dailyRColor, style=plot.style_line, linewidth=1)
// plot(dailyR2, title="Daily R2", color=dailyRColor, style=plot.style_line, linewidth=1)
// plot(dailyS1, title="Daily S1", color=dailySColor, style=plot.style_line, linewidth=1)
// plot(dailyS2, title="Daily S2", color=dailySColor, style=plot.style_line, linewidth=1)
// --- Alerts (Optional) ---
alertcondition(enhancedLongEntry and not weakLongEntry, title="Strong Buy Alert", message="CME Crude Oil: Strong Buy Entry!")
alertcondition(enhancedLongEntry and weakLongEntry, title="Weak Buy Alert", message="CME Crude Oil: Weak Buy Entry Detected!")
alertcondition(enhancedShortEntry and not weakShortEntry, title="Strong Sell Alert", message="CME Crude Oil: Strong Sell Entry!")
alertcondition(enhancedShortEntry and weakShortEntry, title="Weak Sell Alert", message="CME Crude Oil: Weak Sell Entry Detected!")

💼 Momentum SNR VIP//@version=5
indicator("Momentum", overlay=true)
// === SNR Detection ===
lookback = input.int(20, "Lookback for S/R", minval=5)
pivotHigh = ta.pivothigh(high, lookback, lookback)
pivotLow = ta.pivotlow(low, lookback, lookback)
// Plot SNR Zones
plotshape(pivotHigh, title="Resistance", location=location.abovebar, color=color.red, style=shape.triangledown, size=size.small)
plotshape(pivotLow, title="Support", location=location.belowbar, color=color.blue, style=shape.triangleup, size=size.small)
// === Price Action Detection ===
// Bullish Engulfing
bullishEngulfing = close < open and close > open and close > open and open <= close
// Bearish Engulfing
bearishEngulfing = close > open and close < open and close < open and open >= close
// Pin Bar Bullish
bullishPinBar = close > open and (low - math.min(open, close)) > 1.5 * (math.abs(close - open))
// Pin Bar Bearish
bearishPinBar = close < open and (math.max(open, close) - high) > 1.5 * (math.abs(close - open))
// === Combined Signal at SNR ===
supportZone = not na(pivotLow)
resistanceZone = not na(pivotHigh)
buySignal = (bullishEngulfing or bullishPinBar) and supportZone
sellSignal = (bearishEngulfing or bearishPinBar) and resistanceZone
// Plot Buy/Sell Arrows
plotshape(buySignal, title="Buy Signal", location=location.belowbar, color=color.green, style=shape.labelup, text="BUY")
plotshape(sellSignal, title="Sell Signal", location=location.abovebar, color=color.red, style=shape.labeldown, text="SELL")
// === SL & TP Calculation ===
rr_ratio = input.float(2.0, "Risk Reward Ratio", minval=0.5, step=0.5)
buySL = low
buyTP = close + (close - low) * rr_ratio
sellSL = high
sellTP = close - (high - close) * rr_ratio
plot(buySignal ? buySL : na, title="Buy SL", color=color.red, style=plot.style_linebr, linewidth=1)
plot(buySignal ? buyTP : na, title="Buy TP", color=color.green, style=plot.style_linebr, linewidth=1)
plot(sellSignal ? sellSL : na, title="Sell SL", color=color.red, style=plot.style_linebr, linewidth=1)
plot(sellSignal ? sellTP : na, title="Sell TP", color=color.green, style=plot.style_linebr, linewidth=1)
// === Alerts ===
alertcondition(buySignal, title="Buy Alert", message="GOLD: Potential BUY @ SNR Zone + Price Action")
alertcondition(sellSignal, title="Sell Alert", message="GOLD: Potential SELL @ SNR Zone + Price Action")

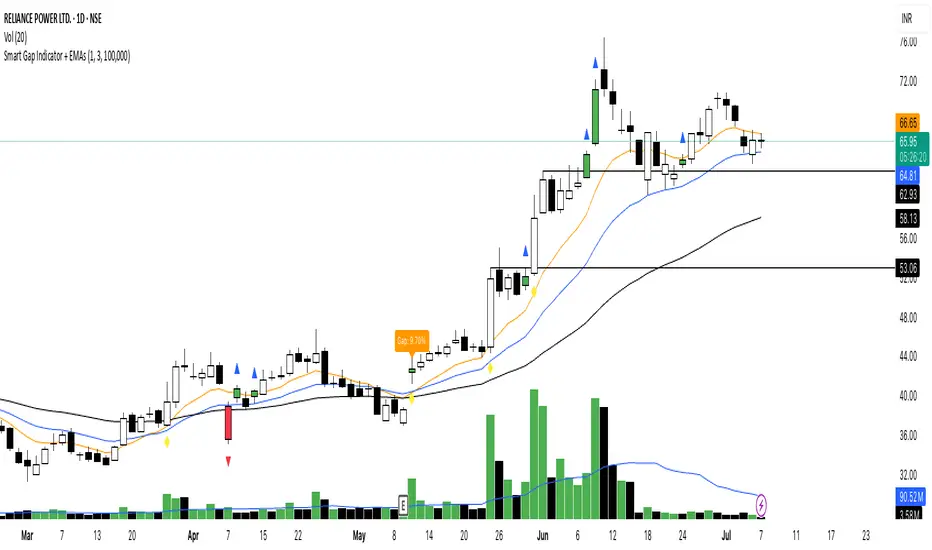
Smart Gap Indicator + EMAs📈 Smart Gap Indicator + EMAs
Spot high-impact gaps with precision and confidence.
🔍 What it does:
This tool identifies and highlights strategic price gaps that often precede strong directional moves. It filters out noise by combining advanced logic with volume activity and trend bias, helping you focus on the most relevant setups.
📊 Key Features:
Smart Gap Detection – Automatically detects meaningful gap up/down events based on dynamic thresholds.
EMA Trend Filter – Optional multi-EMA filter (10, 21, 50) to help align trades with the prevailing market trend.
Volume Spike Signal – Highlights volume surges that may indicate institutional involvement.
Clean Visuals – Configurable labels, shapes, and optional gap fill lines to aid quick interpretation.
Gap Performance Table – Summarizes recent gap activity to assess directional bias.
⚠️ Built-in Alerts:
Gap Up
Gap Down
Gap + Volume Spike
💡 Made by a trader, for traders.
Whether you're a swing trader, gap hunter, or momentum follower—this tool was crafted to give you an edge where it matters most: timing.
Moving Average Convergence Divergence//@version=5
indicator(title="Moving Average Convergence Divergence", shorttitle="MACD", timeframe="", timeframe_gaps=true)
// Getting inputs
fast_length = input(title = "Fast Length", defval = 12)
slow_length = input(title = "Slow Length", defval = 26)
src = input(title = "Source", defval = close)
signal_length = input.int(title = "Signal Smoothing", minval = 1, maxval = 50, defval = 9)
sma_source = input.string(title = "Oscillator MA Type", defval = "EMA", options = )
sma_signal = input.string(title = "Signal Line MA Type", defval = "EMA", options = )
// Calculating
fast_ma = sma_source == "SMA" ? ta.sma(src, fast_length) : ta.ema(src, fast_length)
slow_ma = sma_source == "SMA" ? ta.sma(src, slow_length) : ta.ema(src, slow_length)
macd = fast_ma - slow_ma
signal = sma_signal == "SMA" ? ta.sma(macd, signal_length) : ta.ema(macd, signal_length)
hist = macd - signal
alertcondition(hist >= 0 and hist < 0, title = 'Rising to falling', message = 'The MACD histogram switched from a rising to falling state')
alertcondition(hist <= 0 and hist > 0, title = 'Falling to rising', message = 'The MACD histogram switched from a falling to rising state')
hline(0, "Zero Line", color = color.new(#787B86, 50))
plot(hist, title = "Histogram", style = plot.style_columns, color = (hist >= 0 ? (hist < hist ? #26A69A : #B2DFDB) : (hist < hist ? #FFCDD2 : #FF5252)))
plot(macd, title = "MACD", color = #2962FF)
plot(signal, title = "Signal", color = #FF6D00)

多周期共振策略 PRO · Multi-Timeframe Resonance v1.6🇬🇧 English
🚀 Multi-Timeframe Resonance System – Spot Strong Rallies & Reversal Zones At a Glance!
✨ Licensed & Exclusive · Official Version Only · Long-Term Subscription / Licensed Distribution Supported
📌 Highlights
🔹 Multi-Timeframe Resonance Detection
Analyze multiple timeframes simultaneously. Auto-tag trend phases and consolidation zones—quickly identify entries and exits. Supports M‑Top / W‑Bottom / consolidation breakouts / trend reversals.
🔹 Clarity in Trend vs Ranging
Visually highlight trend expansion (green = bullish) and range zones (red = bearish), no need to switch timeframes manually.
🔹 Perfect for All Asset Classes
Stock / ETF, Futures / Commodities, FX / Gold, Crypto—just tweak parameters to match any market rhythm.
🧠 Ideal For
✅ Traders who need quick structural insights from complex charts
✅ Trend followers, swing traders, range breakout players
✅ Multi-timeframe aficionados and order-flow researchers
✅ Quant teams & strategy developers requiring reliable signals
🔒 How to Use
Licensed version only—contact me for trial or purchase. Once activated, your account is bound, settings are saved forever—no reconfiguring.
🛠️ Exclusive Support For Licensees
• Parameter optimization per asset class
• Strategy updates & alerts
• Access to VIP strategy research group
📩 Contact now to start your quantitative trading journey!
Send a DM or comment on TradingView for license details.
🇨🇳 中文
🚀 多周期共振识别系统 —— 强势震荡与拐点,一目了然!
✨ 授权专用 · 唯一正版 · 支持长期订阅 / 授权分发
📌 核心优势 Highlights
🔹 多周期共振识别
同时分析多个周期,智能标注趋势方向与震荡区间,帮你迅速判断进退时机,支持识别 M 顶 / W 底 / 震荡拐点 / 多空趋势切换。
🔹 震荡 / 趋势 一目了然
自动高亮“趋势推进期”与“震荡盘整区”,绿色代表底部,多头关注;红色代表顶部,空头防守。
🔹 适用于所有金融产品
股票 / ETF、期货 / 商品、外汇 / 黄金、加密货币(Crypto),微调参数即可适配各市场“节奏感”。
🧠 适用人群
✅ 需要速辨图表结构的交易者
✅ 擅长趋势跟随、波段捕捉、震荡套利的投资者
✅ 多周期分析爱好者、主力行为研究者
✅ 需要稳定策略输出的量化团队 / 策略研发者
🔒 使用方式
本指标为受控授权版本,先联系作者获取试用 / 购买权限。绑定账号后,无需重复设置,永久保存参数。
🛠️ 授权用户专享支持
• 参数优化建议(针对不同市场)
• 策略更新同步推送
• VIP 策略研究交流群
📩 立即联系作者,开启量化交易新维度!
在 TradingView 上私信或留言,获取授权与使用说明。
🇯🇵 日本語
🚀 マルチタイムフレーム共振システム ― トレンド&レンジを一目で把握!
✨ ライセンス制・公式正規版・長期購読/ライセンス配布対応
📌 特徴
🔹 マルチタイムフレーム共振検出
複数の時間軸を同時分析し、トレンドとレンジゾーンを自動マーキング。Mトップ/Wボトム/レンジブレイク/トレンド転換を即判断。
🔹 トレンドとレンジの視認性向上
トレンド加速期は緑、レンジは赤で強調表示。タイムフレームの切り替え不要。
🔹 すべての金融商品に対応
株/ETF、先物/商品、FX/ゴールド、暗号資産(Crypto)に対応し、市場ごとの「リズム」に合わせた微調整のみで利用可能。
🧠 こんな方におすすめ
✅ 複雑なチャートから構造を素早く把握したいトレーダー
✅ トレンドフォロー、スイング、レンジブレイク手法採用者
✅ マルチタイムフレーム分析やオーダーフローに関心のある方
✅ 安定信号を求めるクオンツチーム/戦略開発者
🔒 利用方法
ライセンス制のみ:試用/購入は作者に直接お問い合わせください。認証アカウントには永続的にパラメータが保存されます。
🛠️ ライセンス者限定サポート
• 資産別パラメーター最適化アドバイス
• 継続的な戦略アップデート配信
• VIP研究グループ参加権
📩 今すぐ連絡して、量的トレードの新次元へ!
TradingViewでDMまたはコメントを送信して下さい。
🇫🇷 Français
