Crypto Pulse Strategy ActiveCrypto Pulse Strategy Active
Short-term crypto strategy for 1h-4h charts. Uses RSI, Bollinger Bands, and VWAP to spot buy/sell signals. Buy above VWAP with low BB or RSI < 25; sell below VWAP with high BB or RSI > 75. Risks 1% per trade with 1.5% stop-loss and 1.5x profit. Test on BTC/ETH first!
Chart patterns

Hybrid candles by Marian BWill plot normal candles with the Heikin-Ashi colors.
You must bring the visiual order to front.

log.info() - 5 Exampleslog.info() is one of the most powerful tools in Pine Script that no one knows about. Whenever you code, you want to be able to debug, or find out why something isn’t working. The log.info() command will help you do that. Without it, creating more complex Pine Scripts becomes exponentially more difficult.
The first thing to note is that log.info() only displays strings. So, if you have a variable that is not a string, you must turn it into a string in order for log.info() to work. The way you do that is with the str.tostring() command. And remember, it's all lower case! You can throw in any numeric value (float, int, timestamp) into str.string() and it should work.
Next, in order to make your output intelligible, you may want to identify whatever value you are logging. For example, if an RSI value is 50, you don’t want a bunch of lines that just say “50”. You may want it to say “RSI = 50”.
To do that, you’ll have to use the concatenation operator. For example, if you have a variable called “rsi”, and its value is 50, then you would use the “+” concatenation symbol.
EXAMPLE 1
━━━━━━━━━━━━━━━━━━━━━━━━━━━━━━━━━
//@version=6
indicator("log.info()")
rsi = ta.rsi(close,14)
log.info(“RSI= ” + str.tostring(rsi))
Example Output =>
RSI= 50
Here, we use double quotes to create a string that contains the name of the variable, in this case “RSI = “, then we concatenate it with a stringified version of the variable, rsi.
Now that you know how to write a log, where do you view them? There isn’t a lot of documentation on it, and the link is not conveniently located.
Open up the “Pine Editor” tab at the bottom of any chart view, and you’ll see a “3 dot” button at the top right of the pane. Click that, and right above the “Help” menu item you’ll see “Pine logs”. Clicking that will open that to open a pane on the right of your browser - replacing whatever was in the right pane area before. This is where your log output will show up.
But, because you’re dealing with time series data, using the log.info() command without some type of condition will give you a fast moving stream of numbers that will be difficult to interpret. So, you may only want the output to show up once per bar, or only under specific conditions.
To have the output show up only after all computations have completed, you’ll need to use the barState.islast command. Remember, barState is camelCase, but islast is not!
EXAMPLE 2
━━━━━━━━━━━━━━━━━━━━━━━━━━━━━━━━━
//@version=6
indicator("log.info()")
rsi = ta.rsi(close,14)
if barState.islast
log.info("RSI=" + str.tostring(rsi))
plot(rsi)
However, this can be less than ideal, because you may want the value of the rsi variable on a particular bar, at a particular time, or under a specific chart condition. Let’s hit these one at a time.
In each of these cases, the built-in bar_index variable will come in handy. When debugging, I typically like to assign a variable “bix” to represent bar_index, and include it in the output.
So, if I want to see the rsi value when RSI crosses above 0.5, then I would have something like
EXAMPLE 3
━━━━━━━━━━━━━━━━━━━━━━━━━━━━━━━━━
//@version=6
indicator("log.info()")
rsi = ta.rsi(close,14)
bix = bar_index
rsiCrossedOver = ta.crossover(rsi,0.5)
if rsiCrossedOver
log.info("bix=" + str.tostring(bix) + " - RSI=" + str.tostring(rsi))
plot(rsi)
Example Output =>
bix=19964 - RSI=51.8449459867
bix=19972 - RSI=50.0975830828
bix=19983 - RSI=53.3529808079
bix=19985 - RSI=53.1595745146
bix=19999 - RSI=66.6466337654
bix=20001 - RSI=52.2191767466
Here, we see that the output only appears when the condition is met.
A useful thing to know is that if you want to limit the number of decimal places, then you would use the command str.tostring(rsi,”#.##”), which tells the interpreter that the format of the number should only be 2 decimal places. Or you could round the rsi variable with a command like rsi2 = math.round(rsi*100)/100 . In either case you’re output would look like:
bix=19964 - RSI=51.84
bix=19972 - RSI=50.1
bix=19983 - RSI=53.35
bix=19985 - RSI=53.16
bix=19999 - RSI=66.65
bix=20001 - RSI=52.22
This would decrease the amount of memory that’s being used to display your variable’s values, which can become a limitation for the log.info() command. It only allows 4096 characters per line, so when you get to trying to output arrays (which is another cool feature), you’ll have to keep that in mind.
Another thing to note is that log output is always preceded by a timestamp, but for the sake of brevity, I’m not including those in the output examples.
If you wanted to only output a value after the chart was fully loaded, that’s when barState.islast command comes in. Under this condition, only one line of output is created per tick update — AFTER the chart has finished loading. For example, if you only want to see what the the current bar_index and rsi values are, without filling up your log window with everything that happens before, then you could use the following code:
EXAMPLE 4
━━━━━━━━━━━━━━━━━━━━━━━━━━━━━━━━━
//@version=6
indicator("log.info()")
rsi = ta.rsi(close,14)
bix = bar_index
if barstate.islast
log.info("bix=" + str.tostring(bix) + " - RSI=" + str.tostring(rsi))
Example Output =>
bix=20203 - RSI=53.1103309071
This value would keep updating after every new bar tick.
The log.info() command is a huge help in creating new scripts, however, it does have its limitations. As mentioned earlier, only 4096 characters are allowed per line. So, although you can use log.info() to output arrays, you have to be aware of how many characters that array will use.
The following code DOES NOT WORK! And, the only way you can find out why will be the red exclamation point next to the name of the indicator. That, and nothing will show up on the chart, or in the logs.
// CODE DOESN’T WORK
//@version=6
indicator("MW - log.info()")
var array rsi_arr = array.new()
rsi = ta.rsi(close,14)
bix = bar_index
rsiCrossedOver = ta.crossover(rsi,50)
if rsiCrossedOver
array.push(rsi_arr, rsi)
if barstate.islast
log.info("rsi_arr:" + str.tostring(rsi_arr))
log.info("bix=" + str.tostring(bix) + " - RSI=" + str.tostring(rsi))
plot(rsi)
// No code errors, but will not compile because too much is being written to the logs.
However, after putting some time restrictions in with the i_startTime and i_endTime user input variables, and creating a dateFilter variable to use in the conditions, I can limit the size of the final array. So, the following code does work.
EXAMPLE 5
━━━━━━━━━━━━━━━━━━━━━━━━━━━━━━━━━
// CODE DOES WORK
//@version=6
indicator("MW - log.info()")
i_startTime = input.time(title="Start", defval=timestamp("01 Jan 2025 13:30 +0000"))
i_endTime = input.time(title="End", defval=timestamp("1 Jan 2099 19:30 +0000"))
var array rsi_arr = array.new()
dateFilter = time >= i_startTime and time <= i_endTime
rsi = ta.rsi(close,14)
bix = bar_index
rsiCrossedOver = ta.crossover(rsi,50) and dateFilter // <== The dateFilter condition keeps the array from getting too big
if rsiCrossedOver
array.push(rsi_arr, rsi)
if barstate.islast
log.info("rsi_arr:" + str.tostring(rsi_arr))
log.info("bix=" + str.tostring(bix) + " - RSI=" + str.tostring(rsi))
plot(rsi)
Example Output =>
rsi_arr:
bix=20210 - RSI=56.9030578034
Of course, if you restrict the decimal places by using the rounding the rsi value with something like rsiRounded = math.round(rsi * 100) / 100 , then you can further reduce the size of your array. In this case the output may look something like:
Example Output =>
rsi_arr:
bix=20210 - RSI=55.6947486019
This will give your code a little breathing room.
In a nutshell, I was coding for over a year trying to debug by pushing output to labels, tables, and using libraries that cluttered up my code. Once I was able to debug with log.info() it was a game changer. I was able to start building much more advanced scripts. Hopefully, this will help you on your journey as well.

Linton Price Targets (R)Linton Price Targets are effectively traditional 3-Box reversal Point and Figure vertical count targets applied to time-based charts.
This method is purely rules based in line with the original 3-Box Point and Figure technique. Unit size (box size) may be varied to change the sensitivity of the targets. Target Factor may also be varied.
Time Projection of the targets to a future date (something that is not possible on a Point and Figure chart) is also made possible with Linton Price Targets with five different methodologies where various factors may be set. Linton Price Targets negate the need for using Point and Figure charts and allows for time based Technical Analysis indicators (ie: RSI) to be shown on the same chart.

ABCD Pattern FinderThis is a basic version: more robust implementations use zigzag structures and advanced filtering.
You may want to filter by Fibonacci ratios like 61.8%, 78.6%, or 127.2% depending on your preferred ABCD variation.

SPX Optimized EMA+VWAP+RSI IndicatorOptimized SPX EMA+VWAP+RSI indicators.
EMA9 = Orange
EMA21 =Blue
EMA50=Purple
EMA200=Red
VWAP=Teal

Cryptomath Position CalculatorThe CryptoMath Position Calculator
makes it easy to calculate your position size by simply entering a few basic inputs.
It helps you determine the optimal position size without overcomplicating things
quick, simple, and accurate.


Dow Theory Smart Indicator by Wealthemoji📉 Dow Theory Smart Indicator
This indicator is inspired by the principles of Dow Theory, enhanced through proprietary smart money detection. It dynamically marks key market structure shifts, including breakouts and reversals, using internally coded smart techniques.
Designed for traders seeking early trend identification and structural clarity, this tool highlights pivotal levels and potential decision.
Ideal for intraday scalping, swing trading, or long term trend following across various timeframes.
Advantages:
•Early Trend Detection: Identifies potential trend reversals and continuations with minimal lag.
•Structure-Focused: Tracks key shifts in market structure for smart decision-making.
•Multi-Timeframe Friendly: Suitable for scalping, swing, and positional trades.
•High Clarity: Reduces market noise and highlights critical turning points.
•Visual Simplicity: Clean chart output without clutter or unnecessary overlays.
Key Features:
•Plots potential Break of Structure (BoS) and Change of Character (CHoCH) zones.
•Visually distinguishes between bullish and bearish structural moves.
•Designed to work across forex, crypto, indices, and stocks.
•Built for minimal user input – plug-and-play experience.
•Compatible with alerts for real-time structure shift notifications.
Limitations:
•Not a standalone system – works best when combined with risk management and confirmation tools.
•May repaint slightly on lower timeframes during fast market conditions.
•Does not guarantee reversals – helps in identifying high-probability zones, not certainties.
•Flat markets or tight ranges may produce fewer or late signals.

Strict Trend Sweep - Buy/Sellscrict 5min trend following system.
Entering on the sweep of the previous high(downtrend) or Low (uptrend)
trend following

Elev8+ Reversal IndicatorThe Ultimate Reversal Finder Indicator. Does NOT Repaint or give 100 signals a day. Will only indicate strong reversal points. Use with extra confluence like support and resistance, MA's, liquidity sweeps, etc. More accurate at higher timeframes.

MGC Trend Sweep Entry (Strict)TREND SWEEP SYSTEM.
It is a 5min strategy for MGC or other future pairs.
Sweeping the trend system is what i call it

hash98trade-AI1.Hash98Trade-AI is a comprehensive trading indicator that integrates optimized SuperTrend, KNN prediction, volume-price analysis, and classic pattern recognition. It is designed to help traders capture trends, identify key entry and exit points, and assess market manipulation risks. Suitable for stocks, forex, and cryptocurrency markets, it empowers both intraday and swing traders to enhance decision-making accuracy.
3. Core Features
AI-Powered Trend Prediction
Leverages KNN algorithm and K-means clustering to dynamically optimize SuperTrend factors, enabling precise trend direction identification.
Multi-Dimensional Volume-Price Analysis
Combines buying/selling pressure, volume weighting, and ATR-based volatility to deliver high-confidence trading signals.
Classic Pattern Recognition
Detects 14 classic market patterns (e.g., double bottom, head and shoulders, V-shaped reversals), helping reveal potential market manipulation behavior.
Capital Flow Monitoring
Utilizes daily support/resistance zones to detect entry/exit signals from institutional and retail capital.
Initial Surge/Dump Candle Signals
Analyzes price movements to accurately mark the starting points of upward or downward trends.
Visual Dashboard
Displays real-time signal strength, optimal factor settings, KNN predictions, and data status—empowering quick decision-making.
Flexible Parameter Configuration
Supports various moving average types, customizable timeframes, and signal filtering methods to suit different trading styles.
4. Use Cases
Best Use Scenarios
Intraday Trading: Effective on 1-minute to 1-hour charts by combining volume breakouts and surge-start candle signals to capture short-term opportunities.
Swing Trading: Ideal for 4-hour to daily charts, using capital flow and pattern signals for medium- to long-term trend following.
High Volatility Markets: Especially suited for forex and cryptocurrencies; AI predictions and pattern analysis increase signal reliability.
Recommended Markets
Stocks, Futures, Forex, Cryptocurrencies
Tip: In ranging or choppy markets, enable volatility or adaptive signal filtering to reduce false signals.
5. How to Use
Add the Indicator
Search for and apply hash98trade-AI on TradingView.
Adjust Parameters
MA Type: Default is EMA; SMA, WMA, etc., are also available.
ATR Period: Default is 10. Set to 5–7 for short-term trading, or 15–20 for longer-term strategies.
KNN Neighbors: Default is 6; adjust between 5–10 depending on market volatility.
Signal Threshold: Default is 65. Lower to 50 to capture more signals, or raise to 80 for higher signal quality.
Interpret Signals
Trend Line: Orange line represents SuperTrend. Green = Bullish; Red = Bearish.
Buy/Sell Signals:
Green/Cyan/Blue triangles = Buy (Institutional/Regular/Advanced).
Purple/Black inverted triangles = Sell signals.
Pattern Signals: Enable “Show Pattern Signals” to view markers for detected patterns (e.g., double bottom, volume breakout).
Manipulation Score: View risk score in the dashboard (Green = low risk; Red = high risk).
Combine with Other Tools: Use alongside RSI, MACD, or Bollinger Bands for signal confirmation.
Dashboard: Enable “Show Dashboard” to track real-time signal strength, KNN output, and data status.
6. Notes
Data Requirement: KNN-based predictions require at least 150 historical candles for optimal performance; signals may be weak initially.
Risk Management: Indicator signals are for reference only—always use stop-loss and position sizing, especially in low-volume markets.
Market Suitability: In low-volatility or ranging markets, enable volatility or volume filters to minimize misjudgments.
Disclaimer: This indicator does not constitute financial advice. Use it in conjunction with your trading strategy and market analysis.
7. Visualization Examples (Optional)
On your TradingView publication page, consider including the following screenshots:
Main Chart: Showcasing SuperTrend line, buy/sell signals, and surge/dump K markers.
Dashboard: Highlighting signal strength, KNN predictions, and data status.
Pattern Markers: Demonstrating recognition of W-bottom, head and shoulders, etc.
Manipulation Score: Displaying the trend of risk scores over time.

XForex Strategy by Wealthemoji🧠 XForex Strategy – Precision Trend Breakout System
XForex Strategy is a trend-following breakout system designed to capture high-probability directional moves with precision. It uses a volatility-adjusted dynamic engine to detect real-time trend shifts and plots Buy/Sell labels directly on the chart, along with a trailing reference line for potential stop-loss management.
The strategy highlights yellow candles in key consolidation zones after a signal, helping traders anticipate continuation or invalidation. All settings are internally fixed for consistency and protection of proprietary logic. Suitable for intraday, swing, and positional trading across Forex, commodities, and indices.
The XForex Strategy is a robust, visually intuitive trading tool designed to help traders capture high-probability breakout trends with clarity and discipline. This indicator leverages a proprietary trend recognition model that dynamically adapts to market volatility and price behavior, filtering out market noise and generating clean, decisive entries.
Rather than relying on a static moving average crossover or traditional trend filters, the strategy continuously re-evaluates market structure based on a combination of price momentum and volatility expansion. When the price confirms a directional shift, clear BUY and SELL labels are plotted directly on the chart — ensuring timely entries without lag.
What sets this script apart is its adaptive trailing structure, which acts as a dynamic stop-level guidance tool. This not only assists in entry decisions, but also provides a framework for risk management — particularly useful for trend-followers and breakout traders.
🔔 Key Features:
• Clear Buy & Sell Signals: No ambiguity — the script provides labels with actionable trade directions.
• Volatility-Aware Trend Engine: Reduces whipsaws during sideways markets while capturing strong moves.
• Auto-Trail Stop Visuals: A built-in trailing system that adapts to market structure — ideal for managing exits.
• Yellow Candle Alerting: Special candle coloring logic highlights key follow-through zones after signal generation.
• Works Across Assets: Compatible with Forex, Indices, Commodities (like XAUUSD), and Crypto.
• Hardcoded Inputs: Strategy settings are locked for consistency and standardization.
📈 How to Use:
• Add the script to any chart and wait for a Buy or Sell label to appear.
• Use the trailing signal line as a reference for stop-loss levels.
• Yellow candles indicate zones where a signal is active but price has yet to break out — offering early positioning insights.
• Backtest across various timeframes like 15min, 1hr, and 4hr to fit your trading style.
Limitations of XForex Strategy
1. Late Entries: Signals often appear after the trend has already started.
2. False Signals in Sideways Markets: Prone to whipsaws during low volatility.
3. Fixed Parameters: No flexibility to adjust for different assets or timeframes.
4. No Take-Profit Logic: Only stop-loss is defined; TP must be managed manually.
5. Not Ideal for Ranging Markets: Performs best in trending conditions.
6. No Volume Filter: May enter weak trends without confirmation.
7. Sensitive to News Events: Can react to sudden price spikes with false triggers.

MK Flip StrategyMK Flip Reversal Strategy
💡 Core Concept
This strategy is designed to capture price reversals at significant Swing High/Low points. It utilizes a special 4-candle pattern (called the "MK Flip") as the core of its trade entries, combined with a flexible risk management system and signal filtering to increase precision and control losses within predefined limits.
✨ Key Features
Unique Entry Pattern: Uses a tested 4-bar reversal pattern for signal generation.
Advanced Risk Management: Automatically calculates position size based on a fixed USD risk you define (Risk per Trade), ensuring consistent risk exposure.
Dual Execution Modes:
Simple Mode: Sets a Pending Limit Order, waiting for price confirmation.
Advanced Mode: Waits for price confirmation then enters with a Market Order, featuring a complex timeout system.
Flexible Timeout System: Independently choose to use a time-based expiration (Grace Period) or an RSI-based expiration (RSI Timeout).
Dual-Layer Signal Filtering: Comes with two filters to improve signal quality:
RSI Divergence Filter: Filters signals based on price/RSI divergence.
Swing/Breakout Filter: Ensures the pattern occurs at a significant turning point or as a breakout of a recent range, not in the middle of a sideways market.
📊 Recommended Pairs & Timeframe
Based on initial testing, this strategy has shown interesting results on the H1 Timeframe for the following assets:
Forex: EUR/AUD, EUR/CAD, EUR/USD, USD/JPY
Indices: US30 (Dow Jones)
Crypto: BTC/USD
Recommendation: Users should perform their own backtesting and parameter optimization to suit each specific asset and the market conditions at that time.
⚙️ Key Parameters
Risk per Trade (USD): The core of risk management; the maximum amount you are willing to lose on a single trade.
Risk/Reward Ratio: Defines your profit target relative to your stop loss (e.g., a value of 3 means the take profit is 3 times the risk).
Execution & Timeout Modes: Choose the entry style and expiration conditions that fit your trading approach.
Swing/Breakout Filter: Use the Lookback Period to adjust the filter's sensitivity (a higher value = fewer, but more significant, signals).
⚠️ Disclaimer
No Perfect Strategy: This strategy is not a "Holy Grail" and, like all strategies, is subject to losses.
Backtesting is in the Past: Past performance from backtests does not guarantee future results. Market conditions can and do change.
Risk Management is Crucial: This tool should be used in conjunction with sound personal risk management. Never risk more than you can afford to lose.
Optimization is Required: All users are strongly advised to conduct their own testing and optimization of the settings to fit the asset and timeframe they intend to trade before live deployment.

MACD Ignored Candle SignalsGBI AND RBI WITH MACD CONFIRMATION
Gives buy and sell signals based on a simple candlestick pattern that co-aligns with the macd momentum. earliest signals based on the trend are usually the best entries

Dynamic Grid StrategyThis strategy is a grid strategy. You can set the range of the highest price and the lowest price. The range setting can refer to backtesting. This strategy has the highest return rate when used for new coins. For the price of new coins, it is recommended to set the historical highest price, and the lowest price should be less than 10 times the highest price. This is only for reference. It performs differently in different time periods. Please conduct backtesting in different time periods before official use. The amount of each order should refer to the maximum drawdown value from backtesting in different periods. It is recommended that the total initial investment be greater than the maximum drawdown value during the backtesting period.

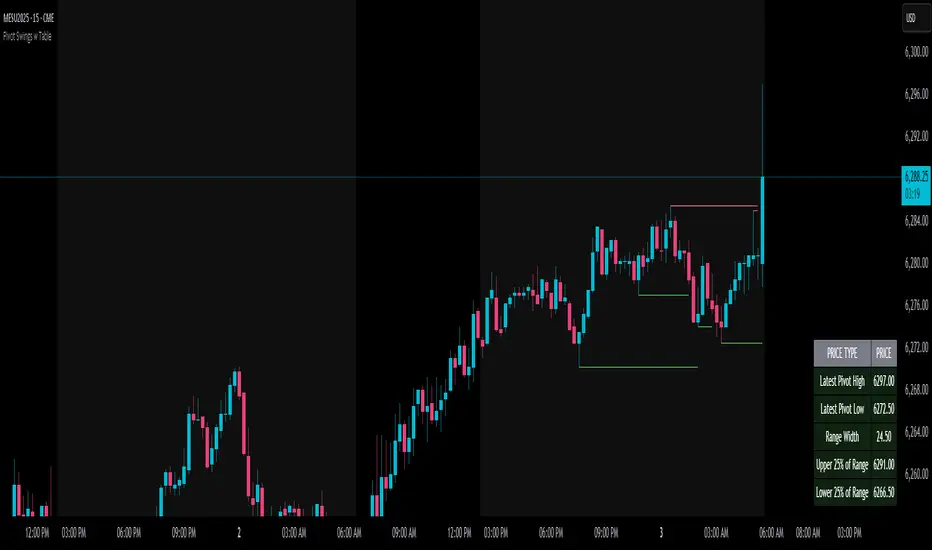
Pivot Swings w Table Pivot Swings w Table — Intraday Structure & Range Analyzer
This indicator identifies key pivot highs and lows on the chart and highlights market structure shifts using a real-time table display. It helps traders visually confirm potential trade setups by tracking unbroken swing points and measuring the range between the most recent pivots.
🔍 Features:
🔹 Automatic Pivot Detection using configurable left/right bar logic.
🔹 Unbroken Pivot Filtering — only pivots that haven't been invalidated by price are displayed.
🔹 Dynamic Range Table with:
Latest valid Pivot High and Pivot Low
Total Range Width
Upper & Lower 25% range thresholds (useful for value/imbalance analysis)
🔹 Trend-Based Color Coding — the table background changes based on which pivot (high or low) occurred more recently:
🟥 Red: Downward bias (last pivot was a lower high)
🟩 Green: Upward bias (last pivot was a higher low)
🔹 Optional extension of pivot levels to the right of the chart for support/resistance confluence.
⚙️ How to Use:
Adjust the Left Bars and Right Bars inputs to fine-tune how swings are defined.
Look for price reacting near the Upper or Lower 25% zones to anticipate mean reversion or breakout setups.
Use the trend color of the table to confirm directional bias, especially useful during consolidation or retracement periods.
💡 Best For:
Intraday or short-term swing traders
Traders who use market structure, support/resistance, or trend-based strategies
Those looking to avoid low-quality trades in tight ranges
✅ Built for overlay use on price charts
📈 Works on all symbols and timeframes
🧠 No repainting — pivots are confirmed with completed bars
StageCraft Pro – [Weinstein RS Analyze]StageCraft Pro – Weinstein RS Analyzer
For best results, use on a Weekly timeframe, but if you want to use a daily timeframe, then change the below parameters accordingly:
daily chart, set:
MA Length (Weeks) → 150
RS MA Length → 250
Key Features
Stan Weinstein Stage Detection
Detects all 4 market stages using MA slope and price position logic.
Mansfield Relative Strength (RS) Line
Accurately compares a stock’s performance against a customizable benchmark
Smart Commentary with Floating Label
Dynamic, adjustable label includes stage, bias, price distance from MA, RS trend, stage duration, and performance.
Color-Coded Visuals & Background
Clear MA slope coloring and optional stage background help quickly identify trends.
Stage Timeline & Weekly Gain Stats
Displays stage start-end dates and tracks gains during Stage 2 uptrends.
Guidelines for Use
Use on Weekly Charts for best accuracy (30-week MA logic).
Watch for Stage 2 + RS > 0 + Rising RS as a powerful breakout confirmation.
Interpret Mansfield RS:
Above 0 = Stock outperforming benchmark
Rising = Relative strength improving
Use in conjunction with volume, support/resistance, and overall market context.
Customize benchmark, RS color, font, and commentary label via settings.

TheDu Engulfing + vol20
// Volume filter settings
volumeLength = input.int(20, title="Volume MA Length", minval=1)
volumeThreshold = input.float(1.2, title="Volume Threshold (1.2 = 120%)", minval=1.0, step=0.1)
// Calculate volume moving average
volumeMA = ta.sma(volume, volumeLength)
// Volume condition: current volume > volume MA * threshold
volumeCondition = volume > volumeMA * volumeThreshold
// bullish engulfing with volume filter
bullishEngulfing = open > close ? close > open ? close >= open ? close >= open ? close - open > open - close ? volumeCondition ? color.blue : na : na : na : na : na : na
barcolor(bullishEngulfing)
// bearish engulfing with volume filter
bearishEngulfing = close > open ? open > close ? open >= close ? open >= close ? open - close > close - open ? volumeCondition ? color.purple : na : na : na : na : na : na
barcolor(bearishEngulfing)
alertcondition(bullishEngulfing != na, title='Bullish Engulfing', message=' , Bullish candle engulfing previous candle with high volume')
alertcondition(bearishEngulfing != na, title='Bearish Engulfing', message=' , Bearish candle engulfing previous candle with high volume')
// Optional: Plot volume MA for reference
plot(volumeMA, title="Volume MA", color=color.gray, display=display.none)

Simple v6 Moving‑Average TrendTo provide a visual guide for trend direction using EMA crossovers, supported by a dynamic trailing stop for potential exit zones. It shows whether the price is above or below a moving average and highlights shifts in trend with labeled signals and a stop-line.
⚙️ How It Works
1. EMA Calculation
It computes a single EMA (default: 20-period) from the current chart’s close price.
The EMA represents the short-term trend.


Trend vs Chop Detector - Stocky Mind ⚡️👉🏻 Fractal Efficiency Ratio – Stocky Mind ⚡
This indicator helps traders identify whether the market is trending or choppy using the Fractal Efficiency Ratio (FE) as described originally by Perry J. Kaufman in his book Trading Systems and Methods & by Pradeep Bonde.
👉🏻 What it does
Measures trend efficiency over a given period (length) by comparing net price change vs. cumulative absolute price change.
Higher FE values suggest linear (trending) price movement.
Lower FE values indicate choppiness or range-bound behaviour.
👉🏻 Key Features:
Fractal Efficiency Plot: Visualize trend clarity numerically.
Dynamic Background Zones:
Green: Strong linear trend (FE > threshold)
Red: Choppy market (FE < threshold)
Customizable thresholds for both trend and chop zones.
👉🏻 Use Case
Use this to filter stocks or confirm entries where price is moving smoothly.
Avoid low-efficiency (choppy) zones where breakout trades may fail.
👉🏻 Note
Best used in combination with price action and volume.
Higher timeframes may smooth out noisy behaviour.
Brought to you by Stocky Mind ⚡ – Simplifying setups with logic and clarity.
