Auto Fibonacci Extension and Retracement with Visual AlertsThis indicator automatically calculates and plots Fibonacci retracement and extension levels based on recent swing highs and lows, making it a powerful tool for traders who use Fibonacci analysis in their strategies.
Key Features:
• Dynamic Fibonacci Levels: Automatically detects swing highs and lows over a user-defined lookback period to calculate key Fibonacci retracement (e.g., 0.236, 0.382, 0.618, etc.) and extension (e.g., 1.618, 2.618, etc.) levels.
• Visual Alerts: Displays intuitive visual alerts when the price crosses important Fibonacci levels.
• Blue dashed lines for retracement levels.
• Green dashed lines for extension levels.
• Labels with up or down arrows indicating price interactions with these levels.
• Swing High/Low Visualization: Marks recent swing highs and lows with crosses for better clarity.
• Customizable: Adjust the lookback period and Fibonacci levels to suit your trading style.
Who is it for?
This indicator is perfect for:
• Swing Traders: To identify potential reversal or continuation zones.
• Day Traders: For short-term setups based on Fibonacci levels.
• Fibonacci Enthusiasts: To automate the time-consuming process of manually plotting levels.
Usage Ideas:
1. Use retracement levels (e.g., 0.618) to identify areas of potential support or resistance.
2. Use extension levels (e.g., 1.618) to target potential breakout or continuation zones.
3. Combine this indicator with candlestick patterns, volume analysis, or other tools for confirmation.
Limitations:
• This is a standalone indicator and does not provide buy/sell signals. It’s recommended to combine it with other technical analysis tools for best results.
• The lookback period and swing detection rely on past data, so adjustments may be needed based on the asset or timeframe.
Whether you’re looking to streamline your Fibonacci analysis or explore new opportunities in your trading, this indicator is designed to save time, increase accuracy, and enhance your overall trading experience.
Forecasting

TOL LANGIT ATR v7 - AI EnhancedThe TOL LANGIT ATR v7 is an adaptive technical indicator designed to identify market trends, support and resistance levels, and breakout points. It uses the Average True Range (ATR) and volatility to dynamically adjust trend bands, with visual markers for buy and sell signals. The indicator also highlights key support (blue) and resistance (orange) levels, and alerts users when these levels are broken. It’s perfect for trend following, breakout trading, and reversal strategies, and includes easy-to-set alerts for key market changes.

IU Range Trading StrategyIU Range Trading Strategy
The IU Range Trading Strategy is designed to identify range-bound markets and take trades based on defined price ranges. This strategy uses a combination of price ranges and ATR (Average True Range) to filter entry conditions and incorporates a trailing stop-loss mechanism for better trade management.
User Inputs:
- Range Length: Defines the number of bars to calculate the highest and lowest price range (default: 10).
- ATR Length: Sets the length of the ATR calculation (default: 14).
- ATR Stop-Loss Factor: Determines the multiplier for the ATR-based stop-loss (default: 2.00).
Entry Conditions:
1. A range is identified when the difference between the highest and lowest prices over the selected range is less than or equal to 1.75 times the ATR.
2. Once a valid range is formed:
- A long trade is triggered at the range high.
- A short trade is triggered at the range low.
Exit Conditions:
1. Trailing Stop-Loss:
- The stop-loss adjusts dynamically using ATR targets.
- The strategy locks in profits as the trade moves in your favor.
2. The stop-loss and take-profit levels are visually plotted for transparency and easier decision-making.
Features:
- Automated box creation to visualize the trading range.
- Supports one position at a time, canceling opposite-side entries.
- ATR-based trailing stop-loss for effective risk management.
- Clear visual representation of stop-loss and take-profit levels with colored bands.
This strategy works best in markets with defined ranges and can help traders identify breakout opportunities when the price exits the range.

Justice GameplanFibonacci Playbook: The Gridiron Indicator
This indicator doesn’t just mark levels—it’s your head coach, calling plays straight from the Fibonacci playbook to keep you ahead of the market’s defense. Here’s the game plan:
1. Scouting the Field:
It analyzes the last 180 bars like a seasoned scout, finding the *high-price MVP* and *low-price underdog* to set the boundaries of the game. This is your field—own it.
2. The Playbook:
- 50% Retracement (The Midfield Handoff):** The classic “let’s regroup and push forward” zone. Price often makes its comeback play here.
- 61.8% Retracement (The Sideline Route):** A tighter play—when price hits this zone, it’s like a running back juking defenders, setting up for a breakout move.
- 1.618 and 2.618 Extensions (Hail Mary Territory):** These are your end zones—when price reaches here, it’s all or nothing. You’re either scoring big or heading back to the locker room.
3. Game-Day Colors:
- Green Lines: Your offensive line—protecting your buy zones. Calm, calculated, and ready for a push.
- Red Lines: The defensive blitz—these levels warn, “You’ve hit resistance, time to adjust before you fumble.”
4. Signal Flags:
- Green Triangles (The Snap):The market signals a buy opportunity like a quarterback calling the perfect audible. It’s your chance to get in before the defense reacts.
- Red Triangles (The Sack): The market’s pressure is on—time to exit before the price gets tackled back to where it started.
5. End-to-End Game Vision:
The horizontal lines stretch across the chart like yard markers, setting the stage for price to march down the field—or get stopped cold by Fibonacci resistance.
This indicator is your ultimate play-caller, marking the critical zones where the market makes its big plays. Whether you’re running a steady offense or pulling off a last-minute Hail Mary, Fibonacci’s got your back. Time to suit up and dominate the trading field. 🏈

Wave Trend -V2Wave Trend -V2 is here to give you a serious edge.
This upgraded version of the popular LazyBear script takes wave trend analysis to the next level.
Here's the deal:
Multi-Timeframe Analysis: Beyond Short-Term Noise:
Novice traders often focus solely on the current timeframe (let's say, the 5-minute chart).
Wave Trend -V2 breaks free from this limitation by analyzing price action across multiple timeframes (1-minute to 1-week).
---This holistic view helps you:
Identify larger trends: Are we in a bullish uptrend on the daily chart, even if the hourly chart is showing some short-term weakness? Wave Trend -V2 helps you see the bigger picture.
Avoid false breakouts: Short-term price spikes can create false signals. By looking at higher timeframes, you can filter out these "noise" and focus on sustainable trends.
---Pressure Analysis: Gauging Market Strength:
Wave Trend -V2 goes beyond simple trend identification.
It incorporates "pressure" analysis to gauge the strength and direction of the current market trend.
This helps you:
Enter trades with confidence: When the trend is strong and the pressure is high, you can enter trades with greater conviction.
Minimize risk: If the pressure is waning or conflicting signals arise, you can avoid entering trades or adjust your risk parameters accordingly.
Impact Point Analysis: Predicting Future Price Moves:
Wave Trend -V2 analyzes the price impact of the last four wave trend crossovers.
Let's say the last impact point was "X", the previous one "X-1", the one before that "X-2", and so on.
The indicator calculates the average price movement between these points using the following simplified formula:
Average Impact = (X - X-1) + (X-1 - X-2) + (X-2 - X-3) / 3
This average provides a valuable estimate of the potential price movement of the next crossover.
Multiple Take Profit Levels: Setting Strategic Targets:
Wave Trend -V2 offers three dynamic take profit levels (TP1, TP2, TP3).
TP1: Based on the estimated average impact.
TP2: Twice the estimated average impact.
TP3: Three times the estimated average impact.
This allows you to set your profit targets strategically, maximizing potential gains while managing risk effectively.
Why don't use the Estmated impact point to stop the trade?
In order to eliminated the WHIPSAW effect! There is no other way...
Wave Trend -V2 is designed for traders who seek a deeper understanding of trend dynamics and desire a more sophisticated approach to trading. By combining multi-timeframe analysis, pressure assessment, and advanced impact point calculations, this indicator empowers you to make more informed trading decisions and potentially improve your trading outcomes.
The indicator work best with combination of other trend type indicators.
Please dont forget that indicators are not miracle medicines , it cannot give you exact results , market was always volative , use at your own discretion.
Crypto Market Confidence Period | viResearchCrypto Market Confidence Period | viResearch
Conceptual Foundation and Innovation
The "Crypto Market Confidence Period" indicator from viResearch offers traders a precise way to evaluate market conditions and identify safe investment periods in the crypto market. This tool combines market performance metrics across different assets and uses a dynamic approach to pinpoint periods of market confidence. By assessing historical performance and relative asset strength, the indicator classifies periods as either "safe" or "unsafe" for investment, helping traders make data-driven decisions. It is particularly useful for those looking to understand the cyclical nature of market trends and determine the optimal time for entering or exiting the market.
Technical Composition and Calculation
The "Crypto Market Confidence Period" indicator utilizes key market performance data, including price changes and historical trends, to evaluate the overall market climate. The core calculation involves comparing the system equity over a specified period (based on peak and nadir values) to determine periods of market confidence. The indicator calculates the highest and lowest points in system equity over a user-defined period, marking these as safe and unsafe periods. If the system equity reaches its highest value (peak), it indicates a "Safe Period" for investment, while a drop to its lowest value (nadir) signals an "Unsafe Period." These periods help traders assess when the market is more likely to experience mean reversion or continued trends.
Practical Applications
The "Crypto Market Confidence Period" indicator is designed to provide traders with a clear understanding of market conditions, specifically identifying safe and unsafe investment periods. By tracking system equity and evaluating market highs and lows, this tool can help traders make informed decisions about when to enter or exit trades. The key applications include:
Determining Mean Reversion Periods: The indicator highlights when the market is moving away from its average, signaling a potential mean reversion period. Traders can use this information to anticipate a reversal in market direction.
Identifying Trending Periods: When the market remains consistently in a "Safe Period," it may indicate that a trend is in motion, and the likelihood of continued price movement is higher. Traders can focus on trend-following strategies during these periods.
Advantages and Strategic Value
The "Crypto Market Confidence Period" indicator offers significant value by helping traders identify periods where market behavior is more predictable. This tool enhances trading strategies by distinguishing between periods of market stability (safe) and volatility (unsafe). Traders can use these insights to reduce risk during unsafe periods and capitalize on trends during safe periods.
Alerts and Visual Cues
The indicator includes alert conditions for both safe and unsafe periods. Alerts are triggered when the market enters a "Safe Period" or an "Unsafe Period," allowing traders to take action based on the market's current state. Additionally, the indicator provides visual cues, such as background color changes, to help traders quickly identify the market's condition and make timely decisions.
Summary and Usage Tips
The "Crypto Market Confidence Period" indicator is an invaluable tool for traders looking to manage risk and optimize their investment timing in the crypto market. By providing insights into market confidence, this indicator helps identify when the market is likely to revert to its mean or when a trend is likely to continue. Traders can use this tool to guide their decision-making, making it a versatile addition to any trading strategy.

Quarterly Divider The "Quarterly Divider" script draws vertical lines at the start of each quarter (January, April, July, October) on the Trading View chart. It also labels each line with the corresponding quarter (Q1, Q2, Q3, Q4) at the bottom of the line, making it easy to visualize the start of each trading quarter. The color and thickness of the lines are customizable
NB. works effectively is used on the weekly timeframe

Ichimoku MTF (best MTF 4H - Entry 15M)The Ichimoku Cloud is a collection of technical indicators that show support and resistance levels, as well as momentum and trend direction. It does this by taking multiple averages and plotting them on a chart. It also uses these figures to compute a “cloud” that attempts to forecast where the price may find support or resistance in the future.
The technical indicator shows relevant information at a glance by using averages.
The overall trend is up when the price is above the cloud, down when the price is below the cloud, and trendless or transitioning when the price is in the cloud.
Charles G. Koonitz. “Ichimoku Analysis & Strategies: The Visual Guide to Spot the Trends in Stock Market, Cryptocurrency and Forex Using Technical Analysis and Cloud Charts," Tripod Solutions Inc., 2019.
When Leading Span A is rising and above Leading Span B, this helps to confirm the uptrend and the space between the lines is typically colored green. When Leading Span A is falling and below Leading Span B, this helps confirm the downtrend. The space between the lines is typically colored red in this case.1
Traders will often use the Ichimoku Cloud as an area of support and resistance depending on the relative location of the price. The cloud provides support/resistance levels that can be projected into the future. This sets the Ichimoku Cloud apart from many other technical indicators that only provide support and resistance levels for the current date and time.
Traders should use the Ichimoku Cloud in conjunction with other technical indicators to maximize their risk-adjusted returns. For example, the indicator is often paired with the relative strength index (RSI), which can be used to confirm momentum in a certain direction. It’s also important to look at the bigger trends to see how the smaller trends fit within them. For example, during a very strong downtrend, the price may push into the cloud or slightly above it, temporarily, before falling again. Only focusing on the indicator would mean missing the bigger picture that the price was under strong longer-term selling pressure.
Crossovers are another way that the indicator can be used. Watch for the conversion line to move above the base line, especially when the price is above the cloud. This can be a powerful buy signal. One option is to hold the trade until the conversion line drops back below the base line. Any of the other lines could be used as exit points as well.

TRENDSYNC BUY/SELL BY SIMPLY_DANTE-FXTrendSync Buy and Sell Indicator
PS: Kindly give me feedback on the comment section, I will really appriciate
Created By: Simply_Dante-FX
About the Author:
Simply_Dante-FX is a skilled trader and developer with a focus on creating custom indicators and strategies for technical analysis. With a strong understanding of market behavior, he has designed the TrendSync Buy and Sell indicator to help traders identify high-probability buy and sell signals based on a combination of trend-following, momentum, and price action strategies. Simply_Dante-FX aims to provide tools that enhance trading decisions and improve the overall trading experience.
---
Description:
The TrendSync Buy and Sell indicator is designed to help traders identify potential buy and sell signals based on a combination of trend-following and momentum-based strategies. This custom indicator combines a range of technical tools, including the Simple Moving Average (SMA), Average True Range (ATR), and the Relative Strength Index (RSI), to filter and confirm entry points.
---
How It Works:
1. Trend Identification (SMA):
- The indicator uses the 200-period Simple Moving Average (SMA) to determine the overall trend direction.
- A Buy Signal is generated when the price is above the SMA, indicating an uptrend.
- A Sell Signal is generated when the price is below the SMA, indicating a downtrend.
2. Range Filtering (ATR):
- The Average True Range (ATR) is used to filter out signals that occur during periods of low volatility.
- The ATR is multiplied by a user-defined range filter multiplier (default is 1.2) to ensure the signal is coming from a sufficiently volatile market condition.
3. Momentum Confirmation (RSI):
- The RSI is used as a momentum filter. For Buy Signals, the RSI must be above the user-defined threshold (default is 50), indicating bullish momentum.
- For Sell Signals, the RSI must be below the opposite threshold (100 - RSI Threshold), indicating bearish momentum.
4.Price Action Conditions:
- Buy and Sell signals are further confirmed by price action:
- Buy Signal: Identifies higher lows during an uptrend.
- Sell Signal: Identifies higher highs during an uptrend, or lower highs in a downtrend.
5. Unified Signal:
- The script combines the various conditions to generate a unified signal, ensuring that only high-probability trade opportunities are highlighted.
How to Use It:
1.Buy Signal: Look for a green label below the bar, which indicates a potential buying opportunity. This signal is generated when:
- The price is above the 200-period SMA (uptrend).
- The RSI is above the defined threshold (momentum confirmation).
- The ATR-based range filter confirms sufficient market movement.
2. Sell Signal: Look for a red label above the bar, which indicates a potential selling opportunity. This signal is generated when:
- The price is below the 200-period SMA (downtrend).
- The RSI is below the defined threshold (momentum confirmation).
- The ATR-based range filter confirms sufficient market movement.
3. Visual Confirmation: The script also plots the 200-period SMA for easy identification of the overall trend direction.
4.Alert Setup: You can set up an alert using the “Unified Buy/Sell Alert” condition to notify you when a buy or sell signal is triggered.
Disclaimer:
- Risk Warning: The TrendSync Buy and Sell indicator is a tool for technical analysis and is not a guaranteed method for predicting market movements. Trading carries risk, and it is essential to use proper risk management techniques and not rely solely on any one indicator.
- No Financial Advice: This indicator does not constitute financial advice, and the author, Simply_Dante-FX, does not take responsibility for any trading losses or profits resulting from the use of this tool.
- Performance: Past performance is not indicative of future results. Always conduct your own analysis and use additional tools and strategies to confirm trade decisions.
Use this indicator with caution, and always ensure that you understand the risks involved in trading before committing real capital.

Best Buffett Ratio w/ Std-Dev Offset + Conditional PlotSummary:
This script provides a visually clear way to track the so-called “Buffett Ratio,”
a popular market valuation gauge which compares the total US stock market cap
to the country’s GDP. In addition, it plots a “hardcoded” long-term trend line,
along with fixed standard-deviation bands (in log space), and uses background colors
to signal potentially overvalued or undervalued zones.
What Is the Buffett Ratio?
Often credited to Warren Buffett, the Buffett Ratio (or Buffett Indicator) measures:
(Total US Stock Market Capitalization) / (US GDP)
• A higher ratio typically means equities are more expensive relative to the size of the economy.
• A lower ratio suggests equities may be more attractively valued compared to GDP.
Historically, the ratio has tended to drift upward over many decades,
as the US economy and stock markets grow, but it still oscillates around some trend over time.
How to Use
1) Add to Chart:
- In TradingView, simply apply the indicator (it internally fetches CRSPTM1 & GDP data).
2) Tweak Inputs:
- Log Offset for 1σ: Adjust how wide the ±1σ/±2σ bands appear around the trend.
- Anchor Points: Edit startYear , endYear , startRatio , endRatio
if you want a different slope or different “fair value” anchors.
3) Interpretation:
- If the indicator is above +2σ (red line) , it’s historically “very expensive,”
often leading to lower future returns over the long term.
- If it’s below –2σ (green line) , it’s historically “deep undervaluation,”
often pointing to better future returns over time.
- The intermediate zones show degrees of mild over- or undervaluation.
How This Script Works
1) Buffett Ratio Calculation:
- The script requests data from TradingView’s built-in CRSPTM1 index (total US market cap).
- It also requests US GDP data via request.economic("US", "GDP") .
- If GDP data is missing, the ratio becomes na on that bar.
2) Hardcoded Trend Line:
- Rather than a rolling average, the script uses two “anchors” (e.g. 1950 → 0.30 ratio, 2024 → 1.25 ratio)
and solves for a single log-growth rate to produce a steady upward slope.
3) Fixed Standard Deviations in Log Space:
- The script takes the log of the trend line, then applies a fixed offset for ±1σ and ±2σ,
creating proportional bands that do not “expand/contract” from a rolling window.
4) Conditional Plotting:
- The script only begins plotting once the Buffett Ratio actually has data (around 2011).
5) Color-Coded Zones:
- Above +2σ: red background (historically very expensive)
- Between +1σ and +2σ: yellow background (moderately expensive)
- Between –1σ and +1σ: no background color (around normal)
- Between –2σ and –1σ: aqua background (moderately undervalued)
- Below –2σ: green background (historically deep undervaluation)
Final Notes
• Data Limitations: US GDP data and CRSPTM1 only go back so far, so this starts around 2011.
• Long-Term vs. Short-Term: Best viewed on monthly/quarterly charts and interpreted over years.
• Tuning: If you believe structural changes have shifted the ratio’s fair slope,
adjust the code’s anchors or log offsets.
Enjoy, and use responsibly!

RSI OB/OS Strategy Analyzer█ OVERVIEW
The RSI OB/OS Strategy Analyzer is a comprehensive trading tool designed to help traders identify and evaluate overbought/oversold reversal opportunities using the Relative Strength Index (RSI). It provides visual signals, performance metrics, and a detailed table to analyze the effectiveness of RSI-based strategies over a user-defined lookback period.
█ KEY FEATURES
RSI Calculation
Calculates RSI with customizable period (default 14)
Plots dynamic overbought (70) and oversold (30) levels
Adds background coloring for OB/OS regions
Reversal Signals
Identifies signals based on RSI crossing OB/OS levels
Two entry strategies available:
Revert Cross: Triggers when RSI exits OB/OS zone
Cross Threshold: Triggers when RSI enters OB/OS zone
Trade Direction
Users can select a trade bias:
Long: Focuses on oversold reversals (bullish signals)
Short: Focuses on overbought reversals (bearish signals)
Performance Metrics
Calculates three key statistics for each lookback period:
Win Rate: Percentage of profitable trades
Mean Return: Average return across all trades
Median Return: Median return across all trades
Metrics calculated as percentage changes from entry price
Visual Signals
Dual-layer signal display:
BUY: Green triangles + text labels below price
SELL: Red triangles + text labels above price
Semi-transparent background highlighting in OB/OS zones
Performance Table
Interactive table showing metrics for each lookback period
Color-coded visualization:
Win Rate: Gradient from red (low) to green (high)
Returns: Green for positive, red for negative
Time Filtering
Users can define a specific time window for the indicator to analyze trades, ensuring that performance metrics are calculated only for the desired period.
Customizable Display
Adjustable table font sizes: Auto/Small/Normal/Large
Toggle option for table visibility
█ PURPOSE
The RSI OB/OS Strategy Analyzer helps traders:
Identify mean-reversion opportunities through RSI extremes
Backtest entry strategy effectiveness across multiple time horizons
Optimize trade timing through visual historical performance data
Quickly assess strategy robustness with color-coded metrics
█ IDEAL USERS
Counter-Trend Traders: Looking to capitalize on RSI extremes
Systematic Traders: Needing quantitative strategy validation
Educational Users: Studying RSI behavior in different market conditions
Multi-Timeframe Analysts: Interested in forward returns analysis

Breakout Detection using EMAs and Mansfield Relative StrengthThis script identifies breakout opportunities based on a combination of price action, volume, and relative strength. It is designed for daily timeframe charts and helps traders pinpoint strong bullish setups with the following criteria:
Price Action: Stock price is above both the 10-day EMA and 5-week EMA.
EMA Trends: The 10-day EMA is above the 20-day EMA, and the 5-week EMA is above the 10-week EMA, confirming bullish momentum.
Customizable Parameters: Customize the index for the Mansfield Relative Strength, the volume multiplier, and the price breakout look-back period.
Price Breakout: The price is at a 3-month high, indicating strength.
Volume Breakout: A volume spike occurs, surpassing the 20-day average volume by a user-defined multiplier.
Features:
Generates clear breakout signals with a green triangle below the bar.
Integrated Mansfield Relative Strength for relative performance analysis.
Alerts for when all conditions are met, ensuring you never miss an opportunity.
How to Use:
Add this script to a daily chart of your chosen stock.
Look for green triangle signals indicating a potential breakout.
Adjust the parameters to suit your trading strategy and preferred index for the Mansfield Relative Strength.
This tool is ideal for swing traders looking to combine technical analysis with relative strength metrics for high-conviction bullish setups.

Bollinger Bands Reversal Strategy Analyzer█ OVERVIEW
The Bollinger Bands Reversal Overlay is a versatile trading tool designed to help traders identify potential reversal opportunities using Bollinger Bands. It provides visual signals, performance metrics, and a detailed table to analyze the effectiveness of reversal-based strategies over a user-defined lookback period.
█ KEY FEATURES
Bollinger Bands Calculation
The indicator calculates the standard Bollinger Bands, consisting of:
A middle band (basis) as the Simple Moving Average (SMA) of the closing price.
An upper band as the basis plus a multiple of the standard deviation.
A lower band as the basis minus a multiple of the standard deviation.
Users can customize the length of the Bollinger Bands and the multiplier for the standard deviation.
Reversal Signals
The indicator identifies potential reversal signals based on the interaction between the price and the Bollinger Bands.
Two entry strategies are available:
Revert Cross: Waits for the price to close back above the lower band (for longs) or below the upper band (for shorts) after crossing it.
Cross Threshold: Triggers a signal as soon as the price crosses the lower band (for longs) or the upper band (for shorts).
Trade Direction
Users can select a trade bias:
Long: Focuses on bullish reversal signals.
Short: Focuses on bearish reversal signals.
Performance Metrics
The indicator calculates and displays the performance of trades over a user-defined lookback period ( barLookback ).
Metrics include:
Win Rate: The percentage of trades that were profitable.
Mean Return: The average return across all trades.
Median Return: The median return across all trades.
These metrics are calculated for each bar in the lookback period, providing insights into the strategy's performance over time.
Visual Signals
The indicator plots buy and sell signals on the chart:
Buy Signals: Displayed as green triangles below the price bars.
Sell Signals: Displayed as red triangles above the price bars.
Performance Table
A customizable table is displayed on the chart, showing the performance metrics for each bar in the lookback period.
The table includes:
Win Rate: Highlighted with gradient colors (green for high win rates, red for low win rates).
Mean Return: Colored based on profitability (green for positive returns, red for negative returns).
Median Return: Colored similarly to the mean return.
Time Filtering
Users can define a specific time window for the indicator to analyze trades, ensuring that performance metrics are calculated only for the desired period.
Customizable Display
The table's font size can be adjusted to suit the user's preference, with options for "Auto," "Small," "Normal," and "Large."
█ PURPOSE
The Bollinger Bands Reversal Overlay is designed to:
Help traders identify high-probability reversal opportunities using Bollinger Bands.
Provide actionable insights into the performance of reversal-based strategies.
Enable users to backtest and optimize their trading strategies by analyzing historical performance metrics.
█ IDEAL USERS
Swing Traders: Looking for reversal opportunities within a trend.
Mean Reversion Traders: Interested in trading price reversals to the mean.
Strategy Developers: Seeking to backtest and refine Bollinger Bands-based strategies.
Performance Analysts: Wanting to evaluate the effectiveness of reversal signals over time.

Quantum Edge 2.0Quantum Edge is a closed-source, invite-only indicator designed to detect shifts in market momentum using a unique blend of a Proprietary Noise-Reduction Technique and volatility measurements. It leverages a Proprietary Momentum-to-Volatility Measure along with a standard deviation-based threshold to highlight potential turning points in price behavior.
What Makes Quantum Edge Original
Noise-Reduction Technique
Quantum Edge applies a self-tuning filter that adapts its smoothing level to changing market dynamics. This approach aims to minimize false signals by focusing on meaningful price fluctuations while retaining responsiveness to sudden changes.
Volatility Assessment
A standard deviation–based filter is integrated to ensure signals occur only when price movements exceed a particular volatility threshold. This helps traders differentiate between normal price oscillations and more consequential market shifts.
How It Works (High-Level Overview)
Momentum & Volatility Interaction
A Momentum-to-Volatility Measure evaluates the movement volatility. This helps the indicator assess whether the market is trending strongly or merely oscillating sideways.
Noise-Reduction Technique
By changing its smoothing level dynamically, Quantum Edge works to reduce minor fluctuations without delaying significant trend changes.
Standard Deviation Threshold
The script calculates volatility envelopes to confirm that signals have exceeded statistically significant thresholds, aiming to improve reliability in both low-volatility and high-volatility conditions.
Signal Generation
Buy signals appear when short-term momentum breaks above the script’s volatility filter.
Sell signals emerge when momentum descends below the filter’s baseline.
How To Use
Chart Setup
Plot Quantum Edge on standard candle or bar charts to prevent unrealistic results.
Chart Settings
There are no setting in this indicator since it is programmed to work in all kinds of market and in all timeframes. I have personally used it on 2-min charts to weekly charts.
Catching big moves
This indicator tries to catch all the big moves and works of ETFs, commodities ETFs and stocks.
Shortcomings of Quantum Edge
It doesn't work on stocks/ETFs which have low liquidity or are micro caps and which have huge gaps on the upside and downside frequently.
Position Size and Stop loss and Profit Targets:
This indictor (buy/sell alerts ) should be used with proper stop loss and possibly at least 2 different position sizes. Since if you have 2 positions size or 2 halves you can take profit for 1st position size without waiting for a opposite signal to come.
You can also do 3 position sizes with same stop loss while exiting at 2 different profit targets and the last position size will wait for the opposite signal to come.
Labels: Since labels are for information purposes on charts you can change it in settings to not display
Interpreting Signals
A green triangle/label indicates a potential buy opportunity when the momentum surpasses a key volatility threshold.
A red triangle/label signals a potential sell (or short) setup if momentum falls below a defined threshold.
Alerts
Built-in alerts notify you when a new buy or sell signal appears. These alerts can be also sent to your primary and alternative emails. You can also attach the alerts to a webhook.
Best Practices & Warnings
No Future Data Used
All calculations are based on real-time or historical bars. The script does not look into future data.
No Guarantee of Future Performance
Market conditions are unpredictable; performance in the past does not guarantee future success.
Why Closed-Source?
Quantum Edge employs proprietary calculations and techniques to provide unique insights into market momentum. While we offer a clear description of how it works at a conceptual level, we keep the source code private to safeguard our intellectual property.
Usage Reminder
This script is invite-only; only users granted explicit access can apply it to their charts.
Quantum Edge is provided for informational and educational purposes. Always combine it with your own thorough analysis.
Please let me know if you have any questions in comments.

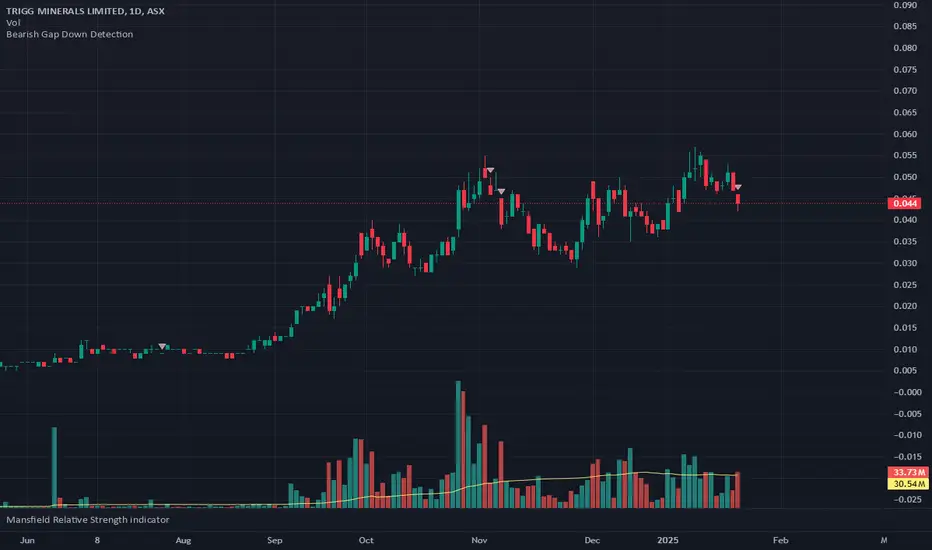
Bearish Gap Down DetectionThis indicator is designed to identify bearish gap downs in price action and visually mark them on your chart. A gap down occurs when today's opening price is below the previous day's low, and the closing price remains below that low, signaling a potential bearish continuation or reversal.
Features:
Precise Gap Down Detection: Identifies only confirmed bearish gap downs, avoiding false signals.
Clear Visual Markers: Marks detected gap downs with a red downward triangle above the bar for easy identification.
Minimalist Design: Focuses solely on gap down detection, without any reliance on moving averages or additional noise.
Use Cases:
Trend Reversals: Spot potential downward trends as they develop.
Momentum Confirmation: Use alongside other indicators or strategies to confirm bearish momentum.
Swing Trading Opportunities: Ideal for traders looking to capitalize on significant price movements.
How It Works:
The script detects a gap down when:
Today's opening price is below the previous day's low.
Today's closing price stays below the previous day's low.
When these conditions are met, the indicator plots a red triangle above the price bar, signaling a bearish gap down.
Best Practices:
Apply this script to daily or higher timeframes for more reliable results.
Combine it with other indicators, such as support/resistance levels or volume analysis, for enhanced decision-making.
Previous D, W, M High/LowThis indicator plots previous day's high,low,open and close values and plots previous week's and month's high and low value on the chart.
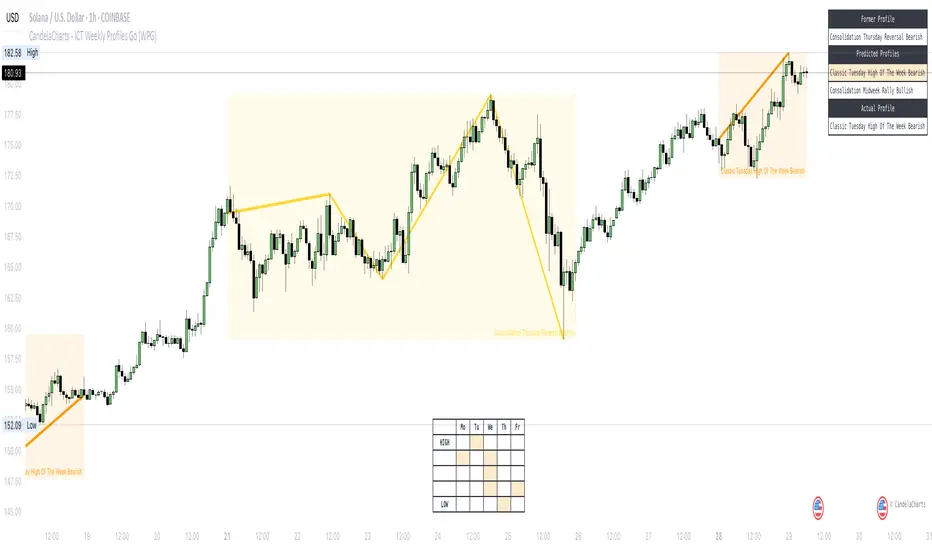
CandelaCharts - ICT Weekly Profiles Go (WPG) 📝 Overview
The indicator provides a pattern-based approach to the ICT Weekly Profiles, emphasizing a line that marks the Open, High, Low, and Close of the week. This line allows you to instantly visualize and identify the Weekly Profile.
ICT Weekly Profiles are structured conceptual frameworks designed to outline typical patterns of price behavior over the course of a trading week. These profiles serve as analytical tools, offering traders insights into recurring market tendencies and helping them identify potential opportunities and risks.
The toolkit automatically detects and marks these Weekly Profiles on the chart, enabling traders to quickly pinpoint critical zones for analysis and decision-making.
📦 Features
The Block Concepts toolkit offers a comprehensive set of features designed to enhance trading precision and decision-making. Key features include:
Weekly Profiles (8)
Advanced Styling
Scanner
The indicator supports the following profiles:
ICT Weekly Profiles
Classic Tuesday Low Of The Week Bullish
Classic Tuesday High Of The Week Bearish
Wednesday Low Of The Week Bullish
Wednesday High Of The Week Bearish
Consolidation Thursday Reversal Bullish
Consolidation Thursday Reversal Bearish
Consolidation Midweek Rally Bullish
Consolidation Midweek Rally Bearish
⚙️ Settings
History: Controls how many profiles are displayed on the chart.
Timeframe Limit: Sets the timeframe up to which profiles will be drawn.
Show OHLC Lines: Display the lines for OHLC.
Show Profile Line: Display the Weekly Profile line.
Use NY Midnight Open: Controls from where a profile will start detection.
Open: Style for Open line.
High: Style for High line.
Low: Style for Low line.
Midline: Style for Profile Midline.
Label: Controls the position of the Weekly Profile name.
Scanner: Display the Scanner
⚡️ Showcase
ICT (Inner Circle Trader) weekly profile templates are analytical frameworks that categorize and describe typical patterns of price action observed during a trading week.
ICT Weekly Profiles
Scanner
📒 Usage
The primary objective of the ICT Weekly Profiles indicator is to provide traders with a comprehensive and actionable overview of the Weekly Previous, Current, and Future Profile. This allows traders to interpret market structure, anticipate price behavior, and align their trading decisions with higher time-frame trends.
Load the indicator on the chart
Enable Scanner
See the Predicted Profiles list
Predicted Profiles represent all potential scenarios for the current week, generated by a profile detection algorithm.
By visualizing potential outcomes through Predicted Profiles, the ICT Weekly Profiles indicator provides traders with a strategic edge, allowing them to remain flexible, prepared, and aligned with the most probable market movements.
🚨 Alerts
The indicator does not provide any alerts!
🔹 Notes
ICT Weekly Profiles
pbs.twimg.com
⚠️ Disclaimer
Trading involves significant risk, and many participants may incur losses. The content on this site is not intended as financial advice and should not be interpreted as such. Decisions to buy, sell, hold, or trade securities, commodities, or other financial instruments carry inherent risks and are best made with guidance from qualified financial professionals. Past performance is not indicative of future results.
CandelaCharts - ICT Daily Profiles📝 Overview
The ICT Daily Profiles by CandelaCharts rooted in the ICT teachings represent a pattern-based approach to trading that focuses on identifying and analyzing the key highs and lows of various intraday trading sessions.
The toolkit automatically detects and marks these ICT Daily Profiles on the chart, enabling traders to quickly pinpoint critical zones for analysis and decision-making.
Whether you are a seasoned professional or a developing trader, ICT Daily Profiles provides actionable frameworks to enhance your understanding of price dynamics and improve your intraday trading performance.
📦 Features
The ICT Daily Profiles toolkit offers a comprehensive set of features designed to enhance trading precision and decision-making. Key features include:
Daily Profiles
Advanced Styling
Scanner
The indicator supports the following profiles:
Session I High Session II Low Bearish
Session I High Session III Low Bearish
Session I High Session IV Low Bearish
Session II High Session III Low Bearish
Session II High Session IV Low Bearish
Session III High Session IV Low Bearish
Session I Low Session II High Bullish
Session I Low Session III High Bullish
Session I Low Session IV High Bullish
Session II Low Session III High Bullish
Session II Low Session IV High Bullish
Session III Low Session IV High Bullish
Session I High Session I Low Bearish
Session I Low Session I High Bearish
Session II High Session II Low Bearish
Session II Low Session II High Bearish
Session III High Session III Low Bearish
Session III Low Session III High Bearish
Session IV High Session IV Low Bearish
Session IV Low Session IV High Bearish
⚙️ Settings
Sessions: Controls how many sessions you want to see.
History: Controls how many profiles are displayed on the chart.
Timeframe Limit: Sets the timeframe up to which profiles will be drawn.
Show OHLC Lines: Display the lines for OHLC.
Show Profile Line: Display the Daily Profile line.
Use NY Midnight Open: Controls from where a profile will start detection.
Open: Style for Open line.
High: Style for High line.
Low: Style for Low line.
Midline: Style for Profile Midline.
Label: Controls the position of the Daily Profile name.
Scanner: Display the Scanner
⚡️ Showcase
ICT (Inner Circle Trader) daily profile templates are analytical frameworks that categorize and describe typical patterns of price action observed during a trading day.
ICT Daily Profiles
Scanner
📒 Usage
The ICT Daily Profiles indicator aims to give traders a clear and actionable view of the Daily Previous, Current, and Future Profiles. This enables them to analyze market structure, predict price movements, and align their trading strategies with higher time-frame trends.
Load the indicator on the chart
Enable Scanner
See the Predicted Profiles list
Predicted Profiles represent all potential scenarios for the current day, generated by a profile detection algorithm.
By visualizing potential outcomes through Predicted Profiles, the ICT Daily Profiles indicator provides traders with a strategic edge, allowing them to remain flexible, prepared, and aligned with the most probable market movements.
🚨 Alerts
The indicator does not provide any alerts!
🔹 Notes
ICT Daily Profiles
pbs.twimg.com
⚠️ Disclaimer
These tools are exclusively available on the TradingView platform.
Our charting tools are intended solely for informational and educational purposes and should not be regarded as financial, investment, or trading advice. They are not designed to predict market movements or offer specific recommendations. Users should be aware that past performance is not indicative of future results and should not rely on these tools for financial decisions. By using these charting tools, the purchaser agrees that the seller and creator hold no responsibility for any decisions made based on information provided by the tools. The purchaser assumes full responsibility and liability for any actions taken and their consequences, including potential financial losses or investment outcomes that may result from the use of these products.
By purchasing, the customer acknowledges and accepts that neither the seller nor the creator is liable for any undesired outcomes stemming from the development, sale, or use of these products. Additionally, the purchaser agrees to indemnify the seller from any liability. If invited through the Friends and Family Program, the purchaser understands that any provided discount code applies only to the initial purchase of Candela's subscription. The purchaser is responsible for canceling or requesting cancellation of their subscription if they choose not to continue at the full retail price. In the event the purchaser no longer wishes to use the products, they must unsubscribe from the membership service, if applicable.
We do not offer reimbursements, refunds, or chargebacks. Once these Terms are accepted at the time of purchase, no reimbursements, refunds, or chargebacks will be issued under any circumstances.
By continuing to use these charting tools, the user confirms their understanding and acceptance of these Terms as outlined in this disclaimer.

CandelaCharts - ICT Weekly Profiles📝 Overview
The indicator provides a pattern-based approach to the ICT Weekly Profiles, emphasizing a line that marks the Open, High, Low, and Close of the week. This line allows you to instantly visualize and identify the Weekly Profile.
The profile detection relies on the week’s high and low, delivering a clear and concise representation of the weekly profile.
ICT Weekly Profiles are structured conceptual frameworks designed to outline typical patterns of price behavior over the course of a trading week. These profiles serve as analytical tools, offering traders insights into recurring market tendencies and helping them identify potential opportunities and risks.
The ICT Weekly Profiles indicator offers two distinct types of profiles to provide a clearer understanding of weekly price action:
ICT Weekly Profiles
ICT Missing Weekly Profiles
The toolkit automatically detects and marks these ICT Weekly Profiles and ICT Missing Weekly Profiles on the chart, enabling traders to quickly pinpoint critical zones for analysis and decision-making.
📦 Features
The ICT Weekly Profiles toolkit offers a comprehensive set of features designed to enhance trading precision and decision-making. Key features include:
Weekly Profiles
Missing Weekly Profiles
Advanced Styling
Scanner
The indicator supports the following profiles:
ICT Weekly Profiles
Classic Tuesday Low Of The Week Bullish
Classic Tuesday High Of The Week Bearish
Wednesday Low Of The Week Bullish
Wednesday High Of The Week Bearish
Consolidation Thursday Reversal Bullish
Consolidation Thursday Reversal Bearish
Consolidation Midweek Rally Bullish
Consolidation Midweek Rally Bearish
Wednesday Weekly Reversal Bullish
Wednesday Weekly Reversal Bearish
Seek And Destroy Bullish Friday
Seek And Destroy Bearish Friday
ICT Missing Weekly Profiles
Monday Low Tuesday High Bullish
Monday High Tuesday Low Bearish
Monday Low Wednesday High Bullish
Monday High Wednesday Low Bearish
Monday Low Thursday High Bullish
Monday High Thursday Low Bearish
Tuesday Low Wednesday High Bullish
Tuesday High Wednesday Low Bearish
Tuesday Low Friday High Bullish
Tuesday High Friday Low Bearish
Wednesday Low Thursday High Bullish
Wednesday High Thursday Low Bearish
Monday Low Friday High Bullish
Monday Friday Bearish Rally
Monday High/Low Range
Tuesday High/Low Range
Wednesday High/Low Range
Thursday High/Low Range
Friday High/Low Range
⚙️ Settings
History: Controls how many profiles are displayed on the chart.
Timeframe Limit: Sets the timeframe up to which profiles will be drawn.
Show OHLC Lines: Display the lines for OHLC.
Show Profile Line: Display the Weekly Profile line.
Use NY Midnight Open: Controls from where a profile will start detection.
Open: Style for Open line.
High: Style for High line.
Low: Style for Low line.
Midline: Style for Profile Midline.
Label: Controls the position of the Weekly Profile name.
Scanner: Display the Scanner
⚡️ Showcase
ICT (Inner Circle Trader) weekly profile templates are analytical frameworks that categorize and describe typical patterns of price action observed during a trading week.
ICT Weekly Profiles
ICT Missing Weekly Profiles
Scanner
📒 Usage
The primary objective of the ICT Weekly Profiles indicator is to provide traders with a comprehensive and actionable overview of the Weekly Previous, Current, and Future Profile. This allows traders to interpret market structure, anticipate price behavior, and align their trading decisions with higher time-frame trends.
Load the indicator on the chart
Enable Scanner
See the Predicted Profiles list
Predicted Profiles represent all potential scenarios for the current week, generated by a profile detection algorithm.
By visualizing potential outcomes through Predicted Profiles, the ICT Weekly Profiles indicator provides traders with a strategic edge, allowing them to remain flexible, prepared, and aligned with the most probable market movements.
🚨 Alerts
The indicator does not provide any alerts!
🔹 Notes
ICT Weekly Profiles
pbs.twimg.com
ICT Missing Weekly Profiles
pbs.twimg.com
⚠️ Disclaimer
These tools are exclusively available on the TradingView platform.
Our charting tools are intended solely for informational and educational purposes and should not be regarded as financial, investment, or trading advice. They are not designed to predict market movements or offer specific recommendations. Users should be aware that past performance is not indicative of future results and should not rely on these tools for financial decisions. By using these charting tools, the purchaser agrees that the seller and creator hold no responsibility for any decisions made based on information provided by the tools. The purchaser assumes full responsibility and liability for any actions taken and their consequences, including potential financial losses or investment outcomes that may result from the use of these products.
By purchasing, the customer acknowledges and accepts that neither the seller nor the creator is liable for any undesired outcomes stemming from the development, sale, or use of these products. Additionally, the purchaser agrees to indemnify the seller from any liability. If invited through the Friends and Family Program, the purchaser understands that any provided discount code applies only to the initial purchase of Candela's subscription. The purchaser is responsible for canceling or requesting cancellation of their subscription if they choose not to continue at the full retail price. In the event the purchaser no longer wishes to use the products, they must unsubscribe from the membership service, if applicable.
We do not offer reimbursements, refunds, or chargebacks. Once these Terms are accepted at the time of purchase, no reimbursements, refunds, or chargebacks will be issued under any circumstances.
By continuing to use these charting tools, the user confirms their understanding and acceptance of these Terms as outlined in this disclaimer.

XAUMOvisionXAUMOvision: T he XAU/USD Composite Correlation Indicator with Weighted Spillover & Dynamic Lines
XAUMOvision is a custom-built trading indicator designed to track the intricate relationship between XAU/USD (Gold) and key economic factors: DXY (US Dollar Index), US Treasury Yields, S&P 500, and Crude Oil. By blending correlation metrics with weighted spillover effects, XAUMOvision offers actionable insights to refine your Gold trading strategy.
Core Features of XAUMOvision
1. Correlation (CC)
Definition: Measures how closely two assets move together over a given period.
Calculation: Pearson Correlation is used to assess Gold's relationship with:
DXY: Negative correlation—when DXY rises, Gold typically falls.
US Treasury Yields: Negative correlation—higher yields reduce Gold’s appeal.
S&P 500: Opposite movement, as Gold acts as a safe-haven.
Crude Oil: Positive correlation—both often rise during inflationary pressures.
2. Weighted Spillover
What It Does: Quantifies how movements in each asset (DXY, Yields, etc.) influence Gold.
Weighting: User-defined values (e.g., DXY weight = 0.4) scale each factor’s impact.
Result: A total spillover score reveals bullish or bearish sentiment for XAU/USD.
3. Composite Bias Line
Purpose: Consolidates spillover impacts into a single sentiment indicator.
Readings:
Strong Bullish: Composite Bias > 0.5.
Neutral: Close to 0.
Strong Bearish: Composite Bias < -0.5.
Output: A directional bias to guide your trading decisions.
4. Traffic Signal Line
Visual Cues:
Green: Strong Bullish Signal.
Red: Strong Bearish Signal.
Gray: Neutral—avoid trading.
Utility: A quick, color-coded overview of market conditions.
Using XAUMOvision Effectively
When to Use
During high volatility or major news events (e.g., CPI, interest rate decisions).
To understand macroeconomic forces driving Gold’s price action.
Recommended Timeframes
4-Hour: Ideal for swing traders seeking medium-term setups.
Daily: Perfect for macro trend analysis.
Weekly: Suitable for long-term investors aligning with broader trends.
---------------------------------------------------------------------------------
Practical Example
Monday, January 13, 2025 (Neutral Market)
Market Behavior: Gold stagnated (-0.96%), with low volume (681.13K).
Indicator Insights:
Composite Spillover: -0.92 (mild bearish pressure).
Traffic Signal Line: Gray—stay out of the market.
Bias Line: Weak Bearish (-1), signaling no strong trend.
Result: XAUMOvision kept traders from entering a choppy, low-volume market.
Wednesday, January 15, 2025 (CPI-Driven Rally)
CPI Release: Core CPI softer than expected (0.2% vs. 0.3%), weakening the DXY and Yields. Gold surged.
Indicator Insights:
Composite Spillover: +0.57 (strong bullish sentiment).
Traffic Signal Line: Green—clear buy signal.
Bias Line: Strong Bullish (+2), confirming the trend.
Result: Traders aligned with institutional flows and profited from the CPI-driven rally.
--------------------------------------------------------------------------------
Why XAUMOvision Stands Out
Avoids Bad Trades: Neutral signals and low-volume days keep you sidelined during indecisive markets.
Pinpoints Big Moves: Green signals during high-impact events help you capitalize on major trends.
Volume Validation: Confirms institutional activity to distinguish real trends from fakeouts.
Conclusion: Trade Like a Pro
XAUMOvision blends macroeconomic analysis with real-time technical indicators, ensuring you stay ahead of market moves. Whether navigating neutral markets or CPI-driven surges, this tool provides clarity and confidence in your trading decisions. For swing traders and macro enthusiasts, XAUMOvision is the ultimate weapon in Gold trading.

US30 Q4_trade _levels_Jan2025updated description and use
US30 Trade Levels.plus 50% take profit levels
this indicator is based on the US30 quarterly theory level strategy
the difference here is that the zones have been zoom'd out for the H2 view for oversight and M30 as application theory to the Q4 levels.
The Q4 levels are spaced and calculated 385 pips apart, and also span within the daily ADR range for US30.
so these are zones that has proven to be valid going back as far as Nov2022
these are pass through levels, to together with other confluences like order blocks and or breaker blocks, will give you a guideline as to expect a valid zone of interest.
USE this indicator in conjunction with an SMC point of view to identify OB & CHOCH

Liquidity Trading Algorithm (LTA)
The Liquidity Trading Algorithm is an algorithm designed to provide trade signals based on
liquidity conditions in the market. The underlying algorithm is based on the Liquidity
Dependent Price Movement (LDPM) metric and the Liquidity Dependent Price Stability (LDPS)
algorithm.
Together, LDPM and LDPS demonstrate statistically significant forecasting capabilities for price-
action on equities, cryptocurrencies, and futures. LTA takes these liquidity measurements and
translates them into actionable insights by way of entering or exiting a position based
on the future outlooks, as measured by the current liquidity status.
The benefit of LTA is that it can incorporate these powerful liquidity measurements into
actionable insights with several features designed to help you tailor LTA's behavior and
measurements to your desired vantage point. These customizable features come by the way of determining LTA's assessment style, and additional monitoring systems for avoiding bear and bull traps, along with various other quality of life features, discussed in more detail below.
First, a few quick facts:
- LTA is compatible on a wide array of instruments, including Equities, Futures, Cryptocurrencies, and Forex.
- LTA is compatible on most intervals in so long as the data can be calculated appropriately,
(be sure to do a backtest on timescales less than 1-minue to ensure the data can be computed).
- LTA only measures liquidity at the end of the interval of the chart chosen, and does not respond to conditions during the candle interval, unless specified (such as with `Stops`).
- LTA is interval-dependent, this means it will measure and behave differently on different
intervals as the underlying algorithms are dependent on the interval chosen.
- LTA can utilize fractional share sizing for cryptocurrencies.
- LTA can be restricted to either bullish or bearish indications.
- Additional Monitoring Systems are available for additional risk mitigation.
In short, LTA is a widely applicable, unique algorithm designed to translate liquidity measurements into liquidity insights.
Before getting more into the details, here is a quick list of the main features and settings
available for customization:
- Backtesting Start Date: Manual selection of the start date for the algorithm during backtesting.
- Assessment Style: adjust how LDPM and LDPS measure and respond to changes in liquidity.
- Impose Wait: force LTA to wait before entering or exiting a position to ensure conditions have remained conducive.
- Trade Direction Allowance: Restrict LTA to only long or only short, if desired.
- Position Sizing Method: determine how LTA calculates position sizing.
- Fractional Share Sizing: allow LTA to calculate fractional share sizes for cryptocurrencies
- Max Size Limit: Impose a maximum size on LTA's positions.
- Initial Capital: Indicate how much capital LTA should stat with.
- Portfolio Allotment: Indicate to LTA how much (in percentages) of the available balance should be considered when calculating position size.
- Enact Additional Monitoring Systems: Indicate if LTA should impose additional safety criteria when monitoring liquidity.
- Configure Take Profit, Stop-Loss, Trailing Stop Loss
- Display Information tables on the current position, overall strategy performance, along
with a text output showing LTA's processes.
- Real-time text output and updates on LTA's inner workings.
Let's get into some more of the details.
LTA's Assessment Style
LTA's assessment style determines how LTA collects and responds to changing data. In traditional terms, this is akin to (but not quite exactly the same as) the sensitivity versus specificity spectrum, whereby on one end (the sensitive end), an algorithm responds to changes in data in a reactive manner (which tends to lower its specificity, or how often it is correct in its indications), and on the other end, the opposite one, the algorithm foresakes quick changes for longevity of outlook.
While this is in part true, it is not a full view of the underlying mechanisms that changing the assessment style augments. A better analogy would be that the sensitive end of the spectrum (`Aggressive`) is in a state such that the algorithm wants to changing its outlooks, and as such, with changes in data, the algorithm has to be convinced as to why that is not a good idea to change outlooks, whereas the the more specific states (`Conservative`, `Diamond`) must be convinced that their view is no longer valid and that it needs to be changed.
This means the `Aggressive` and the `Diamond` settings fundamentally differ not just in their
data collection, but also in the data processing such that the `Aggressive` decision tree has to
be convinced that the data is the same (as its defualt is that it has changed),
and the `Diamond` decision tree has to be convinced that the data is not the same, and as such, the outlook need changed.
From there, the algorithm cooks through the data and determines to what the outlook should be changed to, given the current state of liquidity.
`Balanced` lies in the middle of this balance, attempting to balance being open to new ideas while not removing the wisdom of the past, as it were.
On a scale of most `sensitive` to most `specific`, it is as follows: `Aggressive`, `Balanced`,
`Conservative`, `Diamond`.
Functionally, these different modes can help in different liquidity environments, as certain
environments are more conducive to an eager approach (such as found near `Aggressive`) or are more conducive to a more conservative approach, where sudden changes in liquidity are known to be short-lived and unremarkable (such as many previously identified bull or bear traps).
For instance, on low interval views, it can often-times be beneficial to keep the algorithm towards the `Sensitive` end, since on the lower-timeframes, the crosswinds can change quite dramatically; whereas on the longer intervals, it may be useful to maintain a more `Specific` algorithm (such as found near `Diamond` mode) setting since longer intervals typically lend themselves to longer time-horizons, which themselves typically lend themselves to "weathering the storm", as it were.
LTA's Assessment Style is also supported by the Additional Monitoring Systems which works
to add sensitivity without sacrificing specificity by enacting a separate monitoring system, as described below.
Additional Monitoring Systems
The Additional Monitoring System (AMS) attempts to add more context to any changes in liquidity conditions as measured, such that LTA as a whole will have an expanded view into any rapidly changing liquidity conditions before these changes manifest in the traditional data streams. The ideal is that this allows for early exits or early entrances to positions "a head of time".
The traditional use of this system is to indicate when liquidity is suggestive of the end of a particular run (be it a bear run or a bull run), so an early exit can be initiated (and thus,
downside averted) even before the data officially showcase such changes. In such cases (when AMS becomes activated), the algorithm will signal to exit any open positions, and will restrict the opening of any new positions.
When a position is exited because of AMS, it is denoted as an `Early Exit` and if a position is prevented from being entered, the text output will display `AM prevented entry...` to indicate that conditions are not meeting AMS' additional standards.
The algorithm will wait to make any actions while `AMS` is `active` and will only enter into a new position once `AMS` has been `deactivated` and overall liquidity conditions are appropriate.
Functionally, the benefits of AMS translate to:
- Toggeling AMS on will typically see a net reduction in overall profitability, but
- AMS will typically (almost always) reduce max drawdown,
an increases in max runup, and increase return-over-maxdrawdown, and
- AMS can provide benefit for equities that experience a lot of "traps" by navigating early
entrance and early exits.
So in short, AMS is way of adding an additional level of liquidity monitoring that attempts to
exit positions if conditions look to be deteriorating, and to enter conditions if they look to be
improving. The cost of this additional monitoring, however, is a greater number of trades indicated, and a lower overall profitability.
Impose Wait
Note: `Impose Wait` will not force Take Profit, Stop Loss, or Trailing Stop Loss to
wait.
LTA can be indicated to `wait` before entering or exiting a position if desired. This means that if conditions change, whereas without a `wait` imposed, the algorithm would immediately indicate this change via a signal to alter the strategy's position, with a `wait` imposed, the algorithm will `wait` the indicated number of bars, and then re-check conditions before proceeding.
If, while waiting, conditions change to a state that is no longer compatible with the "order-in-
waiting", then the order-in-waiting is removed, and the counts reset (i.e.: conditions must remain favorable to the intended positional change throughout the wait period).
Since LTA works at the end-of-intervals, there is an inherently "built-in" wait of 1 bar when
switching directly from long to short (i.e.: if a full switch is indicated, then it is indicated as
conditions change -> exit new position -> wait until -> check conditions ->
enter new position as indicated). Thus, to impose a wait of `1 bar` would be to effectively have a total of two candles' ends prior to the entrance of the new position).
There are two main styles of `Impose Wait` that you can utilize:
- `Wait` : this mode will cause LTA to `wait` when both entering and exiting a position (in so long as it is not an exit signaled via a Take Profit, Stop Loss or Trailing Stop Loss).
- `Exit-Wait` : This mode will >not< cause LTA to `wait` if conditions require the closing of a position, but will force LTA to wait before entering into a position.
Position:
In addition to the availability to restrict LTA to either a long-only or short-only strategy, LTA
also comprises additional flexibility when deciding on how it should navigate the markets with
regards to sizing. Notably, this flexibility benefits several aspects of LTA's existence, namely the ability to determine the `Sizing Method`, or if `Fractional Share Sizing` should be employed, and more, as discussed below.
Position Sizing Method
There are two main ways LTA can determine the size of a position. Either via the `Fixed-Share` choice, or the `Fixed-Percentage` choice.
- `Fixed-Share` will use the amount indicated in the `Max Sizing Limit` field as the position size, always.
Note: With `Fixed-Share` sizing, LTA will >not< check if the balance is sufficient
prior to signaling an entrance.
- `Fixed-Percentage` will use the percentage amount indicated in the `Portfolio Allotment` field as the percentage of available funds to use when calculating the position size. Additionally, with the `Fixed-Percentage` choice, you can set the `Max Sizing Limit` if desired, which will ensure that no position will be entered greater than the amount indicated in the field.
Fractional Share Sizing
If the underlying instrument supports it (typically only cryptocurrencies), share sizing can be
fractionalized. If this is done, the resulting positin size is rounded to `4 digits`. This means any
position with a size less than `0.00005` will be rounded to `0.0000`
Note: Ensure that the underlying instrument supports fractional share sizing prior
to initiating.
Max Sizing Limit
As discussed above, the `Max Sizing Limit` will determine:
- The position size for every position, if `Sizing Method : Fixed-Share` is utilized, or
- The maximum allowed size, regardless of available capital, if `Sizing Method : Fixed-Percentage` is utilized.
Note: There is an internal maximum of 100,000 units.
Initial Capital
Note: There are 2 `Initial Capital` settings; one in LTA's settings and one in the
`Properties` tab. Ensure these two are the same when doing backtesting.
The initial capital field will be used to determine the starting balanace of the strategy, and
is used to calculate the internal data reporting (the data tables).
Portfolio Allotment
You can specify how much of the total available balance should be used when calculating the share size. The default is 100%.
Stops
Note: Stops over-ride `AMS` and `Impose Wait`, and are not restricted to only the
end-of-candle and will occur instantaneously upon their activation. Neither `AMS` nor `Impose Wait` can over-ride a signal from a `Take-Profit`, `Stop-Loss`, or a `Trailing-Stop Loss`.
LTA enhouses three stops that can be configured, a `Take-Profit`, a `Stop-Loss` and a `Trailing-Stop Loss`. The configurations can be set in the settings in percent terms. These exit signals will always over-ride AMS or any other restrictions on position exit.
Their configuration is rather standard; set the percentages you want the signal to be sent at and so it will be done.
Some quick notes on the `Trailing-Stop Loss`:
- The activation percentage must be reached (in profits) prior to the `Traililng-Stop Loss`
from activating the downside protection. For example, if the `Activation Percentage` is 10%, then unless the position reaches (at any point) a 10% profit, then it will not signal any exits on the downside, should it occur.
- The downside price-point is continuously updated and is calculated from the maximum profit reached in the given position and the loss percentage placed in the appropriate field.
Data Tables and Data Output
LTA provides real-time data output through a variety of mechanisms:
- `Position Table`
The `Position Table` displays information about the current position, including:
> Position Duration : how long the position has been open for.
> Indicates if the side is Long or Short, depending on if it is long or short.
> Entry Price: the price the position was entered at.
> Current Price (% Dif): the current price of the underlying and the %-difference between the entry price and the current price.
> Max Profit ($/%): the maximum profit reached in $ and % terms.
> Current PnL ($/%) : the current PnL for the open position.
- `Performance Table`
The `Performance Table` displays information regarding the overall performance of the algorithm since its `Start Date`. These data include:
> Initial Equity ($): The initial equity the algorithm started with.
> Current Equity ($): The current total equity of the account (including open positions)
> Net Profits ($|%) : The overall net profit in $ and % terms.
> Long / Short Trade Counts: The respective trade counts for the positions entered.
> Total Closed Trades: The running sum of the number of trades closed.
> Profitability: The calculation of the number of profitable trades over the total number of
trades.
> Avg. Profit / Trade: The calculation of the average profit per trade in both $ and % terms.
> Avg. Loss / Trade: The calculation of the average loss per trade in both $ and % terms.
> Max Run-Up: The maximum run-up the algorithm has seen in both $ and % terms.
> Max Drawdown: The maximum draw-down the algorithm has seen in both $ and % terms.
> Return-Over-Max-Drawdown: the ratio of the maximum drawdown against the current net profits.
- `Text Output`
LTA will output, if desired, signals to the text output field every time it analysis or performs and action. These messages can include information such as:
"
08:00:00 >> AM Protocol activated ... exiting position ...
08:00:00 >> Exit Order Created for qty: 2, profit: 380 (4.34%)
...
09:30:00 >> Checking conditions ...
09:30:00 >> AM protocol prevented entry ... waiting ...
"
This way, you can keep an eye out on what is happening "under the hood", as it were.
LTA will produce a message at the end of its assessment at the end of each candle interval, as well as when a position is exited due to a `Stop` or due to `AMS` being activated.
Additionally, the `Text Output` includes a initial message, but for space-constraints, this
can be toggled off with the `Blank Text Output` option within LTA's configurations.
For additional information, please refer to the Author's Instructions below.

Price Projection by Linear RegressionPurpose:
This is a TradingView Pine Script indicator that performs a linear regression on historical price data to project potential future price levels. It's designed to help traders visualize long-term price trends and potential future price targets.
Key Components:
User Inputs:
Historical Data Points (default 1000 bars) - The amount of historical data used to calculate the trend
Years to Project (default 10 years) - How far into the future to project the price
Technical Implementation:
Uses linear regression (ta.linreg) to calculate the trend slope
Converts years to trading days using 252 trading days per year
Limits visible projection to 500 bars due to TradingView's drawing limitations
Projects prices using the formula: current_price + (slope × number_of_bars)
Visual Elements:
Blue line showing actual historical prices
Red projection line showing the expected price path
Label showing the projected price at the visible end of the line
Information table in the top-right corner showing:
Current price
Final projected price after the full time period
Limitations:
Can only display projections up to 500 bars into the future (about 2 years) due to TradingView limitations
The full projection value is still calculated and shown in the table
Past performance doesn't guarantee future results - this is a mathematical projection based on historical trends
Usage:
Traders can use this to:
Visualize potential long-term price trends
Set long-term price targets
Understand the historical trend's trajectory
Compare current prices with projected future values
