FVG NQ - Clean Version# FVG NQ - Clean Version | גרסה נקייה
## 🇮🇱 תיאור בעברית
### מה זה האינדיקטור?
האינדיקטור מזהה **Fair Value Gaps (FVG)** בגרף דקה ומספק אותות מסחר מדוייקים עם ניהול סיכונים אוטומטי. האינדיקטור מתמחה במסחר בשעות הפתיחה של השוק האמריקאי (8:30-11:30).
### איך זה עובד?
**זיהוי FVG:**
- מחפש "פערים" בין שלושה נרות רצופים בגרף דקה
- בוליש FVG: כשה-High של נר 1 נמוך מה-Low של נר 3
- בריש FVG: כשה-Low של נר 1 גבוה מה-High של נר 3
**לוגיקת פערי פתיחה מחודדת:**
- ` `: יש פער פתיחה והנר ממשיך בכיוון הנכון ✅
- ` `: יש פער פתיחה אבל הנר לא ממשיך בכיוון ⚠️
- רגיל: FVG ללא פער פתיחה
### תכונות מרכזיות:
🎯 **ניהול סיכונים אוטומטי**: חישוב TP/SL לפי גודל ה-FVG או סיכון קבוע
📊 **יחסי סיכון/רווח**: 1:1, 1:2, 1:3
🕐 **מסחר בזמן מוגדר**: רק בין 8:30-11:30
🛡️ **הגנות בטיחות**: מקסימום 5 עסקאות ביום (מעל 2 ריסקי יותר)
📈 **סטטיסטיקות בזמן אמת**: Win Rate, P&L יומי וכללי
🎨 **ויזואליזציה ברורה**: צבעי רקע, קווי Entry/TP/SL, תוויות
### הגדרות:
- **ניהול סיכונים**: אוטומטי (לפי גודל FVG) או קבוע
- **יחס סיכון:רווח**: 1:1, 1:2, 1:3
- **מקסימום עסקאות ביום**: 1-5 (מעל 2 = ריסקי יותר)
- **גודל FVG מינימלי**: 2.0 נקודות (ניתן לשינוי)
### מתאים למי?
- סוחרי Futures NQ/ES
- מסחר בשעות הפתיחה האמריקאית
- מי שמחפש אותות איכותיים עם ניהול סיכונים
---
## 🇺🇸 English Description
### What is this Indicator?
This indicator identifies **Fair Value Gaps (FVG)** on the 1-minute chart and provides precise trading signals with automated risk management. The indicator specializes in trading during US market opening hours (8:30-11:30 AM EST).
### How does it work?
**FVG Detection:**
- Searches for "gaps" between three consecutive candles on 1-minute chart
- Bullish FVG: When candle 1 High is below candle 3 Low
- Bearish FVG: When candle 1 Low is above candle 3 High
**Refined Gap Opening Logic:**
- ` `: Opening gap exists and candle continues in correct direction ✅
- ` `: Opening gap exists but candle doesn't continue direction ⚠️
- Regular: FVG without opening gap
### Key Features:
🎯 **Automated Risk Management**: TP/SL calculation based on FVG size or fixed risk
📊 **Risk/Reward Ratios**: 1:1, 1:2, 1:3
🕐 **Time-Based Trading**: Only between 8:30-11:30 AM EST
🛡️ **Safety Protections**: Maximum 5 trades per day (above 2 is riskier)
📈 **Real-Time Statistics**: Win Rate, Daily & Total P&L
🎨 **Clear Visualization**: Background colors, Entry/TP/SL lines, labels
### Settings:
- **Risk Management**: Automatic (based on FVG size) or Fixed
- **Risk:Reward Ratio**: 1:1, 1:2, 1:3
- **Max Trades Per Day**: 1-5 (above 2 = riskier)
- **Minimum FVG Size**: 2.0 points (adjustable)
### Suitable For:
- NQ/ES Futures traders
- US market opening hours trading
- Traders seeking quality signals with risk management
---
## 📋 Trading Rules
1. **Entry**: When price touches FVG boundary
2. **Stop Loss**: Below/Above FVG + 1 point buffer (Auto mode)
3. **Take Profit**: Based on selected Risk:Reward ratio
4. **Daily Limit**: Stops after max trades reached or SL hit
5. **Time Filter**: Only active during 8:30-11:30 AM EST
## ⚠️ Risk Warning
- Futures trading involves substantial risk of loss
- Past performance doesn't guarantee future results
- Use proper position sizing
- Trading above 2 trades per day increases risk exposure
## 🎨 Visual Elements
- **Yellow Background**: Searching for FVG
- **Blue Background**: Pre-entry setup ready
- **Orange Background**: Currently in trade
- **Red Background**: Failed trade - no more entries today
- **Statistics Table**: Real-time performance metrics
---
*This indicator is designed for educational purposes. Always do your own research and consider your risk tolerance before trading.*
Forecasting

ADR Custom Anchor n %sAverage daily range.
Advantages on this indicator:
1 - you can select how many days to make the average, this is important on cryptos, because there's 24h/7d of negotiation
2 - select where to anchor, because central banks uses NY 17h candle close on parities to hedge (as know to remove sunday bar)
3 - new levels to get you new reversals spots

Boxed EMA + Volume PanelBoxed EMA - where Numbers show the price distance from each EMA.
RVOL
VOL percentage + contraction
Average 50 day volume
todays volume

Close Above Prev High / Below Prev LowIdentifies candles that close above the previous candle's high (bullish) and candles that close below the previous candle's low (bearish). Helps with decisions for entry and exit.

Mariam 5m Scalping Breakout StrategyPurpose
A 5-minute scalping breakout strategy designed to capture fast 3-5 pip moves with high probability, using premium/discount zone filters and market bias conditions. Developed for traders seeking consistent scalps with a proven win rate above 95–98% in optimal conditions.
How It Works
The script monitors price action in 5-minute intervals, forming a 15-minute high and low range by tracking the highs and lows of the first 3 consecutive 5-minute candles starting from a custom time. In the next 3 candles, it waits for a breakout above the 15m high or below the 15m low while confirming market bias using custom equilibrium zones.
Buy signals trigger when price breaks the 15m high while in a discount zone
Sell signals trigger when price breaks the 15m low while in a premium zone
The strategy simulates trades with fixed 3-5 pip take profit and stop loss values (configurable). All trades are recorded in a table with live trade results and an automatically updated win rate, typically achieving over 90–95% accuracy in favorable market conditions.
Features
Designed exclusively for the 5-minute timeframe
Custom 15-minute high/low breakout logic
Premium, Discount, and Equilibrium zone display
Built-in backtest tracker with live trade results, statistics, and win rate
Customizable start time, take profit, and stop loss settings
Real-time alerts on breakout signals
Visual markers for trade entries and failed trades
Consistent win rate exceeding 90–95% on average when following market conditions
Usage Tips
Use strictly on 5-minute charts for accurate signal performance. Avoid during high-impact news releases.
Important: Once a trade is opened, manually set your take profit at +3 to +5 pips immediately to secure the move, as these quick scalps often hit the target within a single candle. This prevents missed exits during rapid price action.

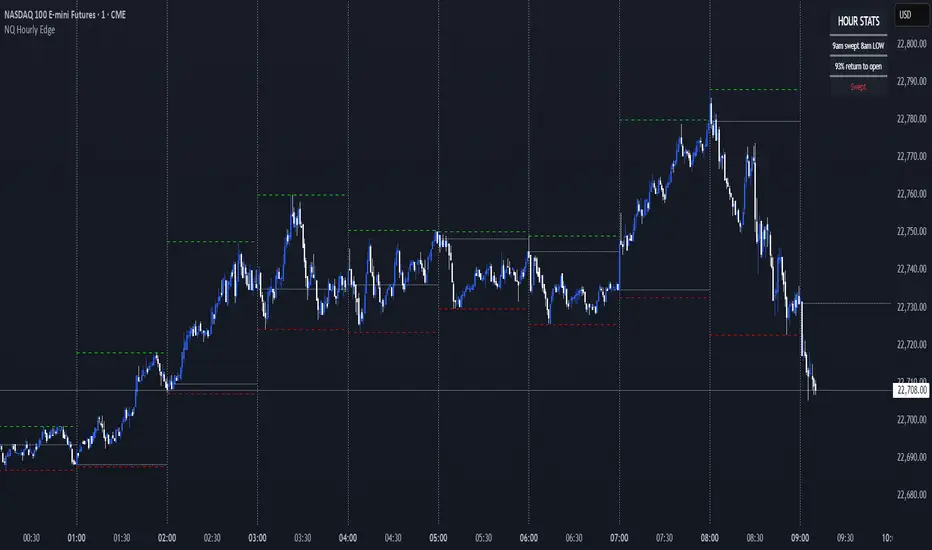
NQ Hourly Edge (By Scalpr)📊 Hourly Edge (Lorden) - Statistical Trading Edge Indicator
Transform your NQ1! trading with data-driven hourly analysis and high-probability setups based on extensive backtesting.
🎯 What This Indicator Does
The Hourly Edge indicator identifies high-probability "return to open" scenarios during the New York trading session (8am-4pm ET) specifically for NQ1! (Nasdaq futures). When the current hour opens inside the previous hour's range and then sweeps the previous high or low, statistical data shows strong probabilities of price returning to the hourly open.
📈 Key Features
Statistical Edge Detection
Real-time sweep detection with tick-by-tick accuracy
Probability percentages based on extensive NQ1! backtesting data
Color-coded probability levels: Green (75%+), Yellow (51-74%), Red (<50%)
Status tracking: Waiting → Swept → Returned
Visual Trading Tools
Hourly/Custom interval lines with full customization
High/Low tracking with optional current hour hiding
Opening price reference lines
Configurable line styles, colors, and widths
Smart Session Management
NY timezone awareness (8am-4pm ET focus)
"Waiting for 8am" display outside trading hours
20-minute segment analysis for refined probability calculations
🔧 Customization Options
Timeframe Flexibility
Multiple preset intervals: 4H, 1H, 30m, 15m, 10m, 5m
Custom timeframe input (hours + minutes)
Works on any chart timeframe
Display Controls
Show/hide any line type independently
Moveable info box (4 corner positions)
Adjustable text sizes
Historical line limit (1-500 bars)
Line Styling
Individual color settings for each line type
Style options: Solid, Dashed, Dotted
Width control: 1, 2, or 3 pixels
📊 How to Use
Add to NQ1! charts during NY session hours
Watch for sweep notifications in the info box
Check probability percentages for trade confidence
Monitor return status for entry/exit timing
Use alerts for high-probability setups (75%+ edge)
⚡ Best Practices
Optimal timeframes: 1m-15m for entries, 1H for context
Focus on 75%+ probability setups for highest edge
Wait for "moved away from open" confirmation before expecting returns
Combine with your existing NQ1! strategy for enhanced timing
🎯 Perfect For
NQ1! scalpers seeking high-probability entries
Nasdaq day traders wanting statistical edge confirmation
Futures strategy developers incorporating hourly analysis
Risk managers looking for data-driven NQ1! setups
FAWAZ CAPITAL Multi-Confluence Scalping SystemFOLLOW THE INDICATOR
Free to use for now
Fawaz Capital

DaringBull Arvind MACD GAPS MA CrossoverTo generate buy and sell signals based on a combination of MACD crossover events and histogram behavior, particularly around the zero line. This is used to identify early momentum reversals for entry and exit points in the market.
📐 MACD Setup
Uses customizable MACD parameters (defaults: Fast = 12, Slow = 26, Signal = 9).
Calculates:
MACD Line
Signal Line
Histogram (difference between MACD and Signal)
✅ Buy Conditions
A buy signal is plotted when all three of the following occur:
MACD Line crosses above Signal Line (bullish crossover).
MACD Line is still below or near the zero line (< 0.05) – indicates early reversal from a bearish zone.
First green histogram bar appears (current bar is > 0 and previous was ≤ 0) – confirming momentum shift.
➡️ When these align, a blue circle is plotted below the price bar.
❌ Sell Conditions
A sell signal is plotted when all three of the following occur:
MACD Line crosses below Signal Line (bearish crossover).
MACD Line is still above or near the zero line (> -0.05) – indicates early weakness after a bullish move.
First red histogram bar appears (current bar is < 0 and previous was ≥ 0) – confirming loss of momentum.
➡️ When these align, a red circle is plotted above the price bar.
📊 Visualization
Buy/Sell markers appear on the price chart for visual entry/exit cues.
MACD line, Signal line, and Zero line are optionally plotted for deeper analysis.
📌 Key Insights
This script aims to enter trades early in trend reversals by using MACD in conjunction with histogram shifts near the zero line.
It's especially useful in gap trading, mean reversion, or breakout confirmation setups.
The optional plot toggle allows switching between overlay and non-overlay views.

Altcoins + ETH (brez stablecoinov) / BTCWhen chart hits cca 0.3 of value it's sign the beginning ALT season.

Bollinger Bandwidth TrendflowThe Bollinger Bandwidth Trendflow is an experimental regime detection tool that analyzes the width of Bollinger Bands and combines it with the Adaptive Trend Flow (ATF), developed by QuantAlgo. The ATF has been integrated into this script exactly as originally published — all credit goes to QuantAlgo for this powerful contribution.
Features:
- Utilizes Bollinger Bandwidth (BBW) to assess volatility-driven momentum
- Adaptive Trend Flow (ATF) provides dynamic regime detection based on historical volatility
- Orange zones indicate trending phases
- Purple zones highlight mean-reverting environments
- Clean subpane plots for BBW and ATF, each toggleable and fully color-customizable
This indicator is particularly useful for traders looking to distinguish between explosive market moves and quiet consolidation — perfect for breakout or reversion-style setups.
I recommend using this script on the TOTAL CRYPTO Market Cap (1D) chart. The default settings represent the best values I could find quickly — feel free to tweak and explore them as you like.

[Mad]Triple Bollinger Bands ForecastTriple Bollinger Bands Forecast (BBx3+F)
This open-source indicator is an advanced version of the classic Bollinger Bands, designed to provide a more comprehensive and forward-looking view of market volatility and potential price levels.
It plots three distinct sets of Bollinger Bands and projects them into the future based on statistical calculations.
How It Is Built and Key Features
Triple Bollinger Bands: Instead of a single set of bands, this indicator plots three. All three share the same central basis line (a Simple Moving Average), but each has a different standard deviation multiplier. This creates three distinct volatility zones for analyzing price deviation from its mean.
Multi-Timeframe (MTF) Capability: The indicator can calculate and display Bollinger Bands from a higher timeframe (e.g., showing daily bands on a 4-hour chart). This allows for contextualizing price action within the volatility structure of a more significant trend.
(Lower HTF selection will result in script-crash!)
Future Forecasting: This is the indicator's main feature. It projects the calculated Bollinger Bands up to 8 bars into the future. This forecast is a recalculation of the Simple Moving Average and Standard Deviation based on a projected future source price.
Selectable Forecast Methods: The mathematical model for estimating the future source price can be selected:
Flat: A model that uses the most recent closing price as the price for all future bars in the calculation window.
Linreg (Linear Regression): A model that calculates a linear regression trend on the last few bars and projects it forward to estimate the future source price.
Efficient Drawing with Polylines: The future projections are drawn on the chart using Pine Script's polyline object. This is an efficient method that draws the forecast data only on the last bar, which avoids repainting issues.
Differences from a Classical Bollinger Bands Indicator
Band Count: A classical indicator shows one set of bands. This indicator plots three sets for a multi-layered view of volatility.
Perspective: Classical Bollinger Bands are purely historical. This indicator is both historical and forward-looking .
Forecasting: The classic version has no forecasting capability. This indicator projects the bands into the future .
Timeframe: The classic version works only on the current timeframe. This indicator has full Multi-Timeframe (MTF) support .
The Mathematics Behind the Future Predictions
The core challenge in forecasting Bollinger Bands is that a future band value depends on future prices, which are unknown. This indicator solves this by simulating a future price series. Here is the step-by-step logic:
Forecast the Source Price for the Next Bar
First, the indicator estimates what the price will be on the next bar.
Flat Method: The forecasted price is the current bar's closing price.
Price_forecast = close
Linreg Method: A linear regression is calculated on the last few bars and extrapolated one step forward.
Price_forecast = ta.linreg(close, linreglen, 1)
Calculate the Future SMA (Basis)
To calculate the Simple Moving Average for the next bar, a new data window is simulated. This window includes the new forecasted price and drops the oldest historical price. For a 1-bar forecast, the calculation is:
SMA_future = (Price_forecast + close + close + ... + close ) / length
Calculate the Future Standard Deviation
Similarly, the standard deviation for the next bar is calculated over this same simulated window of prices, using the new SMA_future as its mean.
// 1. Calculate the sum of squared differences from the new mean
d_f = Price_forecast - SMA_future
d_0 = close - SMA_future
// ... and so on for the rest of the window's prices
SumOfSquares = (d_f)^2 + (d_0)^2 + ... + (d_length-2)^2
// 2. Calculate future variance and then the standard deviation
Var_future = SumOfSquares / length
StDev_future = sqrt(Var_future)
Extending the Forecast (2 to 8 Bars)
For forecasts further into the future (e.g., 2 bars), the script uses the same single Price_forecast for all future steps in the calculation. For a 2-bar forecast, the simulated window effectively contains the forecasted price twice, while dropping the two oldest historical prices. This provides a statistically-grounded projection of where the Bollinger Bands are likely to form.
Usage as a Forecast Extension
This indicator's functionality is designed to be modular. It can be used in conjunction with as example Mad Triple Bollinger Bands MTF script to separate the rendering of historical data from the forward-looking forecast.
Configuration for Combined Use:
Add both the Mad Triple Bollinger Bands MTF and this Triple Bollinger Bands Forecast indicator to your chart.
Open the Settings for this indicator (BBx3+F).
In the 'General Settings' tab, disable the Activate Plotting option.
To ensure data consistency, the Bollinger Length, Multipliers, and Higher Timeframe settings should be identical across both indicators.
This configuration prevents the rendering of duplicate historical bands. The Mad Triple Bollinger Bands MTF script will be responsible for visualizing the historical and current bands, while this script will overlay only the forward-projected polyline data.

Custom ETF with Dynamic Weights & RatioHi,
Want to create your own ETF from your portfolio?
This script lets you:
Add up to 10 stocks to form an ETF.
Assign weightings to each stock.
Create a second ETF to compare with your first ETF.
Compare both ETFs to determine which performs best.

Market Generated InformationCredits
Original Author: mcthatsme
Remixed to add in London's High and Low
Overview
The Market Generated Information (MGI Levels v2) is a comprehensive technical analysis. It overlays key price levels from daily, weekly, and monthly timeframes on a chart, providing traders with critical market reference points such as Open, High, Low, Close, Volume Weighted Average Price (VWAP), and standard deviation bands. These levels help traders identify potential support, resistance, and pivot points for intraday and longer-term trading strategies. The indicator is highly customizable, allowing users to tailor the displayed levels, colors, line styles, and label settings to their preferences.
Features
Multi-Timeframe Levels: Displays key price levels from daily, weekly, and monthly sessions, including Open, High, Low, Close, VWAP, and VWAP standard deviation bands (SD1, SD2, SD3).
Session-Based Calculations: Supports Regular Trading Hours (RTH) and Extended Trading Hours (ETH) for stocks and futures, with specific session times for New York, London, and overnight sessions.
Customizable Display: Users can toggle the visibility of specific levels, adjust line styles (solid, dashed, dotted), colors, thicknesses, and label settings (size, offset, and price inclusion).
Opening Range and Initial Balance: Plots the Opening Range (default: 9:30–10:00 AM EST) and Initial Balance (default: 9:30–10:30 AM EST) for intraday traders.
Tested Level Tracking: Optionally tracks untested or tested levels, hiding or showing them based on user preferences.
Overnight and T+2 Levels: Includes overnight high/low and T+2 (two days prior) levels for additional context.
VWAP Calculations: Computes VWAP and its standard deviation bands for daily, weekly, and monthly periods.
Holiday and Session Filters: Adjusts for market-specific conditions, such as Good Friday or shortened trading sessions.
Inputs and Customization
The indicator is organized into three main groups: Daily Levels, Weekly Levels, and Monthly Levels. Each group allows users to configure the following:
Visibility: Toggle whether to show levels (e.g., Show Daily Levels, Show Weekly Levels).
Session Times: Define session ranges (e.g., New York RTH: 9:30 AM–4:00 PM EST, Opening Range: 9:30–10:00 AM EST).
Line and Label Settings: Customize line colors, styles (solid, dashed, dotted), thickness, label text size (Tiny, Small, Normal, Large, Huge), label offset, and whether to include price values in labels.
Number of Periods: Specify how many previous days (1–40), weeks (1–20), or months (1–12) to display.
Tested/Untested Levels: Choose to keep untested levels or show tested levels (Open, High, Low, Close).
Timeframe for Calculations: Option to use a 30-second or 1-minute timeframe for Opening Range and Initial Balance calculations to accommodate different TradingView plans.
Key Levels
Daily Levels: Includes Current Day High/Low, Previous Day High/Low, Opening Range High/Mid/Low, Initial Balance High/Mid/Low, Globex Open, RTH Open, Midnight Open, London Open/Close/High/Low, Previous Day 50% (HL2/OC2), T+2 Open/Close/High/Low, Overnight High/Low, RTH Close, 5 PM Close, and VWAP with standard deviation bands.
Weekly Levels: Previous Week High/Low, 50% (HL2/OC2), Current Week Open, Previous Week Close, and VWAP with standard deviation bands.
Monthly Levels: Previous Month High/Low, 50% (HL2/OC2), Current Month Open, Previous Month Close, and VWAP with standard deviation bands.
Troubleshooting
Levels Not Displaying: Check if the timeframe is ≤ 30 minutes for daily levels and ensure session times are correct for your market.
Incorrect Prices: Verify that extended hours are enabled for ETH charts or disabled for RTH-only charts.
Too Many Lines/Labels: Reduce the number of previous days/weeks/months or disable unneeded levels.
Session Errors: Ensure session times are in UTC-5 (New York time) and match your asset’s trading hours.
License
This script is licensed under the Mozilla Public License 2.0. See mozilla.org for details.

Auto Enhanced Trendline ChannelAuto Enhanced Trendline Channel" is an intelligent technical analysis tool designed to automatically identify and plot key trendlines and price channels in the market. Using advanced algorithms, this tool not only detects the price's fluctuating trends but also adjusts the channel range in real-time based on market changes, enabling traders to more accurately capture market fluctuations and optimize trading decisions. The enhanced version offers higher flexibility and accuracy, making it suitable for various market environments, and helps users seize more trading opportunities in complex markets.
Red Trendline: Explicit resistance trendline.
Green Trendline: Explicit support trendline.
Orange Trendline: Antagonistic resistance trendline (forecast).
Blue Trendline: Antagonistic support trendline (forecast).
The semi-transparent red and green lines form the volume channel.

PE Bands w/ Persistent EPS ProxyThis Pine Script is a valuation overlay for any stock or index, built around the idea of tracking and projecting P/E (Price-to-Earnings) multiple bands using trailing EPS and a growth assumption. Here's a full breakdown:
🔍 Purpose:
To visualize price bands based on valuation multiples (like 16x, 18x, 20x, etc.) of forward EPS, estimated from actual reported EPS over the last 4 quarters.
🧱 Core Components:
✅ @version=6
Specifies the latest Pine Script version (v6), ensuring compatibility with the newest syntax.
✅ indicator(...)
Declares a chart overlay indicator titled 'PE Bands w/ Persistent EPS Proxy', meaning the plots will appear on top of the price chart.
1. 📈 Growth Assumption Input
pinescript
Copy
Edit
Growth = input.float(1.08, 'Growth')
User input for projected forward EPS growth (default: +8%). This models earnings growth from trailing 12 months to forward 12 months.
2. 🧮 Retrieve EPS Data
pinescript
Copy
Edit
epsRaw = request.earnings(syminfo.tickerid, earnings.actual, gaps = barmerge.gaps_off)
Uses the built-in request.earnings() function to fetch actual EPS.
Works with any symbol that supports earnings data.
barmerge.gaps_off ensures EPS only shows on report bars (not filled in between).
3. 🧠 Persistent Memory for Last 4 EPS Values
pinescript
Copy
Edit
var float eps1 = na
...
if not na(epsRaw)
eps4 := eps3
eps3 := eps2
eps2 := eps1
eps1 := epsRaw
Implements a shift register: keeps track of the last 4 quarterly EPS values, so it can compute a full TTM (trailing 12-month) EPS even though epsRaw only updates quarterly.
4. 📊 Trailing 12-Month EPS
pinescript
Copy
Edit
epsTTM = na(eps1) or na(eps2) or na(eps3) or na(eps4) ? na : eps1 + eps2 + eps3 + eps4
Sums the most recent 4 quarters to get a TTM earnings proxy.
If any value is still na, the result is na.
5. 🔮 Forward EPS Estimation
pinescript
Copy
Edit
fwdEPS = epsTTM * Growth
Projects forward EPS using a growth multiplier (1.08 = +8%).
You could customize this to vary over time (e.g., macro-modelled growth).
6. 📐 Valuation Bands
pinescript
Copy
Edit
pe16 = fwdEPS * 16
...
pe24 = fwdEPS * 24
Calculates price levels the stock/index would be trading at under different valuation multiples of forward EPS.
These become bands: 16x, 18x, 20x, etc.
7. 📉 Plot Bands
pinescript
Copy
Edit
plot(pe16, ...)
...
plot(pe24, ...)
Draws horizontal or sloped bands that reflect valuation ranges.
If SPX is above the 22x or 24x band, you might consider the market overvalued.
If it’s near 16x, potentially undervalued (depending on forward EPS quality).
✅ Summary:
This is a dynamic, earnings-based valuation overlay for use on equity or index charts. It uses:
Real EPS data (as it gets reported)
Persistent memory to calculate trailing 12M EPS
Growth modeling to estimate forward EPS
Price targets for different forward P/E multiples

[DEM] Sequential Signal (With Backtesting) Sequential Signal (With Backtesting) is designed to generate buy and sell signals based on a modified Sequential counting methodology. It also includes a comprehensive backtesting framework to evaluate the historical performance of these signals. The indicator overlays directly on the price chart, plotting signals and displaying performance statistics in a table.

[DEM] ALMA Signal (With Backtesting) ALMA Signal (With Backtesting) is designed to generate buy and sell signals based on the Arnaud Legoux Moving Average (ALMA) combined with Average True Range (ATR) and includes a backtesting framework to evaluate the performance of these signals. It overlays directly on the price chart and also displays performance statistics in a table.

Market Strength Dashboard🚀 What It Does:
The indicator gives you a real-time dashboard showing three things:
✅ Trend Direction
Uses EMA 50 vs EMA 200.
Bullish: EMA 50 is above EMA 200 → Price favors upside swing.
Bearish: EMA 50 is below EMA 200 → Price favors downside swing.
Neutral: EMAs are equal → No clear trend.
✅ Momentum Strength
Uses RSI (Relative Strength Index).
Strong Bullish: RSI > 55 → Buyers in control.
Strong Bearish: RSI < 45 → Sellers in control.
Neutral: RSI between 45–55 → No strong momentum, usually sideways or uncertain.
✅ Volatility State (Expansion/Consolidation)
Uses Bollinger Band Width.
Measures if price is:
Expanding: BB Width increasing → Market opening up, volatility rising, often precedes large moves or breakouts.
Contracting: BB Width shrinking → Market compressing, often leads to tight ranges or consolidation.
Stable: No change in BB Width → Range behavior or calm trend.
🔥 How It Works Behind the Scenes:
EMA Cross Check:
→ Looks at whether the faster EMA (50) is above or below the slower EMA (200).
RSI Scan:
→ Reads current RSI level to determine momentum strength.
Bollinger Band Width Scan:
→ Calculates the distance between the upper and lower Bollinger Bands to detect if price is expanding or compressing.
Dashboard Output:
→ Combines all this into a floating label on the chart like:
“Trend: Bullish | Momentum: Strong Bullish | Volatility: Expanding”
🏆 How to Use It — Simple Rules for Swing or Day Trading:
🔥 Ideal Swing Trade Setup:
→ ✅ Trend: Bullish
→ ✅ Momentum: Strong Bullish
→ ✅ Volatility: Expanding
→ → Take long setups → pullbacks to EMA50 or previous highs → ride the trend.
→ ❌ If Trend is Neutral or Volatility is Contracting, skip the trade — market is chopping.
🔥 Ideal Day Trade Setup:
Look for Volatility Expanding → confirms active session/move.
Pair it with either Trend Bullish + Momentum Bullish for longs
→ Or Trend Bearish + Momentum Bearish for shorts.
🔥 When Not to Trade:
Trend Neutral + Momentum Neutral + Contracting Volatility → Sideways chop → No trade zone.
🔥 Breakout Watch Strategy:
When volatility shifts from Contracting → Expanding, expect a breakout.
→ Look for the first candle that pushes away from the Bollinger squeeze.
📊 How To Combine With Other Setups:
→ ✅ Add this dashboard to any chart to instantly know:
Should I be thinking up, down, or neither?
Is this market about to move big or stay stuck?
Pair it with:
Your price action entries.
Support/resistance levels.
Candle patterns.
Trendline or liquidity breaks.
🧠 Bottom Line:
→ This is a market condition scanner, not a signal generator.
→ It tells you: “Should I trade? What’s the direction? Is the market moving or stuck?”
→ You still choose the entry — this tool tells you when conditions are ideal or not.

Doji Ashi v2.0Doji Ashi v2.0
A versatile intraday trading indicator designed for both stocks and crypto, based on real trader feedback and tested principles.
...
Introduction & Acknowledgements
This script was made possible thanks to the ongoing feedback and live testing by the TradingView and Reddit communities. Special thanks to:
Nathan_Drake_000
Disastrous-Stand4613
Lalelulilo_ph
Jtri25
Each provided insights that directly shaped the filters, presets, and signal logic found in this release.
Much of the philosophy behind this indicator is inspired by the free Reddit PDF:
The Damn Wiki
I highly recommend reading it to better understand the edge this indicator is trying to provide.
...
What is Doji Ashi v2.0?
This indicator is designed for short-term intraday momentum trading, offering Buy and Sell signals based on a refined combination of filters including:
Trend alignment with daily SMAs
Momentum confirmation using EMA 3/8 cross
Relative volume to identify activity spikes
VWAP positioning to confirm trend consistency
Time filters to avoid unreliable early market chop
It adapts dynamically depending on whether you’re trading Stocks or Crypto, with appropriate filters toggled automatically.
...
How the Script Works
Core Logic:
A Buy signal appears when:
The price is in an uptrend (via SMAs)
VWAP and volume confirm momentum
EMA 3 crosses above EMA 8
Relative strength is strong (if enabled)
Market opens past first 30 mins
A Sell signal appears when:
The asset shows weakness across these same filters, in reverse
You’ll see green “BUY” or red “SELL” markers on your chart instantly when the full condition set is met. This script does not repaint.
Entry Logic Options:
Choose between:
"Cross" mode: Signals appear on 3/8 EMA crossover
"Above/Below" mode: Persistent signal while 3 EMA stays above/below 8 EMA
...
Strategy for Consistent Gains
This script works best on liquid stocks such as LUNR, ASTS and PLUG. It also works with Crypto. Make sure you choose the correct indicator setup type (Stocks or Crypto) in the setting before testing.
If you don't see any signals the default settings may be too strict for your chosen stock. Have a play with the settings to find the right balance for you. The default settings follow the strategy below for what I believe are currently the best results.
Alerts for buy/sell signals can be set from the alerts menu. For best results, make sure you set the alert to action on close of bar.
This indicator is most effective when:
Used with liquid stocks or crypto
Entries are confirmed with VWAP, not counter-trend
Signals are filtered by volume spikes and trend direction
Example strategy:
Buy a Call when you see a BUY signal with high volume, in an uptrend
Exit on a cross back to VWAP (the orange line) or a quick 1% profit
Do the opposite with PUTs on a SELL signal
This is ideal for quick day trades (scalps or trend moves), and avoids the choppy, uncertain zones at market open.
...
Optimizing via Settings
There are additional, stricter filters in the settings. Please adapt to your preference.
Presets:
Stocks (Default): Applies all filters but lets you disable them as needed
Crypto: Disables stock-specific filters (SPY comparison, RS, Daily trend)
Filters:
Daily Trend Filter: Helps align trades with higher timeframe direction (recommended ON for stocks)
Market Trend & RS: Filters based on SPY and relative performance (test enabling for SPY-following tickers)
VWAP Entry Filter: Keeps you from fighting the dominant intraday trend
Ignore First 30 Minutes: Avoids false signals at the open
Experiment with toggling filters ON/OFF to match your asset class and volatility conditions.
...
Finally
The best way to master this indicator is to understand the trading mindset it came from.
Read The Damn Wiki — it’s free, comprehensive, and packed with wisdom that this script distills into a usable tool.
If you would like to adapt this indicator you are very welcome to do so. All I ask in return is that you share your findings with the wider community.
...
Happy trading. May your entries be sharp and your exits cleaner.
~ @SassyStonks

🚀 Ultimate Hybrid Oscillator By Wali🚀 Ultimate Hybrid Oscillator – All Pro Modules by Wali Mohsin
The Ultimate Hybrid Oscillator is a next-generation multi-confirmation trading tool designed for serious traders who demand accuracy, confluence, and adaptability across all markets and timeframes.
🔍 What Makes It Powerful?
This script blends technical momentum, smart money logic, price action patterns, and macro market filters into one smooth, reliable oscillator that adapts to the market's true narrative.
🔧 Core Modules Integrated:
📊 MCI Engine (Momentum Confirmation Index)
Combines RSI, MACD, Stochastic RSI, OBV, ADX, ATR, volume spikes, absorption, candlestick behavior, and more – with weighted scoring (13+ confluence points).
📐 Price Action Pattern Recognition
Detects and confirms Head & Shoulders, Flags, Triangles, Wedges, Double/Triple Tops & Bottoms, Cup & Handle, Rounding patterns – filtered through RSI momentum.
🏦 Smart Money Concepts
Integrated CHoCH/BOS, Liquidity Sweeps, Breakaway Gaps, Orderblocks, and volume absorption for insider-grade confirmation.
🌐 Macro & Intermarket Sentiment
Auto-fetches BTC Dominance, USDT Dominance, ETHBTC, TOTAL3, DXY, and SPX for risk-on/off environment filtering.
🧠 Ensemble Voting System
A 22-factor confluence engine that scores hidden bullish/bearish setups based on real-time technical alignment.
🎯 RSI Zone Locking
Dynamic color shifts (yellow/blue) when RSI enters extreme reversal zones (below 30 or above 70) for added visual context.
📈 How to Use:
Use oscillator cross above/below 0 as a general trend signal.
Look for oscillator levels above +4 or below -4 for strong confirmation setups.
Combine with price action and macro signals for sniper entries.
Works on all timeframes – optimized for scalping, swing, and long-term crypto traders.
⚙️ Customization:
Full modular toggles (CHoCH, Liq Sweep, Macro, Orderblocks, EMA filter).
Adjustable weights for each component (MCI, PA, Macro).
Smoothing settings to match your trading speed and style.
Created by: Wali Mohsin Channa

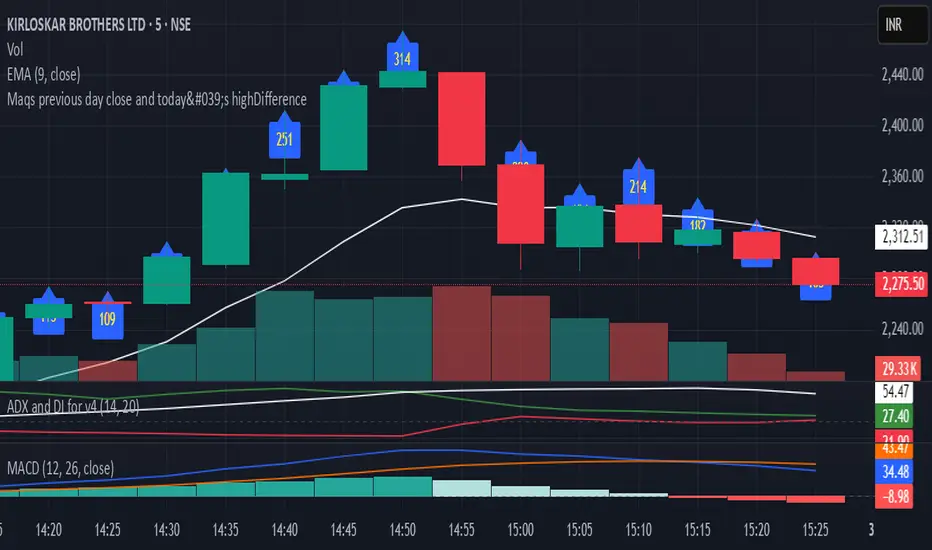
Maqs previous day close and today's highDifferenceIt gives previous day close and today's high Difference and hence capacity of the stock
h3nrytrades ADR [Pro]📊 ADR & Watermark Utility
This indicator combines a customizable Average Daily Range (ADR) tracker with clean, professional watermarks to enhance chart clarity and support decision-making across any market or symbol.
🔍 Features:
• ADR Calculation: Tracks the average daily range over a user-defined number of days (default: 30). Great for assessing current volatility relative to historical norms.
• Live Daily Range Tracking: Displays the current day’s price range in real time.
• ADR % Meter: Instantly see how much of the average range has been covered so far today.
• Watermark Display: Add optional watermarks such as symbol name, timeframe, or custom tags—perfect for clean screenshots, recordings, or journaling.
🧠 Ideal For:
• Identifying potential range-bound vs. high-volatility sessions.
• Pre-market analysis or intraday filters based on range exhaustion.
• Enhancing visual clarity on your charts with context-rich overlays.
⚙️ Fully Customizable:
• ADR lookback period
• Watermark content, size, and position
• Toggle visibility of all elements

Opening Range Breakout (ORB) with Fib RetracementOverview
“ORB with Fib Retracement” is a Pine Script indicator that anchors a full Fibonacci framework to the first minutes of the trading day (the opening-range breakout, or ORB).
After the ORB window closes the script:
Locks-in that session’s high and low.
Calculates a complete ladder of Fibonacci retracement levels between them (0 → 100 %).
Projects symmetric extension levels above and below the range (±1.618, ±2.618, ±3.618, ±4.618 by default).
Sub-divides every extension slice with additional 23.6 %, 38.2 %, 50 %, 61.8 % and 78.6 % mid-lines so each “zone” has its own inner fib grid.
Plots the whole structure and—optionally—extends every line into the future for ongoing reference.
**Session time / timezone** – Defines the ORB window (defaults 09:30–09:45 EST).
**Show All Fib Levels** – Toggles every retracement and extension line on or off.
**Show Extended Lines** – Draws dotted, extend-right projections of every level.
**Color group** – Assigns colors to buy-side (green), sell-side (red), and internal fibs (gray).
**Extension value inputs** – Allows custom +/- 1.618 to 4.618 fib levels for personalized projection zones.
