Session HL + Candles + AMD (Nephew_Sam_)Session HL + Candles + AMD (Nephew_Sam_)
This indicator marks out intraday sessions summarized into single candles, with an additional option to mark out the HL of each session. Perfect for understanding AMD within a glance (accumulation-manipulation-distribution)
Features:
Session High/Low lines with customizable colors and labels
Optional session candles displayed on the right side of the chart
Timezone support for global traders
Customizable bull/bear candle colors
Works on timeframes up to 1 hour
Perfect for:
Identifying session liquidity levels
Tracking session ranges and breakouts
Multi-timeframe session analysis
ICT methodology traders
Settings:
Choose your timezone for accurate session detection
Toggle session candles and HL lines independently
Customize colors, line styles, and labels
Set maximum timeframe (up to 1 hour)
Forecasting

[ BETA ][ IND ][ LIB ] Dynamic LookBack RSI RangeGet visual confirmation with this indicator if the current range selected had been oversold or overbough in the latest n bars

JIYANS FVGJIYAN'S FVG is a powerful Fair Value Gap (FVG) indicator designed to help traders visually identify and track bullish and bearish imbalances across customizable timeframes. The script automatically detects FVGs based on market structure and plots them with shaded boxes and clear boundary lines on the chart.
Key Features:
Multi-Timeframe Detection: Select your preferred timeframe for FVG detection (e.g., H4, H1, M30).
Visual Clarity: Displays shaded gaps with customizable colors, upper and lower boundary lines, and optional midpoint lines for precise reference.
Dynamic Management: Automatically removes mitigated (filled) gaps to keep the chart clean and focused.
Labeling: Annotates each FVG with the selected timeframe for easy tracking.
Alerts: Built-in alerts notify you when a new FVG forms or when price touches the boundary of an existing unmitigated FVG.
This tool is perfect for traders who rely on price imbalances and fair value gaps to identify potential trading opportunities and key areas of interest.

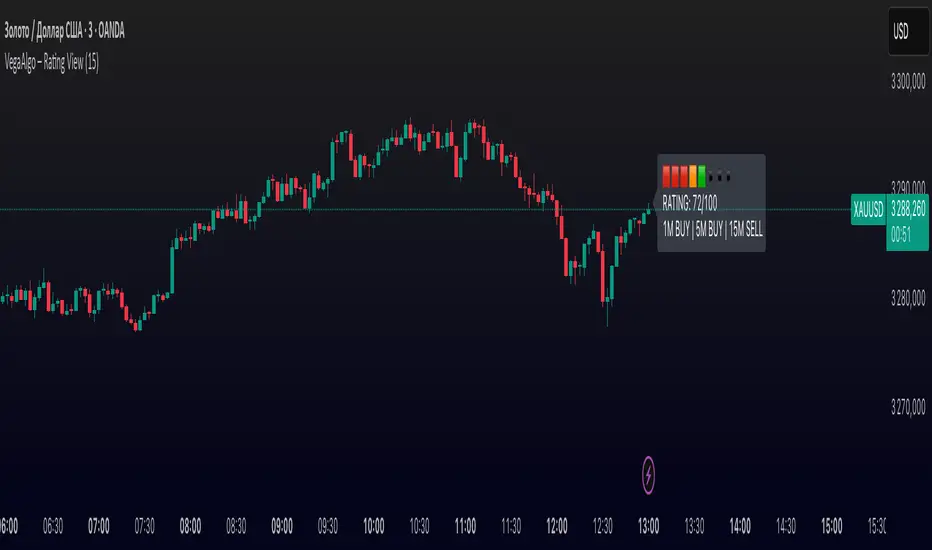
VegaAlgo – Rating ViewVegaAlgo – Rating View is a market condition analysis tool designed to evaluate the current price structure.
The indicator calculates a RATING (from 0 to 100) that reflects how clean, directional, and structured the recent price movement is. The rating is based on the number of price direction changes (from bullish to bearish candles and vice versa) within a selected period. Fewer direction changes indicate a clearer trend and result in a higher rating, while a choppy or highly volatile market leads to a lower score.
Additionally, the indicator provides directional signals on three key timeframes — 1M, 5M, and 15M, using a comparison of fast and slow moving averages. This allows traders to quickly assess the dominant trend both locally and across higher timeframes.
This script is intended for visual market analysis only and should not be considered financial advice.
Civan Ali'nin Sihirli Çizgisi🧙♂️ Civan Ali’s Magic Line
Sense the trends, don’t miss the moves!
This strategy is built on two magically effective foundations:
📏 Moving Averages (WMA 50 & 200) and
🧠 CCI signals powered by the IFT Combo filter.
How It Works
🔹 When price starts accelerating upward and the short-term average (WMA50) crosses above the long-term (WMA200), a potential long signal forms.
🔻 If it crosses downward, a short signal is considered.
But it doesn’t jump in immediately!
🎯 To avoid “noisy” market moves, the system uses an Inverse Fisher Transform (IFT) filter.
Only when momentum is truly strong does it allow trades.
Why It’s Different
✅ Detects trend direction
✅ Filters out weak signals
✅ Manages risk and profit intelligently
And while doing all that, it warns you with magical labels and emojis on the chart.
In short: It’s both effective and entertaining. 🎯

Advanced Day Separator with Future ProjectionsThe general indicator works on historical data, meaning they develop after the fact. The same is for indicators that show day separation. I was always forced to manually draw in vertical lines for the upcoming week. This indicator I built solves that issue by projecting vertical day separations for the upcoming week. Enjoy! :-)

IU Fibonacci Levels For IntradayDESCRIPTION
This indicator draws intraday Fibonacci levels from the opening price of the day using percentage-based retracements. It helps traders identify potential intraday support and resistance zones derived from the day’s opening bias. The levels are dynamically calculated and displayed with optional labels and customizable colors, making it an effective tool for both breakout and mean-reversion intraday strategies.
USER INPUTS
Direction Of The Level
Choose whether to show Upside, Downside, or Both level sets based on your directional bias.
Show Labels of Levels
Option to enable or disable text labels displaying Fibonacci values and prices.
Individual Level Toggles & Colors
You can choose to show or hide each of the following Fibonacci levels and set their respective colors:
* 0.236
* 0.328
* 0.500
* 0.618
* 0.786
* 1.000
INDICATOR LOGIC
On the first bar of the session, the opening price is captured.
Fibonacci levels are then calculated above and below this open using percentage multipliers (for example, day\_open + (day\_open \* 0.236%) for the 0.236 level).
Depending on the selected direction, upside and/or downside levels are plotted.
Filled zones are drawn between levels to visually highlight key price zones.
Optionally, each level can be labeled with its Fibonacci value and price.
WHY IT IS UNIQUE
Unlike traditional swing-based Fibonacci retracements, this tool uses the day’s opening price as an anchor, specifically designed for intraday traders.
Allows traders to quickly visualize micro-support and resistance levels that adapt every day.
Highly customizable and easy to read, with filled level bands for better zone recognition.
Works independently of indicators like RSI, MACD, or moving averages – purely based on price action logic.
HOW USER CAN BENEFIT FROM IT
Spot precise intraday reversal zones or breakout regions.
Combine with price action or volume analysis for smarter entries.
Filter trades by choosing directional bias (Up Site, Down Site, or Both).
Set profit targets or stop-losses based on Fibonacci bands.
Works great for scalpers, day traders, and even short-term swing traders looking to align with opening price momentum.
Disclaimer
This indicator is not financial advice, it's for educational purposes only highlighting the power of coding( pine script) in TradingView, I am not a SEBI-registered advisor. Trading and investing involve risk, and you should consult with a qualified financial advisor before making any trading decisions. I do not guarantee profits or take responsibility for any losses you may incur.

Dynamic Sniper ProDynamic Sniper Pro - Binary Options Signal
Description:
Dynamic Sniper Pro is a powerful Pine Script v6 indicator designed for binary options trading. It combines Exponential Moving Averages (EMAs), Relative Strength Index (RSI), and an optional ATR filter to generate precise buy and sell signals. Ideal for short-term charts like 1-minute, this indicator helps traders spot trend reversals and breakouts with clear visual arrows. Tested on CAD/JPY, it recently delivered actionable signals during the morning session on July 01, 2025.
How It Works:
Buy Signal (Green Arrow): Triggered when the closing price exceeds both the 3-period Fast EMA and 8-period Slow EMA, RSI drops below the oversold level (default 40), and (if ATR filter is on) the price breaks above the Slow EMA + 0.15 * ATR. Enter a call option at the next candle open.
Sell Signal (Red Arrow): Triggered when the closing price falls below both EMAs, RSI rises above the overbought level (default 60), and (if ATR filter is on) the price breaks below the Slow EMA - 0.15 * ATR. Enter a put option at the next candle open.
Key Features:
Customizable parameters: Adjust EMA lengths, RSI periods, oversold/overbought levels, and ATR multiplier.
Optional ATR filter to reduce whipsaw entries.
Visual alerts with arrows and background highlights.
Compatible with any forex pair or timeframe—optimize for your strategy!
Settings:
Fast EMA Length: 3 (short-term trend)
Slow EMA Length: 8 (trend confirmation)
RSI Length: 14 (default smoothness)
Oversold Level: 40 (tweak for sensitivity)
Overbought Level: 60 (tweak for sensitivity)
Use ATR Filter: True (optional)
ATR Length: 14
ATR Multiplier: 0.3 (adjust for breakout strength)
Performance:
Backtesting on CAD/JPY 1-minute from 10:34–11:34 AM PDT on July 01, 2025, showed promising signal frequency. Results may vary—test on your preferred asset.
Tips:
Set alerts via the "Alerts" tab for real-time notifications.
Adjust oversold/overbought levels (e.g., 45/55) for fewer/more signals.
Best on volatile pairs like CAD/JPY or EUR/USD.
Disclaimer:
This indicator is for educational purposes only. Past performance is not indicative of future results. Use at your own risk, and consider market conditions and risk management.

Yaman's - TREND 🔴🟢This indicator is designed to show two types of Trends.
Logic #1 Short Term Trends for scalping Traders.
Logic #2 Long Term Trends from the same Time Frames for Swing Traders.
Default Pairs: XAUUSD, DXY & BTCUSD (any other user defined pairs).
Time Frames: 1M, 5M, 15, 1H.
HAPPY TRADING!!!
Thanks
Yaman Didi
01/07/2025

SMC+PASMC or Smart Money Concept is a concept in analyzing financial markets, especially in the Forex market, focusing on studying and following the behavior of large investors, or so-called "Smart Money", such as financial institutions, banks, and funds, which influence price movements. Understanding SMC helps traders predict market directions and plan trades more effectively.

DISEGNATORE Livelli Dev. Std. H4 v1.9the Drawer needed to display "net % St. Devs, CALCULATOR 4H" output.

Net % St.Devs. CALCULATOR H4a calculator able to create a Statistical Sample of 4h time-specific candles and their Net change % Values, and projects its Standard Deviations on any timeframes chart.

NQ Hourly Stats - Detailed Prob (24h)Hourly Sweep Statistics - Probability Engine (Credits to nqstats.com)
Overview
This indicator is a powerful statistical tool designed for intraday traders, particularly those focused on session-based patterns and mean reversion strategies. It automatically tracks the previous hour's high, low, and open, and when a sweep of the high or low occurs, it instantly displays the historical probability of the price returning to the hourly open within that same hour.
The core of this indicator is a comprehensive probability model built on historical price data, providing traders with an objective, data-driven edge.
Key Concepts
The indicator operates on a simple but effective premise: after the high or low of the previous hour is taken, what is the statistical likelihood that price will revert back to the opening price of the current hour?
• Previous Hour High (PHH) & Previous Hour Low (PHL): These levels often act as key liquidity zones. A sweep of these levels can signify either a stop run before a reversal or the start of a strong continuation.
• Return to Open: This is a classic mean-reversion concept. The indicator quantifies the probability of this event happening based on the exact time the sweep occurs.
• Time-Based Probability: The probability of returning to the open is not static; it changes depending on when the sweep happens. A sweep in the first 5 minutes of the hour has a different statistical outcome than a sweep in the last 5 minutes. This indicator accounts for that variance by breaking down the hour into 12 distinct 5-minute buckets.
How It Works
1. Automatic Level Plotting: At the start of each new hour, the indicator automatically draws three lines on your chart:
o The Previous Hour's High (Teal, solid line)
o The Previous Hour's Low (Maroon, solid line)
o The Current Hour's Open (Gray, dotted line)
2. Sweep Detection & Labeling: The script constantly monitors price action. The moment the current price action sweeps (touches or breaks) the PHH or PHL, a label appears.
o High Sweep: A label will appear above the PHH line.
o Low Sweep: A label will appear below the PHL line.
3. Information-Rich Labels: Each label provides crucial, real-time information:
o Direction: "Took PHH" or "Took PHL".
o Time: The exact time (@ HH:MM) the sweep occurred.
o Probability: The historical probability ("Prob to Open: XX.XX%") of price returning to the hourly open after that specific sweep.
4. Dynamic Color-Coding: The labels are color-coded for at-a-glance interpretation:
o Green: High probability (>70%) - Strong statistical likelihood of returning to the open.
o Orange: Medium probability (40%-70%) - Neutral/moderate likelihood.
o Red: Low probability (<40%) - Weak statistical likelihood of returning to the open; may suggest trend continuation.
How to Use in Your Trading
This indicator is not a standalone signal generator but a powerful confluence tool to enhance your decision-making.
• Mean Reversion Setups: When a sweep occurs and a high-probability (green) label appears, it can serve as strong confirmation for a mean-reversion trade. You can look for entries on a lower timeframe, targeting the hourly open.
• Trend Continuation Setups: If a sweep generates a low-probability (red) label, it suggests that the move has strength and is less likely to reverse. This can be used to validate a breakout or trend-following strategy, or to avoid taking a counter-trend trade.
• Filtering Trades: Use the probabilities to filter your existing setups. You might choose to only take reversion trades when the probability is above a certain threshold (e.g., 70%) or avoid them entirely when the probability is low.
Features & Customization
• Full 24-Hour Data: The statistical model includes data for all 24 hours of the day, making it useful for trading any session (Asia, London, New York).
• Timezone Setting: Ensure you set the Chart Timezone input to match your chart's timezone (e.g., 'America/New_York') for the probabilities to be accurate.
• Custom Colors: All line colors are fully customizable to match your chart's theme.
Disclaimer: This indicator is based on historical statistics and does not guarantee future results. It should be used as part of a comprehensive trading plan that includes proper risk management. Always do your own research and backtesting.

Box Breakout EMA OI Strategy
🔹 Matching Tool for Order Flow Insight 🔹
This is a proprietary-level matching tool I designed to reverse-engineer order flow behavior in a way that’s clear, visual, and instantly actionable.
Rather than relying on traditional volume indicators or lagging signals, this tool reveals who is in control of the market in real time—buyers or sellers—using a unique algorithm built from the logic of professional order flow systems.
It’s an excellent companion for traders across forex, futures, options, commodities, and equities, and works seamlessly for both scalping and swing trading styles.
This tool is not just reactive—it’s strategically built to mirror institutional behavior, helping traders align their execution with the actual flow behind price moves. When paired with live order flow data (like we use in our community), it becomes a powerful real-time edge.

DISEGNATORE Livelli ATR H4 v1.3 FinaleThe Drawer needed to display "ATR. St. Dev. CALCULATOR H4" output.

ATR St. Devs. CALCULATOR H4a Calculator able to create a Statistical Sample of 4h time-specific candles and their ATR Values, and projects its Standard Deviations on any timeframes chart.

Livelli Giornalieri ATRDisplays daily Open price and its ATR Value projections. Import the data from "ATR Screener"

No Wick CandlesOVERVIEW
In trading, no wick candles (also called full-body candles or marubozu in Japanese candlestick terminology) are powerful momentum indicators. They show that price moved in one direction for the entire duration of the candle, with no pullback or hesitation.
No upper wick : price never went above the open (in bearish case) or close (in bullish case)
No lower wick : price never went below the open (in bullish case) or close (in bearish case)
No wicks at all : open and close are the exact high and low = a full-body candle
⚠️ Caution : One candle alone isn’t always enough for a decision — confirm with:
• Volume
• Support/resistance context
• Follow-through candle behavior
SUMMARY
No wick candles = strong conviction from buyers or sellers with zero hesitation during that time period.
They’re valuable for scalpers, breakout traders, and momentum strategies — especially on high volume or at key levels.

Livelli Settimanali ATRDisplays Weekly Open price and its ATR Value projections. Import the data from "ATR Screener"

Economic Event Timer & Alerts [AlgoXcalibur]Stay ahead of market-moving news with this real-time event tracker and countdown alert system.
This essential algorithm displays critical scheduled events that may influence sudden spikes in market volatility, helping you stay aware and reduce exposure to unpredictable moves before they even happen. Featuring a captivating on-chart display with event titles, adjustable time zone, real-time countdowns, and live alert notifications — you’ll always know what’s ahead — so you can prepare, not react.
🧠 Algorithm Logic
The Economic Event Timer & Alerts system delivers critical market awareness through an array of integrated functions. At its core, a live countdown table provides real-time updates on the day’s scheduled economic events, with dynamic, color-coded countdowns that ensure fast and easy interpretation at a glance. Complementing the table, Countdown Alerts notify you 30 minutes, 10 minutes, and 1 minute prior to each event—giving you clear, timely reminders without the need to constantly monitor your chart. The adjustable time zone input supports ET, CT, MT, PT, or UTC, so the displayed time-of-event aligns with your trading session. Rigorously refined, the algorithm updates the table daily—and clearly displays No Scheduled Events Today to provide certainty and reassurance on days without scheduled events. Packaged in a minimalist, unobtrusive design, the tool remains visually clean and focused for serious traders.
Updated automatically for hassle-free peace of mind.
⚙️ Features
• Time Zone Selector: Easily toggle between time zones to match your trading session.
• Countdown Alerts: Enable real-time notifications to keep you informed and aware of events without having to monitor the chart.
• Update & Expiration Awareness Feature:
This innovative feature includes a simple visual and alert system that prompts you when it’s time to reload the indicator & recreate alerts — ensuring your alerts are always tied to the latest data update.
🔄 Update Available
On the final day of current event data, the indicator will:
• Display Update Available on the indicator’s table
• Send an alert at 4:00 PM ET reminding you to reload & recreate alerts
You can load the updated version anytime that day.
⛔ Expired
If not reloaded, the next day the indicator will:
• Display an EXPIRED banner on the indicator’s table
• Send a Data Expired alert every day at 8:30 AM ET that prompts you to recreate alerts, until you do or disable the alert.
This prevents missing event alerts unknowingly.
Why is this feature necessary?
Even though the indicator is updated when necessary (typically every 2–4 weeks) to provide upcoming event data automatically, TradingView alerts do not auto-update —they stay tied to the version of the script that was active when the alert was created.
This thoughtful refinement is designed to ensure your alerts remain synced to current events and ready for when it matters most.
🚨 Protect Your Capital
At AlgoXcalibur, we understand that the best way to be profitable is to avoid unnecessary risk.
Dedicated to empowering traders with insight that matters, we designed this tool to transform inconvenient economic calendars into effortless, essential information—displayed directly on your chart. Whether you’re managing open positions or timing new trades, knowing when impactful events are about to hit is crucial to being proactive, protecting capital, and trading with confidence. This is not a technical analysis indicator—this is a risk management tool that provides traders with a fundamental edge.
Built for traders who value risk management, market awareness, and algorithm automation.
🔐 To get access or learn more, visit the Author’s Instructions section.

Livelli Mensili ATRDisplays monthly ATR Value projections. Use this indicator combined with "ATR Screener".


🚀 NQ1 Smart Limit System V5### 🚀 NQ1 Smart Limit System V5 | מערכת לימיטים חכמה ל-נאסד"ק
מערכת מסחר פורצת דרך שתוכננה במיוחד עבור סוחרי נאסד"ק (NQ1, QQQ), במטרה לאתר נקודות היפוך בעלות סבירות גבוהה. האינדיקטור לא מסתמך על שיטה בודדת, אלא משתמש במנוע קונפלואנס (מפגש אסטרטגיות) רב-עוצמה ובמנגנון אישור דינמי כדי לספק איתותי כניסה איכותיים למסחר מבוסס פקודות לימיט.
---
### **🎯 תכונות עיקריות**
* **מנוע קונפלואנס רב-שכבתי:** מזהה אזורים בהם נפגשות מספר שיטות ניתוח טכני מוכחות:
* **מבני ווייקוף (Wyckoff Springs):** לזיהוי שבירות שווא וספיגה מוסדית.
* **נזילות כלואה (Trapped Liquidity):** לאיתור אזורים מהם יצאו מהלכים חזקים.
* **אורדר בלוקים (Order Blocks):** לאיתור טביעות הרגל של "הכסף החכם".
* **🧠 מנגנון אישור דינמי:** לפני כל כניסה, המערכת מריצה בדיקות בזמן אמת כדי לסנן איתותי שווא:
* **בדיקת מומנטום:** מוודא שהמחיר לא מגיע לאזור באגרסיביות יתר.
* **בדיקת קונטקסט רב-זמני (MTF):** מוודא שהעסקה תואמת למגמה הכללית.
* **בדיקת ספיגה (Absorption):** מחפש סימנים של כניסת קונים/מוכרים חזקים ברמה.
* **🧬 מערכת DNA לומדת:** המערכת מתאימה את עצמה לביצועי העבר ונותנת משקל גבוה יותר לאסטרטגיות שמצליחות בתנאי השוק הנוכחיים.
* **🚀 התאמות ייעודיות ל-NQ1:** כולל כלים ייחודיים לנאסד"ק כמו זיהוי מספרים עגולים, אסטרטגיית פתיחה, מסנן מניות מגה-קאפ, וניהול תנודתיות קיצונית.
* **📊 שלושה מצבי מסחר:** בחר את סגנון המסחר שלך:
* **🏃 Scalping:** למהלכים מהירים ואגרסיביים.
* **⚖️ Balanced:** גישה מאוזנת ובטוחה.
* **🎯 Swing:** למהלכים גדולים וסבלניים.
---
### **איך זה עובד?**
המערכת פועלת בתהליך חכם בן 3 שלבים:
1. **זיהוי:** המערכת מזהה אזור פוטנציאלי בעל ציון גבוה ומסמנת אותו במצב **"ממתין"**.
2. **אישור:** כאשר המחיר מתקרב לאזור, המערכת מפעילה את מנגנון האישור הדינמי. אם האזור עובר את הבדיקות בהצלחה, הוא משתנה למצב **"מאושר"**.
3. **ביצוע:** רק לאחר קבלת סטטוס **"מאושר"**, הסוחר יכול להציב פקודת לימיט עם תוכנית מסחר מלאה (כניסה, סטופ ויעדים) שהמערכת מספקת.
---
### **איך להשתמש?**
1. בחר את מצב המסחר המתאים לסגנון שלך (`Scalping`, `Balanced`, `Swing`).
2. המתן להופעת אזור על הגרף עם סטטוס **"ממתין"**. אין לפעול בשלב זה.
3. עקוב אחר האזור. אם הוא עובר את הבדיקות והופך ל-**"מאושר" ✅**, זהו האות שלך להתכונן.
4. הצב פקודת לימיט בפלטפורמת המסחר שלך בהתאם לנתוני הכניסה, הסטופ לוס (SL) ויעדי הרווח (TP1, TP2) שהאינדיקטור מציג.
**גילוי נאות:** אינדיקטור זה הוא כלי עזר לקבלת החלטות ואינו מהווה המלצה פיננסית. מסחר בחוזים עתידיים כרוך בסיכון. יש לנהל סיכונים בקפידה.
### 🚀 NQ1 Smart Limit System V5 | Smart Limit System for NASDAQ
A groundbreaking trading system designed exclusively for Nasdaq traders (NQ1, QQQ), engineered to identify high-probability reversal points. This indicator does not rely on a single method; instead, it utilizes a powerful multi-layered confluence engine and a dynamic confirmation mechanism to provide high-quality entry signals for limit order-based trading.
---
### **🎯 Key Features**
* **Multi-Layered Confluence Engine:** Identifies zones where multiple proven technical analysis concepts converge:
* **Wyckoff Structures (Springs):** To detect false breakouts and institutional absorption.
* **Trapped Liquidity:** To pinpoint zones that initiated strong impulse moves.
* **Order Blocks:** To track the footprints of "Smart Money".
* **🧠 Dynamic Confirmation Mechanism:** Before any entry, the system runs real-time checks to filter out false signals:
* **Momentum Check:** Ensures the price isn't approaching the zone too aggressively.
* **Multi-Timeframe (MTF) Context:** Verifies that the trade aligns with the broader market trend.
* **Absorption Check:** Looks for signs of strong buying/selling pressure at the level.
* **🧬 Adaptive DNA System:** The system learns from its past performance, giving more weight to strategies that are succeeding in the current market conditions.
* **🚀 Special NQ1 Adaptations:** Includes unique tools for the Nasdaq index, such as psychological round number detection, an opening range strategy, a mega-cap stock filter, and extreme volatility management.
* **📊 Three Trading Modes:** Choose your preferred trading style:
* **🏃 Scalping:** For fast and aggressive moves.
* **⚖️ Balanced:** For a safe and well-rounded approach.
* **🎯 Swing:** For large, patient moves.
---
### **How It Works**
The system operates on a smart 3-step process:
1. **Identification:** The system identifies a potential high-score zone and marks it as **"Waiting"**.
2. **Confirmation:** As the price approaches the zone, the dynamic confirmation mechanism is activated. If the zone successfully passes the checks, its state changes to **"Confirmed"**.
3. **Execution:** Only after receiving a **"Confirmed"** status can the trader place a limit order with a complete trade plan (Entry, Stop Loss, and Take Profit targets) provided by the system.
---
### **How to Use**
1. Select the trading mode that fits your style (`Scalping`, `Balanced`, `Swing`).
2. Wait for a zone to appear on the chart with a **"Waiting"** status. Do not act at this stage.
3. Monitor the zone. If it passes the checks and becomes **"Confirmed" ✅**, this is your signal to prepare.
4. Place a limit order in your trading platform according to the Entry, Stop Loss (SL), and Take Profit (TP1, TP2) levels displayed by the indicator.
**Disclaimer:** This indicator is a decision-support tool and does not constitute financial advice. Trading futures involves risk. Please manage your risk carefully.
