Flag Pattern - How To Trade It?Hi Traders. Today's topic is regarding one of the most traded patterns of all time. One thing about trading patterns, is that they are very context-based. Imagine you're taking a head & shoulder setup within a wide range, does it makes sense? The answer is no, most likely you'll stuck in a chugging condition draining your mental capital. Pattern trading is something requires good understanding of the pattern itself, knowing when to not use it, is as equally important as when to use it. In this post, we'll assume the scenario is an uptrend.
Scenarios:
Pending order above the flag
- This is the typical textbook entry, where a pending order is placed above the top band of the flag, anticipating a break & flush higher. One big problem with a pending order, if that you'd sometimes get tapped into some low quality setup due to probes or spikes.
Taking the re-test of the bottom band
- This is a rather aggressive way to trade the flag pattern. But it's good way to trade it if you've enough experience and confidence in the continuation of the trend. By entering at the bottom band, you're setting yourself in an advantage due to your wider SL and better Risk-to-Reward.
Where should I place my SL?
- This may seem easy, but believe or not that majority is always having their SL way too tight, usually just a few pips below the flag. Even though majority know its not the right thing to do, but that tend to be the case. SL signals an invalidation of a particular setup, if it is triggered. If you're constantly getting stopped out with your thesis still intact, watching market going into your intended direction is a big slap in your self-confidence. Best way to manage your emotion is to use an ATR-based SL (systematic), or back-test it.
Where should I place my TP?
- This is a tricky one. Some utilize Risk-to Reward based target (Eg. 1:3RR), while some prefer using trailing stops. Personally, having your targets at key technical zones make more sense. There's no right or wrong! It all depends on what suits you the most!
How can I maximize my profit?
- The only way to maximize your profit, is to find out the MAE (Maximum Adverse Excursion) & MFE (Maximum Favourable Excursion) of the strategy. How far did the price run after the TP is met (MFE)? How far did the market goes against you before moving into your favour (MAE)? Eg. If 90% of the valid flag pattern has a MAE of 10 pips, why should you set your SL 25 pips away? Do your due diligence to find out what works best.
What's the current phase of the trend? (1st, 2nd OR 3rd)
- From my experience, I always split a trend into 3 different sections.
1. The first phase is where the momentum is fresh and piping hot, strong impulse with clean price action.
2. The second phase is where price is slowing down with spikes. The logic is simple, for any market to move higher it requires sellers, due to the zero-sum game. What causes a trend is the logic of supply & demand imbalance. This phase is where market is trying to consume more opposite directions' players, to have further continuation in the initial trend.
3. The third phase is where new players and late joiners chasing the market, without knowing the momentum is dying out. Usually it is very choppy with grinding sort of condition. This type of market condition gets people frustrated and its mentally exhausting. Majority are entering and exiting as the market goes nowhere, causing it to chug back and forth.
"Trading is a lonely business, have faith in how far you can go." - Neoh
Let us know in the comment section what's your favourite continuation pattern!
Trade safe as usual.
Do follow my profile for daily fx forecast & educational content.
Flag

Similarities between Cup and Handle and A BullflagThis Bullish log chart for BTC shows a clear cup and handle
Yet these could be acting as a quasi-bullflag, flagpole at the same time.
Both experience an upward move initially (cup, flag-pole) and further consolidation period (handle, bullflag)
Both are bullish but experience a similar development as bullish tools. That will always continue to form over time.
The handle if viewed in a 3D state can be seen as 'protruding' much like a flag on a flagpole. Creating this distinction.

Swedish sterling - darvas box trade patternDarvas box trade explained with Swedish sterling as example.
Where to put on the trade, where to put the stop loss and context.
Context, swedish sterling is a stock with increasing trade volume, in a rising market and in a bullish sector
with news of a recent patent filing to the european patent office.
Swedish sterling
A clean tech company, filing a new patent of Sterling engine which is more efficient in converting to electricity .
The company's latest product - the PWR BLOK 400-F - is a propriatery solution for recycling energy from industrial residual and flare gases and converting these into 100% carbon-neutral electricity at high efficiency.
According to an independent certification, the PWR BLOK is the cheapest way to generate electricity that exists today, yielding greater CO\2\ savings per krona invested than any other type of energy.

Bull flags explainedBull Flags are one of the most well known & easily recognized chart patterns.
The most important factor in identifying any flag pattern is the clear "staff" or "flagpole"; there should be a straight run upwards leading up to the pattern or it is not a valid pattern.
After the straight run upward price starts to Zig Zag between two converging trendlines forming a tight wedge (it can be slanted, or even symmetrical) until the price "breaks out" above the upper trendline signifying a possible continuation in trend upwards.
Bull Flags have the highest success rate out of any pattern and work extremely well when paired with long term support & resistance areas. Enter at the invalidation point of the pattern (A), second entry on the bullish retest (B). Pennants that are “tighter” have higher success rates, look for patterns forming on top of long term resistances (not below) to increase probability of success also. Pattern height is measured and added to swing low before breakout for possible target.
Sometimes large size traders can generate liquidity by faking out under the pattern support as we can see on some of the examples. The liquidity generated by triggering stop losses underneath the pattern can fill large position sizes for whales and is a good indicator for a long position once the price confirms support back inside the pattern.

In depth look at continuation bull/bear flag structures/patterns
Hello everyone:
Welcome back to another quick educational video on price action structures/patterns.
Today let's go deeper into the continuation correctional structure. Specifically, the continuation bull/bear flag structure.
First it's important to understand that a bullish/bearish flag is a continuation correction.
They are representing a correctional phrase of the price action, before resuming the previous impulse phrase.
As price action traders, we must be able to identify what correction we are seeing.
This will allow you to get ahead and make your forecasting so you are prepare to any potential entries
Second, bullish/bearish flag correction will appear in any time frames, any markets, and in different sizes.
Typically a flag correction will have at least 2 swing highs and 2 swing lows and relatively even and proportion in angle or length.
They can be slightly slanted or very parallel to each other. Remember the market is not perfect, it wont always present us picture perfect, textbook structures.
Thirds, So its important to understand multi-time frame analysis, top down approach.
A LTF bullish/bearish flag may or may not have the potential to start taking off massively due to the higher time frame showing us a conflicting bias.
So its important to add as much confluence to your trade as possible.
As always, any questions, feedback or comments please let me know :)
See you all in my next weekly outlook stream.
Thank you

BULLISH FLAGHere we have an example of a bullish flag.
It has a very good risk to reward ration ( 1 : 7 = 750 pips ).
It's an easy pattern to spot and you can combine it
with Fibonacci retracement or support/resistance or whatever tool you want.
DON'T LET ANOTHER FLAG UNTRADED ! ! !

BEARISH FLAGHere we have 2 examples of a flag pattern.
A smooth one & an aggressive one, both works quite well.
You can combine it with a Fibonacci retracement or support/resistance or whatever toll you want.
It's easy to spot & if you catch the breakout the risk to reward is very good ! ! !

[EDUCATIONAL] BULL Flag on ETH/USD - Full ExplanationIn this technical analysis we are reviewing the price action on Ethereum. The confirmed bull flag is a very powerful signal and I will be explaining how you can trade it.
Both flags and Pennants are quite similar to each other and have proven to be powerful chart patterns in technical analysis. They are considered 'continuation patterns'. First of all it is important to understand where the name is coming from.
If you look at the picture to the left you should get a pretty good idea. The price goes up strongly (in case of a bullish pattern, downwards for bearish) and then enters a moment of soft consolidation with a slight bearish trend (or in case of a bear flag it should be bullish, you get the point).
The price is expected to continue in the direction of the move it had seen before (in this case the strong upwards momentum) after it breaks out of the flag. Ethereum has JUST confirmed the breakout on the bull flag, which should indicate a bullish continuation according to this pattern.
Follow me for consistent high quality updates, with clear explanations and charts.
Please like this post to support me.
- Trading Guru
--------------------------------------------------------------
Disclaimer!
This post does not provide financial advice. It is for educational purposes only!


Psychology and description of bear flag and bull flagHi every one
Kindly like the ideas if it is helping you and leave a comment
What is a Flag Pattern?
A Flag pattern is a trend continuation pattern, appropriately named after it’s visual similarity to a flag on a flagpole. A “Flag” is composed of an explosive strong price move that forms the Flagpole, followed by an orderly and diagonally symmetrical pullback, which forms the Flag. When the trend line resistance on the Flag breaks, it triggers the next leg of the trend move and the stock proceeds ahead. What separates the flag from a typical breakout or breakdown is the pole formation representing almost a vertical and parabolic initial price move. Flag patterns can be bullish or bearish.
Bullish Flag:
his pattern starts with a strong almost vertical price spike that takes the short-sellers completely off-guard as they cover in frenzy as more buyers come in off the fence. Eventually, the price peaks and forms an orderly pullback where the highs and lows are literally parallel to each other, forming a tilted Triangle or rectangle.
Upper and lower trend lines are plotted to reflect the parallel diagonal nature. The breakout forms when the upper resistance trend line breaks again as prices surge back towards the high of the formation and explodes through to trigger another breakout and uptrend move. The sharper the spike on the flagpole, the more powerful the bull flag can be.
Bearish Flag:
The bear flag is an upside down version of the bull flat. It has the same structure as the bull flag but inverted. The flagpole forms on an almost vertical panic price drop as bulls get blindsided from the sellers, then a bounce that has parallel upper and lower trend lines, which form the flag.
When the lower trend line breaks, it triggers panic sellers as the downtrend resumes another leg down. Just like the bull flag, the severity of the drop on the flagpole determines how strong the bear flag can be.
The Psychology of a Flag Pattern
Flag patterns start off violently as the ‘other’ side gets caught off guard on the trend move or as bulls/bears become overambitious. On bull flags, the bears get blindsided due to complacency as the bulls charge ahead with a strong breakout causing bears to panic or add to their shorts. Once the stock peaks out, the bears regain some confidence as they add to their short positions only to get trapped again when the breakout forms causing more short covering. Since short-sellers from the initial flagpole run up may still be trapped, the second breakout forming through the flag can be even more extreme in terms of the angle and severity of price move. This is when forced liquidations and margin calls kick in. The same happens on bear flags, just inversely.
Traders, if you liked this idea or have your opinion on it, write in the comments. I will be glad
Thank you for seeing idea . please support us
Good luck.


SOYBEAN Higher Time Frame Outlook on structureHello traders:
Looking at soybeans from the higher time frame perspective and its price action structures.
We see strong bearish impulse down from mid of 2018, and has been in this larger channel like structure ever since.
Price has been consolidating for these few years, and finally breaking to the top in the recent times.
What I like about the price from a structure point of view is that we just broke the previous top, but on the lower time frame the price broke up in a corrective structure.
I see this type of price action over and over again. Price breaks up, catching a lot of buyers, then see a strong sell momentum down.
I wouldn't be surprise to see some bearish impulse from the lower time frame, to bring the price right back into this larger channel structure, and we can potentially see the next bearish move from the top.
For now, happy to be a bit more patient, and wait for price to develop a bit more.
thank you

What is a pennant?A pennant is a continuation pattern.
Statistics of pennant patterns
- In 75% of cases: a pennant’s continues in the same direction.
- In 15% of cases: a pennant’s continues tries to continue in the same direction but pulls back.
- In 55% of cases, a pennant continues in the same direction and reaches his target.
Notes on pennant patterns
- pennants with a narrow base perform better
- A pennant is stronger if there are no false breaks (false pattern exits).
- If their are pullbacks after exit from the pennant: its bad for its performance.

Why I decided to change my trading style and method after years Why I decided to change my trading style and method after years:
First of all, I am not here to bash and talk negative on other traders who are consistent traders who do use these methods to their success.
I am sharing my on personal journey and opinions, based on past experiences and past journal/history.
By no mean I am saying my current style or strategies are better. I am creating this post for educational purpose only, no offense/criticize is done here to anymore.
1. I actually used to trade with S/R, supply/demand zone, and small number of indicators (MACD, EMA, RSI...etc), you can look back at my tradingview post years ago.
2. I have been somewhat consistent with those strategies and methods, and do generate profits within the years that I have adapted those type of strategies.
3. The time when I decided not to implement those methods anymore, is because when I back test and look back at my trading journals and history, I find out ways that I could improve my trading potential.
4. I realized many of these S/R, indicators are actually acting as an invisible barrier for me when I trade.
5. Many of my trades in the past have been short lived due to me sticking to my trading plan and exit a trade when the price hits a certain "criteria" such as 50 EMA, some S/R zone, or fibs level...etc..
6. While its good to follow and stick to my trading plan and risk management, but when I do self reviews on past trades, I begin to find out there is a lot of profit I am leaving on the table.
Or, poor trade management due to similar issues.
7. I begin to do in depth research on these topics and come to my personal conclusion.
8. The true is, I dont need any of those indicators and S/R level/zones on my chart. Simply remove all of them and see how the price is on a raw level.
9. I fully understand when the price is in its impulsive phrase, none of these indicators or levels can "resist" or "support" the price. The price simply breaks them or "impulse" through them.
When the price is in its corrective phrase, this is when those levels or indicators work since price is in a correction nature and allowing those levels or indicators to "catch up" to the price.
10. When I dig deeper and more research and analysis, I begin to see the market on a totally different level. I realized how the market moves, and why it moves.
11. There is a saying, "Dont just believe what the others are telling you", or "Try it yourself before saying it out loud". I certainly put in time and effort into this and have done substantial amount of work to be confidence to express here.
I hope this brief post is helpful for those traders who are still trying to identify how to trade and what to adapt in their trading plan. I welcome any positive/constructive comments, feedback, suggestions or opinions.
Thank you

AUDUSD BOMB January 2019 (RUN 1)## Month Summary / ASR (Run 1)
### Chart Screenshot
()
! (s3-us-west-2.amazonaws.com)
### Key Metrics
Trades 4
Wins 1
Losses 3
Breakeven 0
Win Rate % 25.00%
Return % 5.33%
**Opportunities Missed = ~3%**
**Opportunities Capitalized On = 8.17%**
### Lessons Learned
Just gotta keep your eye out for those high probability setups. Impulse and corrective pattern series are a great indicator for this pair.
With that said, also be willing to take the mid probability trades because you never know if theyre going to take off or not.
**Wicks**
Wicks accompanied by fading price action is a no-go
**Impulses**
Avoid weak impulses, especially those that retrace or have fading price action (curve)
**Channels & Trends**
Potentially should be avoiding trading continuations in a channel unless it very cleanly breaks out of the range to up side.
! (s3-us-west-2.amazonaws.com)
**Price Action**
Overall quite a volatile month with the huge spike at the start and increasing volatility after the 25th. Mid month was corrective trending in ascending an descending channels.
**Key Zones & Levels**
This month had one clear S/R zone.
**Other Confluences**
Didn't notice any this time around except for the I/C/I patterns previously mentioned.
**Missed Trades**
Missed a couple of small trades on the 14th, 17th of the month (+/-1%)
**Psychology**
Need to continue to focus on the positives when backtesting. Should not care about losses as they are a good place to learn what to avoid.


Bitcoin | Bullish Flag Breakout Done, Now What's Next??BTC/USD (Update)
In 8h Chart, EMA200 (7332) & EMA100 (6950) Both Are Play Important Rule As Key Support & Resistance Level.
At the moment, Bulls holding the EMA100 (Support) & Pushing the Bitcoin price towards EMA200 (Resistance)
Now If Bulls Cleared the EMA200 (Resistance) & Weekly Candle Close Above it then Bitcoin Might PUMP Hard in Coming days (We Could See HALVING FOMO)
If Bitcoin Bulls Failed to Hold EMA100 (Support) Then It Might Retest the 6.4-6,6k Area Again.
BTW Bitcoin Bulls Already Broke the Bullish Flag & Now Forming Another tiny Bullish Flag.
In Case of Bullish Move, Target Will be Between 7340-7380 (CME gap Area)
Outline : At the Moment, I'm Bullish on BTC & It Might Test the 7340-7380 Area, & Also Waiting for Weekly Closing, It Will be Important for Halving FOMO.
Please like the idea for Support & Subscribe for More ideas like this and share your ideas and charts in Comments Section..!!
Thanks for Your Love & Support..!

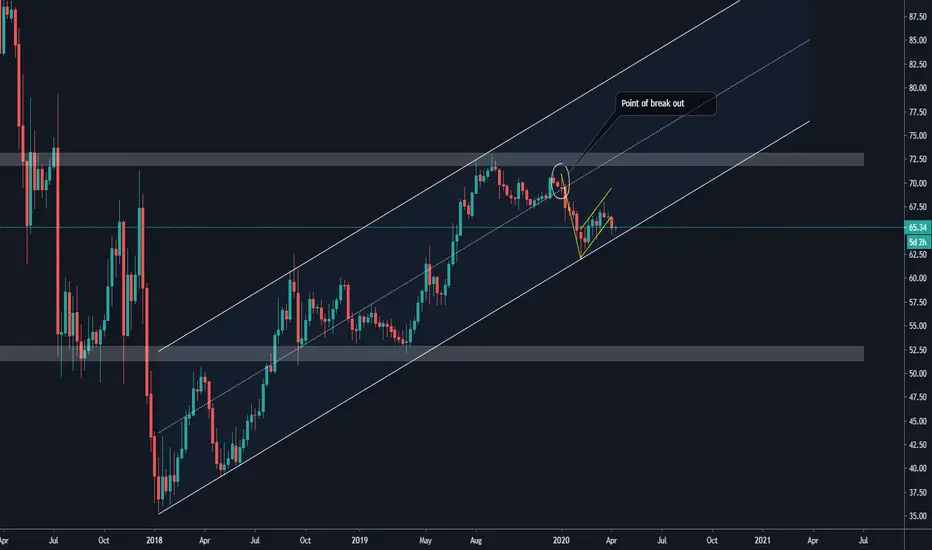
High Probability of the directionThis time I won't cover the technical analysis of bitcoin again. I will look forward for the technical analysis of the bitcoin dominance in the market because like what we've known that the bitcoin's price is highly correlated with the bitcoin dominance in the crypto space.
Following my previous analysis about this dominance, we can see that there are 2 important patterns to watch both on the macro and micro level. The first important pattern for the macro level is the form of the uptrend channel. The dominance is still trending inside this channel whatsoever although it's now trending slightly above the lower support trend line.
The 2nd pattern is the bearish flag pattern (yellow) of current dominance and I even called this pattern since the dominance was around 66.42%. Specifically for this pattern, the dominance has given us a brief confirmation of this pattern comes true.
The main idea that I want to say here is that the confirmation of bearish flag on micro level has given the confirmation that the bears are gaining a huge strength to potentially breaks the lower support trend line on macro level up trend channel. With current condition, there might be a high probability that the dominance will push lower to breaks the current support. And if this happens, we'll see the dominance to test the white support trend line again which is around 50% level.
The weaken of the bitcoin dominance simply means the weaken of the bitcoin's market capitalization comparing to the total market cap in this crypto industry. Meaning that there is possible huge money outflow to occur in the future. With a huge money outflow means there will be a thickening in supply which will drive the price down.
How to Trade Bull & Bear Flag Pattern | Flag Pattern Tutorial !Bull & Bear Flag chart patterns Tutorial!
Bull Flag : A bull flag forms in bullish trending market, After a strong bullish movement when this pattern forms it signals the market is likely to move more higher. Bull flag pattern much similarly looks like a horizontal parallel channel or downward parallel channel along with a strong bullish vertical rally; when we draw the pattern it looks like flag on a pole, that's why they are called bull flags.
How to identify and Trade Bull Flags : - It is easy to identify a bull flag you just need to look for a Bullish Vertical Rally or Trend which is Pole of the Flag then identify the consolidation which will look like either horizontal channel or downward channel which will be the Flag. After identifying the pattern you can enter at the bottom of the flag or you can enter when price breaks the upper trendline of the flag which is more safe.
The breakout may also be a fakeout that's why we will take help of Volume and RSI Indicator to confirm the breakout. As shown on the below example you can see when price breaked the uppper trend of the flag the Trend drawn on the RSI was also broke and the Volume was high.
()
( *Key things to know : If the retracement measured from the vertical rally or Flag Pole retrace more than 50% the pattern becomes weak and it may not be a Flag Pattern but sometimes it stays valid if it breakouts above the uppertrend of the flag.)
Bear Flag : Bear Flag is just the opposite of the Bull Flag Pattern. A bear Flag forms in bearish trending market. Bear Flag pattern signals the market is likely to drop more lower. You need to identify Bear Flag in bearish trend when the price of a financial asset drops then if the price forms a horizontal channel or upward channel which will look like a inverted flag whose flag pole will be upside and the flag will be downside.
Stay Tuned; 👍
Like this tutorial & share your comment below and also
check other tutorials with example linked below;
Thank You-

GOLD patterns bigger picture so just have a look right at both price bars and ask yourself at this current moment do you really think gold is still gonna move higher ? yes might creep up a little bit more but this does show more signs for moving lower again at some point in time
my overall bias for gold is to move higher eventually but i cant see this happening anytime soon and just look at the size of the last corrective phase ? course there's going to be buys and sell within this structure zoom out and just look at price action
this tells you everything you need to know but yes this could all fail and gold could just fly to the moon but just be aware that this shows signs of moving lower
hope this help a few as i've been getting a lot of messages about gold this is just what i see has anything can happen
hope you've all had a great weekend lets get some profits :)

ASC, When will it bottomed? Just a retrospective view on what has happened on this stock, we wait to see the end of it, I like the way the heights were reached a clear double top, and the continuation patterns along the way down. one of these days the turn shall come. I am keeping my eyes open here and my options too.
