Flag

CHFJPY Trade Opportunities Look For Buy Opportunities Above 110.210. Look For Sell Opportunities Below 110.048.


BASICS TECHNICAL ANALYSIS - TRENDFOLLOW FORMATIONFORMATION ANALYSIS: PRICE PATTERNS AND CHART FORMATIONS
A trend setting of technical analysis is formation analysis. In doing so, certain combinations of movement and correction are considered.
If such a combination is detected, the trader can try to trade the resolution of the formation.
Basically, a different is made between the trend continuation formations and the trend reversal formations.
They are often caused by resistance and support lines.
Trend continuation pattern:
Confirm the strength of a trend. These are, for example, rising / falling triangles. Even flags and pennants (see picture) are seen as a trend continuation.

BTC?USDTHi Guys, please like me now and follow me on tradingview.com/u/omidmokri/
I'm going to show you my Bitcoin trading plan in USDT and Break-even level of various Miners for BITCOIN.
Look at the latest analysis update The illustrations are illustrative.
As you remember English is not my native language (i'm KURD and VIVA ROJAVA), so please don't judge my English strictly, I will continue to improve my skills in this.
Guys, if you like the idea please like the button, this will be the best thanks.
If you have any suggestions on how I can improve my video ideas you can write them in the comments!
Thank you for your support, I appreciate it.

GbpUsd Daily Chart : Long Idea, Bull Flag Pattern looks like we have some resistance around the 1.33 area we need to get through

Bearish FlagTrading patterns is legit. But always wait for a breakout and a confirmation. We have there an HnS, clear in m15TF. A bearish Flag and an Engulfing in H4. This shows the pair's power is still favoring the bears.

Bearish flag analysis on XAUUSD (gold)From the chart, there has been an increase in gold in a close-knit candlestick pattern, with it increasing value.
This has caused a bearish flag to arise.
This is recognised due to:
1. quick increase to reach the basis of the flag.
2. once it was reached began forming an upwards flag shape with close-knit candlestick high/ low closes.
3. once the flag lines (orange) got closer together, there is an expected bear break out due to it being a rising flag.
4. This is also backed due to the reduced volume once the flag is reaching a close.
5. as it can be seen, the break out downwards should see the price of gold to begin to slowly fall.
However, this is not the case lately due to today's actions by the Dow in response to Trump's tweets about China.
Nonetheless, if such didn't occur this should see the XAUUSD to fall lower to reach 2nd support, leading to either consolidation or a bounce off support to bring the price of gold back up. If this did not occur gold prices will be in a downtrend.
Due to Trumps recent tweets and fears of a recession due to the inverted bond yields, this may see gold prices to continue to rise upwards breaching resistance and being able to surge past $1580.
This is an example of a bearish flag and can be used to analysis all other shares, crypto's and commodities, if probable analysis is completed.

Lessons on Support and ResistanceSomething went really wrong last night during the student meetup session.
This was the topic on Support and Resistance I love to cover and teach my students the support line with the clock is the 2nd chance entry for me to engage in a buying opportunity and Magic Candle should appear on the support line when the market break and close below the consolidation that signals a potential bullish flag setup.
So here it goes.

gbpnzd pattern tutorialprice action is all about pattern repetition here u will c same structure not so long ago now it repeating if u hopping to buy wait fo break up then buy

EURUSD 4.29R 154.3 PipsHorizontal Support Resistance, Diagonal Support Resistant (Parallel Channel), Dynamic Support Resistance (EMA 10 EMA 20), Pin Bar.
Enter at Horizontal Level
Exit at Horizontal Level
Enter at 50% Retracement of Pinbar. 50.0 Fibonacci Retracement Level.
Exit at Horizontal Level of the Equidistant Channel. (Target 1)
Exit at the Measured Move Measured Objective of the Flag Pattern. (Target 2)

Trend figure Flag, pennant and triangle
These figures tell us the trend continues.
Flag has even structure, doesn’t contract or widen. It’s just a flat with slight slope against the major trend. The indispensable condition is the availability of a flagpole – a swift and strong movement toward trend and the following stop. At this moment, the market take a short rest and gains new volumes for another dash. You can work either from the bottom level of the flag itself, or when the top one is broken.
Pennant is the same thing as flag, but it contracts with time. Flagpole is also required.
For details, see here >>> pamm-trade.org

LONGTERM - W1 CHARTThis post is for educational purposes only.
Will get updated.
Feel free to comment below.

Basic Market Structure and Pattern BehaviorBasic Market Structure and Pattern Behavior applied on every timeframe and any markets (stocks, crypto, fx, futures, indices etc).
Common Patterns I showed on the chart:
Double Bottom / Triple Bottom
Bull Flag / Bear Flag
Ascending Wedge / Descending Wedge / Expanding Wedge
Head and Shoulders / Inverted Head and Shoulders
Cup and Handle / Inverted Cup and Handle
All of given patterns generates good trading signals, and if you combining them with indicators you can have a good trading system.

Rising flag - pennantFlags and Pennants Pattern
We will now analyse the flags and Pennants Pattern, two other Patterns of the technical analysis. Flags and Pennants are short-term continuation patterns ; are among the most reliable Patterns and they represent “short breaks” (not longer than 20 sessions) during a Trend, before the Trend continues to go in the initial direction. Let’s analyze them point by point. Remember, that in order to understand better the Patterns of the technical analysis, you should know how the Trend Lines and Resistances/Supports work (For this reason we suggest you to read: What is a Trend and what are Trend Lines; Resistance and Supports).
Features of Flags and Pennants Pattern
– When they occur: both Patterns occur during a strong Uptrend or strong Downtrend, that have high volumes of exchanges.
– What are: The Pennants are similar to the Pattern of the symmetrical Triangle, but they have a shorter duration and they are smaller (They are also similar to another Pattern, The wedge). The Flags are similar to the Pattern of the rectangle, but they have a shorter duration and they are smaller.
– In Flags, prices are contained between two parallel lines.
– In Pennants, prices are contained between two convergent lines.
– Duration: both figures, can last from 1 to 12 weeks and should normally last from 1 to 4 weeks (if they are over 12 weeks, a Pennant would be classified as a symmetrical triangle while a Flag as a rectangle). If they last between 8-12 weeks, their reliability as Patterns is less.
– Volumes: High during the Trend that precedes these Patterns; Decreasing and Low, during the formation of these Patterns. Then, rising in the Breakout point (When the Prices go out the Pattern).
– Breakout: although they are usually continuation patterns, it’s always better to wait for the Breakout from one side of the Patterns to be sure whether there will be a rise or a decline. Finding other confirmations (From oscillators or of Candlestick Patterns), and even a Pullback it would be better (There is a Pullback when the Prices return to the line that they have just cutted, then bounce on the line and come back to continue in their initial direction).
– Minimum Target Price: you have to measure the width of the Pattern, and project it from the point of Breakout upward or downward (depending on whether prices have gone out from the Pattern with a rise or a decline).

CRUFF "BULLISH" GOLDEN CROSSCRUUF is now displaying one of my favorite bullish signals - GOLDEN CROSS
Also, very bullish is its current buy opinion by one of Wall Street’s leading Technical indicators barchart.com, which just issued CRUUF an 80% "Buy" short term! > Hence Time Sensitive?

USDJPY - Possible bear flag?On the 4hr and daily, it can be seen that a bear flag is being formed.
It is possible the market will make one more push to the upside forming a Higher - High before price reverses.
Price is currently sitting on support at 111.300, I will monitor closely how price reacts to this level.
If any bullish momentum on the smaller timeframes is spotted (1hr, 15m) I will consider taking a small position of a long trade (50 pip TP1, and 25 pip SL - 2:1 RR).
If the long trade is taken, I will look for a major reversal around the 112.0 - 113.0 region.
If no bullish momentum can be spotted around the current market price and support of 111.300 , it is possible that the bulls are exhausted and the price plummets towards the anticipated downside.
I will take a short trade around the price of 111.00 and 110.700, previous support depending on how well this zone holds, if it doesn't a major move down is expected.


BTC current candlestick patterns: Morning star vs. Bull PennantHi all,
I've been getting a few DM's and emails on what I think of the current price action. In past videos and written publications I have said that things got into extreme overbought territory on the shorter time frame charts. I mentioned that things could trade sideways and be a little choppy for a few days while momentum rolls back to neutral territory. If the bulls step up you'll see reactivation of the trend as momentum neutralizes before the next push.
I wanted to put out a quick educational content on two candlestick patterns and how to handle them. On the daily chart you can see a risk of Bitcoin forming a bearish morningstar reversal. However, on the 2 hour you can see a Bull Flag. So which is it? Are the bulls or bears winning?
Classical Chart Patterns:
1. Morning star Pattern - this can be a bull or bear reversal pattern. The current situation is perfectly setup for a reversal if the bears capitalize. It's a 3 candle chart pattern, which I have highlighted below. #1 - You have a bull impulse candle, followed by #2 a doji and then 3rd candle has to break below more than 50% of the bull candle #1. The doji candle looks like a star in this case and signals that the market has uncertainty where it's going as momentum is neutral. So the morning star reversal is confirmed if BTC were to break below the level I have highlighted in the chart. Which happens to be our buy zone. Now of course worst case scenario is that you put your stop loss just under this level and the market reverses only to stop you out and reverses back to a bull. This is where you need to pick a side and accept the fact that you maybe wrong and manage your capital losses. I'm keeping my stop at $3300 for now until I see further breakdowns below the market mainly because I can afford to take such a loss (less than 2% draw down on my portfolio). However you need to do the math and figure out what is the maximum hit you can handle without going over 2% draw down. Depending on your trade size maybe you can afford to keep your stop in safe territory with me because you didn't take on too much risk or you might have to keep it around that $3,500 level. Do the math and figure it out.
2. Bull Pennant Many of you already know the Bull Flag and Pennant pattern here. On the BTC 2 hour chart frame you can see this bull pennant forming. Ideally BTC is supported at $3,600. The way you measure the profit zone on such a pattern is measuring the length of the flag pole and then adding that back on top of the flag. This puts us right at $4,000. Bear flags you do the reverse.
Please do your own research and google these patterns and more to build out your knowledge base as a technical trader.
Regards,
Bobby

BTC Bull Flag - What to look for nextA look at some recent BTC impulse moves higher and subsequent price movement. I prefer bull flags that drift lower on lighter volume and then push higher on increased volume. However, ultimately the breakout volume and follow-through move is what's important. Box A is yesterday's move showing an ideal pullback level. Box B is the Dec 17th move which turned into a good multi-day run. Notice the volume. Box C is the failed breakout attempt in early January. How will this latest one turn out is yet to be seen but so far the volume signature is positive. Sitting tight for a another day will help cool off the technicals and let the EMAs catch up. After that, we'll want to see some volume on a push above 3700 and see prices hold above that level.


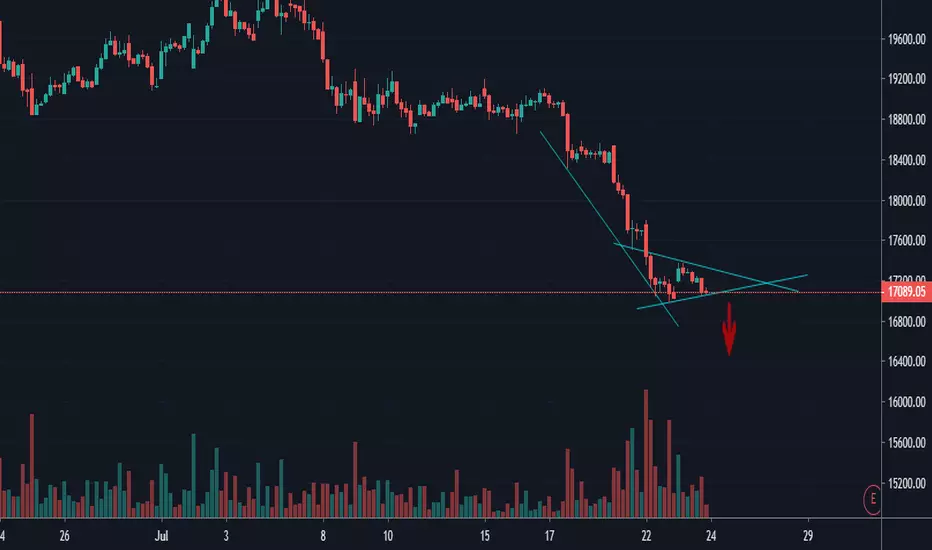
Bearflag and Bearish pennantA Bear Flag is a price action within the context of a downtrend that produces an orderly price increase consisting of a narrow trend range comprised of higher swing/pivot highs and higher swing/pivot lows.
The success of a Bear Flag can be greater after a significant downside move due to the possible increase of overhead resistance.
Bear Flags can be stronger when the swing low that begins the pattern is also an all time low due to the possible lack of underlying support.
Target of bearflag is the lenght of flagpole and you need to measure this lenght for breakdown target from support line of Flag(wait till this support line will be broke and after you can entry)
Bearish pennant:
The initial sell-off into the pennant can be steep or gradual.
The Pennant represents a pause to consolidate, retracing a small part of the initial sell-off within a tight channel. A break-down from this channel is the first hint that a bearish pennant could be in the making.
Once the shares break down from the pennant, it is possible that another sell-off – the same size as the first
Target of bearpennant is the same like in bearflag,measure lenght of flagpole and this lenght from pennant support line will be the target
