Bitcoin Whales And Their Bots Controlling The MarketA few days ago i said i would make an educational analysis about that pattern i saw a few days, something i have seen many MANY times this year. Especially since May until September this year. What do we see here:
After breakouts like we had a few days, where we see a squeeze up happen within 1 or 2 minutes, then we see a dump happen just as fast and usually around 50% of the up move. The most important factor, is the speed of the push down. These are bots in action because nobody can react that fast AND feel so confident to push the price down during a squeeze up, unless you know you have unlimited funds and volume to play with. The only time i know they failed, was in July, when the 6800 broke and we squeezed up to the 7.500. If you remember, i mentioned that several times, because since that moment, it took a while until they showed up again. There were around 200 mil contracts liquidated that day :)
After the push down has been made, we usually see a small bear flag forming, like they are getting a feel of the buying pressure of the market before they start to make their second push down. A few days ago, the buy volume was probably still too strong to we tested the high again, something that didn't happen earlier this year. So there is a slight change in that pattern.
Today's move, which i warned for yesterday was only a 30/40 point move up. But the push down fits the profile i described. And since we are at lower prices now, it might be fair to assume they are at it again.
What and why do they do it.
Why? They play games with over leveraged traders. We always get these obvious resistance or support levels. If it's a bull or bear flag or trend line breakouts. So many traders who are breakout traders go long at these highs while THEY have their short orders already in the book ready to get filled. Then they push the price down just as fast, putting these bulls under immediate pressure. They wait and see a bit how the rest of the market reacts, if they see buying volume dropping, they start to push the price down even more.
Because they trapped these breakout traders, they use THEIR volume as their own, because as soon as these over leveraged traders start to get in a loosing position, they will cut their losses and start to sell as well (or get liquidated which has the same result). So creating volume (fuel) for these whales. And if the market is not strong enough to catch the volume of both of these sellers, we start to see those Bart moves and the market starts to drop again.
You probably remember this chart i showed a week ago, before that move up happened and dropped again. This is a bigger version and a different pattern but it's the same tactic. In case you wondered how the hell did i know it would move like that, well know you have your answer :). Of course it is an assumption upfront and it's not that easy, but it does increase your odds in trading when your aware of these kind of things.
If i get a big support for this educational analysis through likes, i will make a part 2 and will show you examples of these patterns. It takes me many hours to make these kind of educational posts, so i will only continue when i see enough people find it interesting.
I also still have that long term (with log trend lines ) educational post, i am half way but still needs a lot to complete it. I might post that one as well in the near future. Maybe some will finally see and understand the false preferences most TA analysts tell you. Not on purpose, they simply don't know any better. Now i don't need to prove my right with this and i won't even try, it's up to you to make your own conclusion. But i think the fact 90% of retail traders looses money in the financial markets says more than enough. The chart is here below, probably finished but i might still adjust it a bit
I can see only 1 solution for this manipulation, that is combining the volume of all exchanges in 1 order book. Because then they would much more volume to push the price around. Now they only need 1,2 or 3 exchanges and the rest will follow since there are so many bots reacting automatically. Combining all the volume , would make it MUCH more difficult to control. Not impossible, because the same manipulation happens on the normal markets as well.
So in other words, the decentralization of crypto is actually biting it in it's own ass when you think about it. Very unfortunate, but it's the hard truth.
Please don't forget to like if you appreciate this :)
Previous educational analysis:
Flag

Exclusive Update, Bitcoin And Solving The Bart Move Puzzle As promised i would explain my view on why i assumed today's bear flag was NOT a Bart move.
There is more to is than just these 2 moves, the bigger picture also plays a part, but i won't get into those details because it would make things too complicated.
1: The spread between high and low
2: A drop and quick move above the previous high
3: Difference in buying volume
4: Bull flag and follow through, on the right a failed one
5: Similar move also similar volume
6: What is the difference here?
7: Left is a triangle shape, right is a bear flag shape
1: First of all, number 1 was the most obvious from the start. Don't mean it already said it would not be another Bart move, but it was an obvious difference, as i also mentioned in my
Bitcoin' analysis. On the left it's 150 points and on the right it's 70 points. The one on the left is enough to create liquidations or stops getting hit on a leveraged exchange like
Bitmex' which creates fuel to do what they want.
2: A second big clue is number 2, a quick drop and a big move up just as fast and went even above the high of the previous few candles.
3: The high buying volume on number 2, most probably even just bots who are programmed to buy within a certain price range. The high volume shows the order book was filled with
sell orders, so perfect opportunity to get a big amount of long positions in.
4: During this drop and bounce up, we can see a small bull flag on the left with follow through reaching the target of that bull flag. First though would be, hmmmm this is a bullish
sign. That is true as well, but look at the one on the right, what do you see? We see similar buying volume but no follow through in price? This i want you to answer yourself in the
comment section.
5: Explained at point 4
6: Here is where we continued to drop today and bounced up again at the Bart move on the left. This one is not easy to judge, there is a difference in volume here but not significant.
On the right it obviously just continued to drop while on the left there was support at that low.
7: The whole pattern on the left has the shape of a triangle while on the right it was simply a bear flag.
The orange part was an extra bonus, does not have much to do with the Bart pattern.
Now who ever these people are, if it's on entity or simply just several traders who use the similar bots, i don't know. But to make it easy, i always look at the market as if it's me against one big whale. Now the blue circles, you have to see those as if the bots are eating up all the sell orders on the way until a maximum level. Now if their bags or not filled up enough, they simply stop the price there with sell orders or simply just sell walls, unless the rest of the market pushes the price down. So they try to eat up all the sell orders as fast as they can before someone else does it and hit the break at a certain point. Just think of it in that way, makes it easier to comprehend/visualize.
Please don't forget to give a like if you appreciate this :)
Current Bitcoin analysis:

Medium term downside?If what I have drawn on the chart can be considered a true bear flag then, in the medium term, we could be in for some significant downside.
This is rule number 8 on pennants from stock-charts....
"Targets: The length of the flagpole can be applied to the resistance break or support break of the flag/pennant to estimate the advance or decline."
So, IF this is indeed a true blue bear flag then a good estimation/target for the length of the coming downtrend would be roughly the size of the original pole. The original pole was roughly 5.2k USD and so we could expect a breakdown to be a similar length. This would give us a target somewhere around 4k USD region.
As of right now I am simply WATCHING this formation and waiting to see how she plays out...a break below 7kusd could mean this is a true target and to begin to prepare yourself for such a move....anyways, this will be my last chart for today (i have been spamming them as i finally got some time to sit down and do some research) I hope you all have a wonderful day/night and good luck out there.
Red Boar

Every major chart pattern between 3/18 and 3/28!Chart patterns are great ways to anticipate reversals of trends. Other indicators like MACD and RSI can help you figure out more exactly when but identifying chart patterns are a great way to see a reversal coming. The first step is knowing how to draw trend lines. With these you can more easily see how the range of a certain move is changing. If the range is either tightening or widening, the likelihood is that a reversal is coming. Typically, volume will also steadily decrease throughout the pattern, ending in a climax in which the trend reverses. On the chart you can see several types of common chart patterns labeled, bearish in red and bullish in purple.
I always consult Thomas Bulkowski's guide on chart patterns if I am ever in doubt. His observations were for stocks but work really well for cyrptocurrency trading as well. Especially because patterns tend to form a lot more quickly than traditional securities.
Resources:
(1) Rising (ascending) wedge
(2) Bullish pennant
(3) Falling (descending) wedge
(4) Descending broadening wedge
Peace and love,
crypt0guy

ETHUSD - Descending Triangle + Bear FlagHi All,
This is just a initial stage of the pattern, the pattern usually change to ascending/descending triangle and sometime to raising/ falling wedge or a channel. Just monitor on the declining of the volume until the breakout volume spike. (to identify the target price).
1. Descending Triangle - This pattern is usually a continuation pattern, but some cases, there is a breakout at the triangle resistant line.
2. Bear Flag.
3. Stoch RSI just returned from overbought
once bear flag pattern is confirmed, it will affect the MACD and form a bearish divergent. (and confirm the descending triangle bearish pattern).
This TA is for Educational purpose and not a financial advice. If you are happy with my charts and would like to follow more in the future, feel free to follow my profiles.

BTCUSD - Raising Wedge and Bear FlagHi All,
This TA is just for Education Purpose. The price target for both is below $8000.
1. Bear Flags. Volume is decreasing until selling volume coming in.
2. Raising Wedges . Volume for wedge is decline until it reached breakout points.
*This TA is for Educational purpose and not a financial advise. If you are happy with my charts and would like to follow more in the future, feel free to follow my profiles.

Trading Chat PatternLooking for patterns...I ran across this....classic text book break out pattern
Pattern - Flag
Pattern - flag top consolidation
Break with show of strength
9EMA support
.....and a good take off!!

How to Trade Bullish Flag Patterns - ETHUSDThe flag pattern is fairly simple with just three components.
1. The flagpole
2.The flag
A strong up trend
Ideally, we want to see a retracement of 38.2% or less for trend continuation.
To trade the flag, you can time an entry at the lower end of the price channel or wait for a break up above the upper channel. Look to take profits by projecting the length of the flag pole at the bottom of the flag.
Stop loss is to be placed below the flag channel.
Anyone interested to know more about forex, cryptocurrencies or crypto mining feel free to drop me a message here.

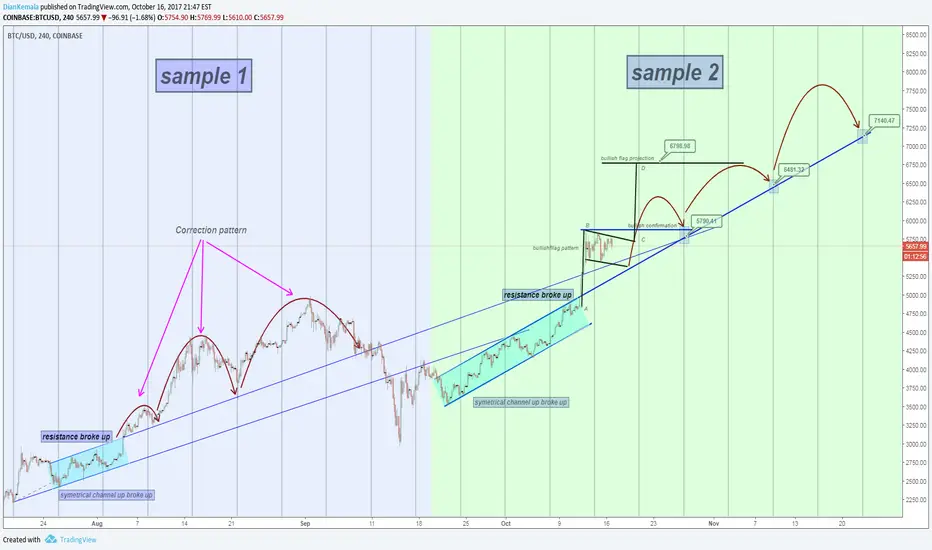
BTCUSD Correction patternIn this post i wanna share one of my method in analyzing price movement.
sample 1 :
we have symetrical channel up. After channel up resistance broke up, that resistance line will become support in next wave. Price action will try to break it as correction pattern.
sample 2 :
Again, we have same pattern here, symetrical channel resistance broke up with bullish flag pattern.
1. Bullish flag projection at 6798.98, This projection will reach after 1 candle full break up B line as bullish confirmation, If B cannot break, BTCUSD will down for correction back to A.
2. After B break up, we gonna see correction pattern as sample A, resistance line become support
3. If BTCUSD still follow the cyclic, next correction at 5790, 6481 and 7140.
Flag trading. Education.This post will be more interesting for new comers on the Trading.
May be it will help somebody to feel more confident on the market.
Sometimes you will lose money on this trade setup, but in the long run you will be profitable. It's enough for good setup.
This is my way to trade Flag. And Flag - there is just a special case of Elliott Wave theory.
I'm looking for strong impulse, then wait correction to 0.618-0.786 Fibo level and jump into the trade with Risk Reward 1:2.
If Fibo 0.618 - then RR = 1:2
If Fibo 0.768 - then RR = 1:4
There is a good setup, not so risky&profitable, it can be like a regular salary on the market)
Few days ago good example RR 1:2

The (psychological) origin of a flagThe theory of flags
Flags are my favorite technical formations. They have a trend confirmation character, are easy to recognize and grateful when you trade them correct
Ideal-typical flag:
A bullish flag is a massive, strong volume move followed by several days of sideway trading sessions to lower price action on much weaker volume followed by a second, sharp rally to new highs on accelerating volume again.
The first big Move: First of all, you have to check in which trend phase the market is trading. Flags used as continuation pattern should always and exclusively traded with the trend direction! There should be an evidence of a sharp advance, usually on heavy volume. A gap also can be seen as the “first big move”. This move usually represents the first leg (Flagpole) of a significant advance and the following flag is merely a pause.
Flagpole: The flagpole is the distance from the first move break to the high of the flag.
Flag: A flag is a sideway / light decline-move that slopes against the previous trend. If the previous move was up, then the flag would slope down (and vice versa for a downtrend). Ideal typically this decline/sideway move finds support and stops at the 38,2 fibo-retracement of the first big move.
Duration: Flags are applicable in all timeframes but the longer the timeframe, the better they are applicable. The reliability of patterns that are very shortterm are well debated since years. I made some good experiences in the short-term trading as well as in longterm trading.
Break: For a bullish flag, trading above its flag-upper-edge (resistance) signals that the previous move has resumed.
Volume: Volume should be heavy during the advance that forms the flagpole. Heavy volume provides legitimacy for the sudden and sharp move that creates the flagpole. An expansion of volume on the resistance break lends credence to the validity of the formation and the likelihood of continuation.
Targets: The target of a flag is the length of the flagpole. The technical target is derived by adding the height of the flag pole to the eventual breakout level at point.
In my former educational series (Basics of 1-2-3 Trading - ) I have illustrated the important entrypoint “2”, which is a pivot point in the market when you are trading the trend.
Reminder: Entry with 1-2-3-pattern:
A flag is very similar to this scheme and are a kind of adaption of this 1-2-3-theory.
So much to the theory. But what really happens with such a formation above all @ the flag edges?
One must make clear for it to himself how market participants operate and think
I try to illustrate this Market Psychology with the help of an example:

Educational 07: Flag and Pennant PatternsThese are continuation trend pattern that are found frequently in the markets. I wanted to cover it and share it with you as I found some good charts during my research that are forming such patterns. One of them is Aban 2.41% offshore, chart link attested below. (I have also provided some examples given in comments box below for your references and goodself.)
There are 3 important things to note:
1. The Initial Impulse (Flag Pole)
2. The retracement (Actual Flag or Pennant)
3. The Measured Move (an equal reaction swing to the pole)
These factors conclude to the formation of Flag and pennant patterns. They are easy to identify and provide high potential returns.
Comment below your questions regarding the same to improve your and other traders understanding of the patterns by providing examples and any explanations if required.
Thanks for the support,
With Regards,

Educational Post (Different Chart Patterns)Hope this will help you! Give thumbs up & comment if you like it!


