Ethereum into the simetric triangle from JUL 2018, Accumulation?Hello, in this technical and special analysis for Ethereum I see that Ethereum is into the great zone of accumulation began from 2018 to actually. So, it;s very strange what Ethereum is so prepared to a bullish cycle in the future. So, lets me see any thing. Ethereum has complete the Elliot wave ABCDE, and now later of the E, I see that Ethereum want to going to broke up the simetric triangle. And this reprresent a bullish cycle between finally on 2020 and 2021, so wich is represent a new altseason epiosdes. But, for there we need to check out the Bitcoin and Etherum Dominance to see if Ethereum going up and Bitcoin stay consolidated in this altseason possible.
Now, look above what I add this screenshoot in daily timeframe. We are in the elliot wave 12345. Now, we a re in the possible retrocement approximmately in $190 USD each Ether and later to continue the last elliot wave # 5. And there, Ethereum must be to leave at $250 USD approximattely to complete the last elliot wave. So, when Ethereum going in this zone, we need to check up what Ethereum will do if accomplish the drop of Bitcoin price to going to accumulate more Bitcoin as Ethereum, or just Ethereum going to the moon and Bitcoin it's drop seem a new altseason. But, this theory, we need to check the Bitcoin dominance and Ethereum dominace what this cryptocurrency will do as a indicator factor.
But, some in the moment we can to trade Ethereum in H4 and H1 technical analysis to earn money while Bitcoin and Ethereum take decision in the big timeframe!!!
Don't missing my technical analysis for there situation and investigate there!!!
Ethereum (Cryptocurrency)

ETHUSD 1D KELTNER CHANNEL PULLBACK TRADING STRATEGYTrading Pullbacks with Keltner Channel
Trading pullbacks successfully can only be done in the presence of a strong trend. Using the Keltner channel indicator we can study how the price behaves around the upper and lower envelopes to gauge the strength of the trend.
As you already learned when the price hugs one of the two bands and crawls along with the band, we have a case for a strong trending market.
There will be highlighted small retracements while the price hugs the upper Keltner band. Notice that the price can retrace to the area around the 20-EMA. It won’t give you an exact price, but a price zone from where the price can potentially bounce and the bullish trend can resume.
This is a good way to measure pullbacks in price. Successful trading doesn’t require catching the exact turning point.
For a better timing of our trades, we can use the Stochastic RSI indicator in combination with the Keltner indicator for more confluence.
The trade trigger is simply to follow with this Keltner Channel pullback strategy. Pull the trigger when the price retraces to the middle band and the stochastic indicator develops a crossover from oversold territory.

HVQ + QRSI + Clouds - Setting up a narrative; market structureThis video goes through my charting process using the trio of indicator's I've developed to work in concert with each other.
This is the process I use to explore historical price action and develop a narrative to use during my near-future trading activity for that asset.
Just as important as entries and exits, understanding market structure and being aware of potential changes to this structure, before price plays out it's new role, is extremely important.
These visualization tools make it possible to find structural influences within an asset that do not necessarily exist, in a classical sense, on a typical price candlestick chart.
Not explored in this video is how to further use these tools to build risk distribution profiles for any trade, long or short, as well as the use of compound tickers to determine individual asset allocations.
Most technical indicators focus too much on entries and exits while not providing nearly enough insight for aligning those buy or sell conditions with the current market structure and meta-analysis. Take a step into my workflow for setting up a trading environment that focuses more on working with the structure of an asset rather than against it. In this video I build rules for potential entries, stop-losses, and set up a narrative for an asset on some historical data (cheating, I know, but this is "educational" content ;)
QuantRsi, Heffae Clouds, and the HVQ Volatility Index are available via PM, there is also a link with access information in my sig.
For your education and entertainment!

Do you hold Ethereum?I have posted the daily time frame.
1. Ethereum has a weekly bullish divergence. More than 60 percent time the divergence in higher time frame are worth taking risk IMO.
2.Another thing to notice is also the sentiment in the market. Many people are still in fear. When in fear it a good chance to buy if we can control our emotion.
3, Daily candle looks extremely bullish. 10 April volume a lot of supply has been absorbed and then followed by the huge demand candle(indicated by arrow).
4. In the 2 years time frame if we notice once ETH breaks 175 there has been a good run up.
What else do you think other confluence i have missed?

#ETH BTC update [April, 16th] : Good jumpAfter Breakout , Almost 7% Profit Gained & Now Facing Important Resistance (0.02460 Sats).

BitcoinSymbol: BTCUSD
Here is another tool that we have to share with you.
Long green dot and short red dot.
Find more details about it in our scripts on our trading page.
----------------------------------------------------
Want to level up your trading skills?
We just realesed our new course! Follow our tradingview page and visit the link in our bio if you are looking for new strategy to add to your arsenal.
Also checkout our trading indicator available in the link on our page.
---------------------------------------------------
Thank you for your continued support, God bless.
- Major League Trader

ETH Moving closer to the Supply ZONE!!After a decent 20% move in the last 24hrs can we break this resistance and make it up to the supply zone?
In my opinion this looks like a key level and could be a hard level to break.
we could consolidate just below this resistance for a few days before a re-rest.
ETH/USD 4hr

ETHBTC ScytheMy first pattern identified as my own, the Scythe :) It appears to look as a reapers 'scythe', it is a bullish continuation pattern. It can be identified various times on this chart, and is appearing quite often across major and minor alt coins. Alligator can be seen to at a reversal point and 'eating' bullishly. Lets go ETH!

$ETHUSD - Macro WyckoffMacro possibility. Would be similar to golds 7 year accumulation. Publishing to be able to watch it play out.

5-0 pattern. Bearish + 20% and bullish model + 51% Real tradingI must say almost all of this movement I took. Short + 8% (instead of 20%). At long + 55%, entry into the long was lower than shown in this example. I will attach the trading idea for which I worked below. She was published here on January 22. I used other methods of analysis and work, but I used this method that I want to talk about as evidence for my methods. The graph shows a bearish pattern, which immediately turns into a bullish 5-0 pattern, a very rare phenomenon. And that's why I decided to make this idea of training.
I want to say that the 5-0 harmonious pattern is very widely used in other markets, rarely in the cryptocurrency, due to the very low professional preparedness of the participants in this market.
Trading in this pattern can be either profitable or unprofitable, in the first place it depends not on the method itself, but on the person who uses this method. The 5-0 pattern is effective in areas of potential trend reversal. Just the pair ETH / BTC was in such a zone.
The profitability of trade largely depends not on the method of trading, but on the ability to use it.
________________________________________
A bit of history.
Harmonic patterns are the development of the idea of ordinary geometric patterns, using Fibonacci levels to more accurately determine pivot points. By the way, I almost never use the Fibonacci levels, as I see without them, what they show. For beginners in trading, it is better to use them.
By the way, who did not know initially in the father of harmonious trading Harold Gartley there were no Fibonacci levels. Only more than 80 years after the creation of the theory and the successful application of Larry Pesavento in practice, did Scott Kearney begin to pervert and sculpt exact numbers for each pattern that are far from real application on the market. It’s not customary to talk about this, but their main business is not real trading, but selling books, unlike Harold Gartley, who was a successful trader in the 20-30s during the Great Depression and became a millionaire! This is not an imaginary millionaire trader, a seller of courses and books, but a real trader who made all his fortune on real trading.
In mid-1935, Harold published his best work and the first book, which, translated into Russian, was called "Profit in the Stock Market."
The initial circulation of this book totaled only 1,000 copies. This book was very popular among traders, despite its very high cost. The book was worth 1,500 dollars, at that time it was possible to buy three new Ford cars for this amount. This is many times higher than $ 1,500 nowadays. One fact is that his books, which were being sold at the height of the Great Depression, let us understand how high authority he enjoyed among the people of the world of finance. The name of the pattern is Gartley Butterfly, which bears the name of its discoverer.
Already after the death of Harold, Billy Jones bought from Harold Gartley's wife the patent rights to the book “Profit in the Stock Market”, then continued to print it in large volumes. And a "perverse improvement" in working methods for making money on book sales started. That's why I have such a negative attitude towards such "specialists."
You have to be, not seem to be.
________________________________________________
5-0 pattern.
Pattern 5-0 is the youngest harmonious model (it is a variation of it with the Fibonacci grid thanks to traders of books on TA). The model usually represents the first pullback of a significant reversal trend. This is a relatively new model with 4 segments and specific Fibonacci measurements of each point in its structure, which excludes the possibility of a flexible interpretation.
Formation of the figure begins with a slight movement of the market, in the direction of a previously existing trend (segment AB), which was preceded by a comparable depth correction (XA). Point B, in this case, should not be higher than the level of 161.8% of point X. This is a fundamental point. If point B "goes" higher, then almost certainly the trader is dealing with short-term correction and the continuation of the existing trend.
The segment of the aircraft, in relation to the segment AB, is formed in the range between 161.8% and 224%.
The CD segment is a correction within the framework of an emerging trend. The correction depth (according to the classical pattern algorithm) should be 50% of the BC segment.
5-0 pattern template measurements:
The segment AB should be from 1,130 - 1,618. before the XA extension.
The segment BC should be a continuation of the segment AB from 1.618 to 2.240.
Point D should be formed at the level of 0.5 segment BC.
The segment AB must be equal to the segment CD, (AB = CD).
_______________________________________________
There are bullish and bearish formations of this pattern on the market. The graph shows both variants of the 5-0 pattern.
Bullish 5-0 pattern.
As you can see, the structure of the price movement at the time of the formation of the 5-0 pattern is generally very similar to the model of the Dragon figure with the development of goals. I made the ideas of training on this model of a figure and will fix it in ideas under the article.
Point 0 - the beginning of the downward movement, point X - the first correction upward, point A - the completion of the correction and the beginning of the fall down, point B - the end of the fall and the beginning of the strong upward movement, should be located at a level between 1.13-1.618 from XA, that the point C - the completion of a strong upward movement should be located between 1.618-2.24 from AB, point D is the end of the fall and the beginning of the upward movement, here we are trying to enter the market. The input should be at the level of 50% correction from the BC.
Bearish 5-0 pattern.
The structure of the bearish model of the 5-0 pattern is remotely similar to the model of an asymmetric head and shoulders or an inverted Dragon figure with a working out target.
Point O is the beginning of growth and the beginning of the formation of the model, point X is the beginning of correction down, point A is the beginning of growth and completion of correction, point B is the end of growth, should be located at the Fibonacci projection level between levels 1.13-1.618, point C is the end of a strong fall and the beginning of growth, point D - completion of growth, the place where we should open a deal for sale should be at the level of 50% correction from the BC.
Conservative traders are looking for additional confirmation before entering the trade. The 5-0 pattern can be either bullish or bearish. Goals can be set at the discretion of the trader, as the pivot point may be the beginning of a new trend. The common stop loss levels lie beyond the structure level beyond point D or the next important level for the Fibonacci sequence.
_______________________________________
Objectives for this pattern.
As it is a reversal pattern, which can act as a reversal pattern of the whole trend (the emergence of a new trend). You understand that there can be no clear goals, unlike simple figures. If you really get to the beginning of a new trend, the goals can be huge. It is important here not to exit the market prematurely. So that your profit does not turn into a loss, use the movement of stop-loss as the upward movement develops, but take into account the volatility of the instrument.
In this example, on the chart on the ETH / BTC pair, you can clearly see what the goals for this pattern can be.
The bearish model made a profit of + 20%
Channel support stopped a further drop in prices.
The bullish model made a profit of + 51%
The first goal is the resistance of the rising channel + 18%, as we see the price there was delayed for some time.
From this zone the reverse corrective movement to the support of the channel could take place. But, the price has successfully overcome this zone.
In total, the profit is + 51% of the entry point (point D).
In two models, the profit in theory was + 20 + 51% = + 70%.
But the reality is different, I have a profit of + 8% + 55% = + 60%
I rounded the interest for a better understanding, I will say one thing, there was no liquidity at the maximum to reset a significant position, and therefore the profit is much less than the theoretical one on the schedule.
______________________________________
Violations of the pattern 5-0.
More than any other pattern, the 5-0 structure presents a unique opportunity for decision making when the area of opening positions breaks through. In all 5-0 models, the best moment to enter depends on various ratios within the structure. When trying to make a deal while forming an unsuccessful 5-0 pattern, the trader still needs to look at the prevailing trend and at models at smaller time intervals.
Of course, the 5-0 pattern is not an ultra-precise model, and it may not work out even in the most correct situations on the market. What to do if the price has broken through all levels and left the channel, in such cases, the authors of harmonious trading offer quality ideas for opening positions. The first target in this case may be the area of correction 0.886 from the entire movement. Therefore, if prices fell outside the channel and broke through the 50% area, then we should expect continued decline.
______________________________________
Advantages and disadvantages of pattern 5.0
Despite the popularity of this pattern, I would like to first consider the disadvantages of the pattern. The main of its shortcomings should be called the poor "recognition" of the figure. After all, not all formations in the real market, exactly correspond to the ideal book example. In this example, I used exactly the ideal option for the ease of presenting information, and a person who is interested in adding this pattern to his arsenal of trading can also look for more complex formations for work. I would advise beginners to look for ideal models for work, as they are more predictable.
The developers and "popularizers" of the pattern emphasize its versatility. In their opinion, the pattern works with equal efficiency on any trading instruments and at any time intervals. If in the first part this statement is undeniable, then with regard to timeframes, the use of the pattern raises many questions.
On short timeframes, this pattern is not effective due to the high content of "white noise" and which does not allow to clearly identify and build the boundaries of the pattern.
Over long periods of time, the created corridor is so wide that, in fact, it can only indicate the direction of the trend (and even then in the long term). Thus, the efficiency of using this figure very much depends on the correctly selected timeframe. The ideal timeframe for work is 4 hours-1 day.
Remember the most important thing, this 5-0 pattern is effective in areas of potential trend reversal.
_____________________________________
I wrote above that I will attach trading ideas for this pair that I worked on. Which trading ideas made it possible to take profits in shorts + 8% and long + 55%.
1) This one worked in short when the head and shoulders formed. Published November 24th.
ETH / BTC Pivot Points. Ascending Triangle - Head and Shoulders
Result in short + 8%
2) The trading idea for which he worked in long. Published January 22.
ETH / BTC Coin operation. Reversal zones. Double bottom.
The result is now + 55%, the entrance was practically at the very minimum price when confirming support.
Perhaps we will see a reversal of the main trend by ETH18, if the price closes above the downtrend line (red line).
Also, in the idea of training on this graph, you probably all noticed which figure is being formed and how much you can earn from fulfilling its target.
Remember, trading is a game of probabilities.
Who trades from the situation created in the market - earns.
Who trades on the basis of what he wants - receives a loss.
The crowd trades out of their desires, not market probabilities. The crowd always loses.
From the pixels of thinking of individuals, a way of thinking of the crowd is created.
Thanks to the thinking and desires of the crowd, we earn.
The more stupid a society is, the higher the percentage of earnings in it is smart.
To earn, you need someone to lose money. No other way.
Under the article, I have fixed 31 learning ideas.
I didn’t even know that I already have so many of them.
Knowledge and experience are power!!!

ETHUSD 1D LONG or 1H BEARISH CONTINUATION1D ASCENDING TRIANGLE BULLISH BREAKOUT.
Wait for a Daily Candle Close above triangle.
1H PULLBACK TRENDLINE BEARISH CONTINUATION BREAKOUT.
Wait for a 1H Candle Close below Pullback Trend line.
Or wait for a Bearish Continuation Break-Hook-Go candle pattern.

Awesome 16% Profits with no leverage for now on my scriptHello Guys,
It's my first idea being published here :) I will get better in time regarding the presentation
I have been working on different strategies last year and now it's fully ready and working.
You can check out more in the video.
We've been able to get a 20x ROI in 2019 with a 2.5 leverage on bitmex, the script is not only doing great profits but i want to share my knowledge with you guys and let you know that the full automation process is offered for free, you can connect your bitmex account to the bot for free.
It's working great and I wanted to do to help small accounts grow their position over time.
Starting with a 0.1 beginning of January 2019 would give you 2 bitcoin right now. In the long run you need to find a solution that works and manage risk the right way. And that's what I am offering now here.
Cheers guys
Please like, follow me and share this great script

How I used RSI to play ETH breakoutI was able to capture 74 pips off ETH this morning. All I used was basic price action, combined with RSI confirmation. If you have any questions please comment below. ENJOY!


Robot Nails a 55% Move on Ethereum - Congrats to the Bot!Note the close above the Blue line? This is all we need to make a trading decisoin.
It is very easy to read price action if you have a reference point. These support/resistance lines are there to help you read where the buyers and sellers are likely to make a stand.
MasterChartsTrading Price Action Indicators show good price levels to enter or exit a trade.
The Blue indicator line serves as a Bullish Trend setter.
If your instrument closes above the Blue line, we think about going Long (buying).
For commodities and Forex, when your trading instrument closes below the Red line, we think about Shorting (selling).
For Stocks, I prefer to use the Yellow line as my Bearish Trend setter (on Daily charts ).
Be sure to hit that Follow button! Please find me on social networks via the link on my profile page for more ideas from MasterCharts!

Ethereum : Major resistance and liquidation zoneHello all, this will be a quick update analysis about Ethereum. Let's get it started!
Red zone is the liquidation zone
White zone is the resistance area
The price however is in its decent parabolic bull run since December 2019. And since the parabolic bull run, we haven't seen any significant corrective pattern. This time could be different for ethereum. The reason why I believe there will be a significant correction is based on these 3 factors :
1. Although the price has already broken out of the white resistance trend line, it's now testing the liquidation zone as it has a confluence with the white trend line and the .382 fibs level as a major resistance. White trend line is the previous broken support that is now become resistance as well.
2. The MACD histogram has a potential of ticking down on daily time frame. This will indicate that the bulls is losing strength
3. Looking at the green zone, it's beautifully aligning with the yellow line which is the previous broken resistance that is now become support. Since the price has broken out of this yellow line as resistance, we haven't seen any retest toward this line as a support to confirm the phase 2 of my break out strategy.
We might see a correction in the upcoming days. The additional reasons why I believe that there is now a shifting period from bulls to bears is that bitcoin potentially will have its major correction to the downside.

BTCUSD OPEN HOUSE! SEND IN YOUR VIEWSLet’s Hear your View
What’s your take on this huge bearish divergence on BTCUSD.
Do you think the price would move Up or Down or maybe Break the Uptrend Channel?
Send in your Views and let’s discuss!

(Educational) Trade Management Life Cycle using ETHUSD In this video I cover some of the techniques I use for trade management. I rarely post about how I specifically manage trades. Enjoy!
*Side notes*
-2% of 10,000 is $200. I said $2,000 but then corrected myself :)
-I stated I have probably haven't lost more than 5 consecutive trades. Honestly, I probably have but it has been a while. Due to my defensive trading nature it's more likely I would take a string of losses and break-evens, but rarely a large string of straight losses.

ETHUSD – Ethereum on bullish side on the way to testing followinWelcome to our Academy. We’re here to help you achieve what you have been looking for.
Use our free analysis where you have everything you need for potencial trade ideas and profit.
ETHUSD – Ethereum on bullish side on the way to testing following levels
Trend: Buy/ Neutral
At the moment: Buy/ Neutral
Price now: 167$
Support/Resistance:
R2: 179.60
R1: 172.65
S1: 164.85
S2: 162.15
S3: 158.10
S4: 151.90
Price action:
Ethereum is following bullish flow to following targets. As we can see sellers already failed to break lower on last swing low. Becasue of that fail, we can easily expact price to go back to higher high from retracement on level 164.85$
Potencial trade idea:
Bulls targets:
T1: 172.65
T2: 179.60
Bears targets:
T1: 158.10
NOTE – We are trading ETHUSD via the preferred trading setups by EliteFxAcademy
Disclaimer: Martin’s views on the Chart analysis is ment as a trading advice for education terms; Education terms include: trading consistency to everyone who is reading this blog; for every advance student and for every Elite student who is using this analysis for managing his equity by Elite strategy and custom indicator. This analysis is understandable and transparent for all Elite students. This is a free content which is based from Academy in term of transparency to support and following progress to everyone. We know that there is always possible way that market can pull you out even when you follow our analysis blog and advice for a trade. We don’t publish where you have to have your risk management – Stop Loss, because, it would not be fair to Elite members, who learned this techniques in our Elite course.
Keywords:
Elite strategy, Custom Indicator, Fundamental Analysis , Tehnical analysis, Price action, Advanced strategies, Trading Education
Good trading!
Elitefxacademy

My Trading StrategyFirst of all it is always best to have a trading strategy before entering a trade as I have made many mistakes in the past with margin trading and I found this way is the most effortless and least straining psychologically method. As I believe this is a huge growth industry, currently I use a Ledger, which are readily available and a great way to store your currency. Replacing the popular margin trading with the more stable 'growth over time method' is safer and won't have you checking your phone every two minutes, checking prices.. For reference currently I plan on holding my cryptocurrency for 20+ years, and passing the ledger onto my family or my kids, for their benefit at the time. I put the most emphasis on the psychological aspect as most trading does take a toll on your wellbeing and state of mind, while simply riding the ups and downs of the market is very satisfying. Constructive criticism / feedback encouraged! Buy and HODL!

Bitcoin Has Lost Dominance, But Only TemporarilyHello traders! Today we will talk about Bitcoin, its dominance and ALTcoins.
For the beginning we want to point out that most of cryptocurrencies, even some of ALTs nicely and strongly recovered in the start of 2020, which can be easily a signal for the bottom and a reversal into a bullish mode again, but only against the USD pairs (XXX/USD).
However, as you can see, the major Crypto BTCUSD is not so strong. It's actually rising, but in a much slower pace than some of ALTs and that's what we are going to talk about today.
It's all about dominance in the Crypto market, sometimes BTC is the leader, sometimes ALTs and this can be clearly seen in the BTC dominance chart, which is telling us where XXX/BTC cross pairs can be headed, but of course not all of them. So, we want to to show you how this look like from Elliott Wave perspective.
In the first chart above we can see that BTC is losing dominance since September of 2019, but according to the EW corrective a-b-c structure, this may come to an end soon. We are tracking a regular flat correction in wave 4, so seems like the final move up for wave 5 is still missing.
If we take a look at the examples below, ETHBTC can be also trading in a corrective a-b-c-d-e triangle pattern, so once BTC dominance returns, and once it fully completes a bearish triangle, this is when we can expect a break into new lows for the final wave 5.
It's very similar with EOSBTC, the only difference is that EOS is currently stronger than ETH, which means that EOS made a bigger recovery against the BTC, but it also looks an a-b-c corrective rally in wave 4, especially because of a triangle in wave »b«, so don't be surprised if EOSBTC faces limited upside around the 0.00048 resistance area.
All what we want to say is that yes, most of Cryptos is turning bullish, but be very careful with cross pairs against the BTC (XXX/BTC), because most of these ones may not have reached the bottom yet, especially those which are still trading near the lows like ETHBTC and EOSBTC, while the other ones that made a bigger recovery, may just face a deeper corrective decline.
Be humble and trade smart!
If you like what we do, then please like and share the idea.
Disclosure: Please be informed that information we provide is NOT a trading recommendation or investment advice. All of our work is for educational purposes only.

ETHUSD 4H EMA STRATEGYStep #1: Plot on your chart the 20 and 50 EMA
The first step is to properly set up our charts with the right moving averages. We can identify the EMA crossover at the later stage. The exponential moving average strategy uses the 20 and 50 periods EMA.
Most standard trading platforms come with default moving average indicators. It should not be a problem to locate the EMA either on your MT4 platform or Tradingview.
Step #2: Wait for the EMA crossover and for the price to trade below the 20 and 50 EMA.
The second rule of this moving average strategy is the need for the price to trade below both 20 and 50 EMA. Secondly, we need to wait for the EMA crossover, which will add weight to the bearish case.
We refer to the EMA crossover for a sell trade when the 20-EMA crosses below the 50-EMA.
By looking at the EMA crossover, we create an automatic buy and sell signals.
Since the market is prone to false breakouts, we need more evidence than a simple EMA crossover. At this stage, we don’t know if the bearish sentiment is strong enough to push the price further after we sell to make a profit.
To avoid the false breakout, we added a new confluence to support our view. This brings us to the next step of the strategy.
Step #3: Because the market goes down much faster, we sell on the 1st retest of the zone between 20 and 50. After the EMA crossover happened.
On a BUY trade wait for the zone between 20 and 50 EMA to be tested at least twice, then look for selling opportunities.
The conviction behind this moving average strategy relies on multiple factors. After the EMA crossover happened, we need to exercise more patience. We will wait for two successive and successful retests of the zone between the 20 and 50 EMA.
The two successful retests of the zone between 20 and 50 EMA give the market enough time to develop a trend.
Never forget that no price is too high to buy in trading. And no price is too low to sell.
Note* When we refer to the “zone between 20 and 50EMA,” we actually don’t mean that the price needs to trade in the space between the two moving averages.
We just wanted to cover the whole price spectrum between the two EMAs. This is because the price will only briefly touch the shorter moving average (20-EMA). But this is still a successful retest.
Now, we still need to define where exactly we are going to sell. This brings us to the next step of the strategy.
Step #4: Sell at the market when we retest the zone between 20 and 50 EMA for the third time.
If the price successfully retests the zone between 20 and 50 EMA for the third time, we go ahead and sell at the market price. We now have enough evidence that the bearish momentum is strong to continue pushing this market lower.
Step #5: Find your own SL & TP or
Place the protective Stop Loss 20 pips above the 50 EMA
After the EMA crossover happened, and after we had two successive retests, we know the trend is down. As long as we trade below both exponential moving averages the trend remains intact.
In this regard, we place our protective stop loss 20 pips above the 50 EMA. We added a buffer of 20 pips because we understand we’re not living in a perfect world. The market is prone to do false breakouts.
Step #6: Take Profit once we break and close above the 50-EMA
In this particular case, we don't use the same exit technique as our entry technique, which was based on the EMA crossover.
If we waited for the EMA crossover to happen on the other side, we would have given back some of the potential profits. We need to consider the fact that the exponential moving averages are a lagging indicator.
The exponential moving average formula used to plot our EMAs allow us to still take profits right at the time the market is about to reverse.
Note** The above was an example of a SELL trade. Use the same rules – but in reverse – for a BUY trade. However, because the market goes down much faster, we sell on the 1st retest of the zone between 20 and 50. After the EMA crossover happened.
Summary
The exponential moving average strategy is a classic example of how to construct a simple EMA crossover system. With this exponential moving average system, we’re not trying to predict the market. We're trying to react to the current market condition, which is a much better way to trade.
The advantage of our trading strategy stands in the exponential moving average formula. It plots a much smoother EMA that gives better entries and exits.

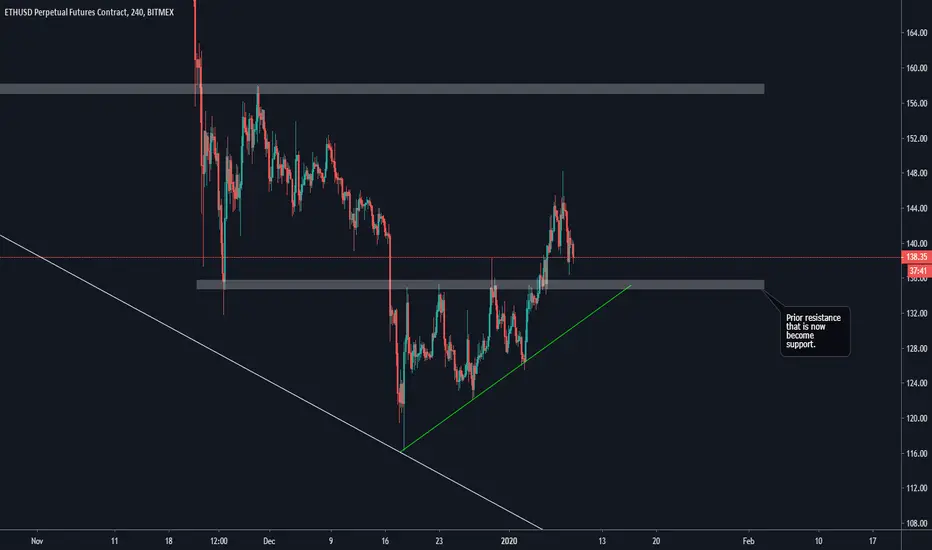
Ethereum : Short term perspectiveHello fellas, here is the ethereum update based on short term perspective.
First of all, I do the analysis on 4 hours trime frame based on bitmex market price. From the chart attached, we can see that the price was forming an ascending type of triangle which has broken out to the upside. and because of this break out, we have seen 10% spike to the upside which is awesome in my opinion.
Now, let us see the action of break out of the prior resistance around $135 region, we know that after this break out, we haven't seen any retest toward the previous resistance that is now become support as well. That's why I will classify the previous up trend as the first phase of break out strategy. And I will expect a 2nd phase of break out strategy to retest the $135 region.
And if this support can hold the price, we might see push higher to the $150 region as the next potential resistance in higher degree. But, if the area can't hold the price from further drop down, we might see a lower low pattern of melting down to the $110 region.