How To Find The Best Trend Line Break and RetestWait For Price To Break Trend Line. Wait For Price To Close Below Trend Line.
Watch For A Price Action Signal To Form On The Retest. Watch For A Rejection Candlestick or a Pin Bar. In the example below, the candlestick wick protrudes through EMA 10, EMA 20, Trend Line, and 50% Fibonacci Retracement Level.
Enter at the close price of rejection candlestick. Close Price is 188.13 in this example.
Note: The best trend lines has 4 or more touches.
Fibonacci Retracement

How To Trade Support Resistance Levels with Price Action Signal Wait for a Price Action Signal to form at the following support resistance levels.
EMA 10 Level
EMA 20 Level
Fibonacci Level
Horizontal Level
Set Target at the next support resistance level. Set Stop Loss Below EMA 20 Price and Low Price of Price Action Signal Candlestick. Enter at close price of Price Action Candlestick.
Engulfing Candlestick at Support Resistance Levels

Fib Retracement and Fib Extension Difference and UsesI am trying to learn and share what I have learned. Here is a tutorial on how to use Fib Retracement Tool and Fib Extension Tool.

How to use Fibonacci to determine a trend change or a correctionFibonacci is a great tool that I have learned to use in different trading situations. One of the great features of the Fibonacci ratios is the ability to reveal market information.
In this video, I demonstrated how you can use the Fibonacci to confirm a trend change or a retracement.
Enjoy!

How To Trade Quality Pin BarsAfter the Pin Bar Formed At The EMA 10 EMA 20, Do The Following Actions
Draw Your Fibonacci Retracement Levels
Draw Horizontal Support Levels
Enter At Pin Bar Close Price
Exit At The Previous Swing Low Level
The attributes that made this a quality Pin Bar:
Pin Bar Close Price is in the Fibonacci Retracement 50% and 38.2% Range Area
Pin Bar Close Price is in the EMA 10 EMA 20 Range Area
Pin Bar at Lower High
Downtrend
Technical Chart Of How To Trade The Pin Bar. Before and After Charts. Click on Charts.

A Comprehensive Guide to Fibonacci RetracementsHello traders, in this post, we will be going over one of the most commonly used tools in the equities (stocks), forex (fx), and cryptocurrency markets - the "Fibonacci Retracement". For a better viewing experience, please view this on your desktop/PC, as the mobile and tablet versions of the charts are harder to read.
Although I have briefly touched on how to use the Fibonacci Retracement tool in my previous Elliott Waves series, we are now going to go over it in depth, and talk about how this tool can help you find entries and exits within an existing trend, which also helps identify whether you are in a bullish or bearish trend.
The Fibonacci Retracement tool, although widely used by many traders, is almost always not correctly used by new traders. Most traders will often connect the wrong points, indicating the wrong Fibonacci retracement levels. Here, I will be explaining the proper way to use the Fibonacci Retracement tool in a very simple translated friendly guide in one guide.
-------
What Is the Fibonacci Retracement?
Fibonacci Retracements (Fib(s) for short), are a set of 'ratios', defined by mathematically important Fibonacci sequence. This allows traders to identify key levels of support and resistances for price action. Unlike other indicators, Fibonacci retracements are FIXED, making them very easy to interpret. When combined with additional indicators, Fibs can be used to identify potential entry and exit points with high probability to trade on trending movements. Fibonacci retracements are used to indicate levels of support and resistance for a stock’s price. Although they are similar to moving averages in this respect, Fibonacci retracements are set by the extent of the previous bullish or bearish run and do not change each day in the current trend as moving averages do. Therefore, it can be significantly easier to identify and anticipate support and resistance levels from Fibonacci sequences.
How Is the Fibonacci Retracement Calculated? (You don't need to calculate it yourself - It's already done for you!)
Fibonacci retracements are based on what is known as the 'Fibonacci sequence', where each number in the sequence can be added to the previous number to produce the following number within the sequence. Now, you might be confused here, but don't! - I am just explaining the concept on how it's calculated. You do not need to personally calculate the actual sequence of the Fibonacci Retracement, as everything is already pre-determined and calculated within the tool itself on TradingView. To put it simply, dividing any number in the sequence by the following number yields 1.6180 – known as the "Golden Ratio" – while dividing any number by its predecessor yields 0.6180. Dividing any number in the sequence by two positions in advance yields 0.3820, while dividing any number by a number three positions in advance yields 0.2360. These ratios emanating from the Fibonacci sequence are found throughout nature, mathematics, and architecture - such as flowers, buildings, and so forth. Yes, if you search for Fibonacci sequence examples, you can find these within daily uses, not only in trading.
Now, let's get into the meat and potatoes. Retracement levels for a stock/cryptocurrency are drawn based on the prior bearish or bullish movement. Don't forget this - you need to know whether you are in a bullish or bearish trend. Is the stock or coin going up? or down? To plot the retracements, draw a trendline from the low to the high (also known as the swing low to the swing high) within a continuous price movement trend – Fibonacci retracement lines should be placed at 61.80%, 38.20%, and 23.60% of the height of the line. Again, these numbers are already calculated for you within the tool itself. In a bullish trend, the retracement lines start from the top of the movement (i.e. the 23.60% line is closest to the top of the movement), whereas in a bearish movement the retracements are calculated from the bottom of the movement (i.e. the 23.60% line is closest to the bottom of the movement).
How to Trade Using the Fibonacci Retracement
Once you have drawn a set of Fibonacci retracements on a chart of your liking, it is possible to anticipate potential reversal points where support or resistance will be encountered. If the retracements are based on a bullish trend, the retracements should indicate potential support levels where a downtrend will reverse bullishly. So to put it simply, the pre-determined Fibonacci levels, should in theory and practicality, act as resistance. If not, there is almost 100% certainty, even if the support/resistance is not held, there will always be some form of price reaction at each Fibonacci level just based on the Market Psychology movements. If the retracements are based on a bearish movement, the retracements should indicate potential resistance levels where a rebound will be reversed bearishly, which is the vice-versa situation for the bullish movement trend.
The most common reversals based on Fibonacci retracements occur at the 38.20%, 50%, and 61.80% levels (50% comes not from the Fibonacci sequence, but from the theory that on average stocks retrace half of their prior movements). Although retracements do occur at the 23.60% line, these are less frequent and require close attention since they occur relatively quickly after the start of a reversal. In general, retracement lines can be considered stronger support and resistance levels when they coincide with the overall trend, meaning, that if you know that you are in an established bullish or bearish trend, you will most certainly get some form of reaction at the most common reversal levels within the Fibonacci level, which is shown in the image below.
Whenever applying Fibonacci retracements, keep in mind that retracement lines represent only potential support and resistance levels, they are NOT 100% set in stone – they represent price levels at which to be alert, rather than hard buy and sell signals; however, they have HIGH PROBABILITY. It is important to use additional indicators, in particular MACD, to identify when support or resistance is actually being encountered and a reversal is likely. The more that additional indicators are pointing towards a reversal, the more likely one is to occur. Also note that failed reversals, especially at the 38.20% and 50% retracement levels, are common.

Fibonacci Masterclass - Fibonacci Retracement and ExtensionHi guys, I have finally completed the thread on Fibonacci (Though it took longer than usual). I have tried with the best of my little knowledge to create this thread. This has everything you need to know about Fibonacci retracement and Fibonacci extension. Also, if the thread is free that doesn't mean I have compromised with the quality. All you have to do is just read this thread again and again until you get a good grasp of it. everything.
Table of Contents:
1. What Are Fibonacci Retracement Levels?
2. Significance of Fibonacci Retracement levels
3. Finding Fibonacci Retracement Levels
4. How to use the Fibonacci retracement levels?
5. What are Fibonacci Extensions?
6. Significance of Fibonacci Extension levels
7. Finding Fibonacci Extension levels
8. Difference Between Fibonacci Retracements and Fibonacci Extensions
What are Fibonacci Retracement levels?
• Fibonacci retracement levels are horizontal lines that indicate areas where the price could stall or reverse.
• These horizontal levels can act as a potential support or resistance levels
• They are based on Fibonacci numbers. Each level is associated with a percentage which means how much of a prior move the price has retraced.
• The Fibonacci retracement levels are 23.6%, 38.2%, 61.8%, and 78.6%.
• While 50% is not a pure Fibonacci ratio, but it is still used as a support and resistance indicator. This is because people worldwide regard it as an important level.
• The price won’t always bounce from these levels. They should be looked at as areas of interest. Hence, please use the Fibonacci retracement as a confirmation tool.
Significance of Fibonacci Retracement levels
Fibonacci retracements can be used to:
• Place entry orders
• Determine stop-loss levels
• Set price targets
For example , A stock may be in an uptrend. After a move up, it retraces to the 61.8% level. Then, it starts to go up again. Since the bounce occurred at a Fibonacci level during an uptrend, you can enter long positions with a stop loss just below the Fibonacci level or at the candlestick low.
Finding Fibonacci Retracement levels
In order to find the Fibonacci retracement levels, you have to find the recent significant Swing High and Swing Low.
• For uptrends, select the Swing Low and then the Swing High.
• For downtrends, select the Swing High and then the Swing Low.
Example: Fibonacci retracement in an uptrend
Example: Fibonacci retracement in a downtrend
How to use the Fibonacci retracement levels?
If the price is approaching a Fibonacci level, you should look out for the following things at the point of interaction or in the vicinity of the level.
• Some reversal candlestick pattern
• Volume is above average.
• Moving average
• RSI divergence
• Previous S/R level or pivot level
The trade will be a high probability trade if some of these factors create a confluence zone.
What are Fibonacci Extensions?
• Fibonacci extension is a tool that can be used to find price targets or estimate how far a price may move after the retracement/pullback is over.
• Extension levels are also possible areas of interest where the price may stall or reverse.
• It can be used to find projected areas of support or resistance when the price is moving into an area where other methods of finding support or resistance are not applicable or evident.
• If in a stock, a new high/low occurs, the trader can use the Fibonacci extension levels to get an idea of where the price can go.
• Fibonacci extension levels can be calculated to give the trader ideas on profit target placement.
Significance of Fibonacci Extension levels:
• Fibonacci extensions can be used for any timeframe and in any market- stocks, commodities, cryptocurrencies, etc.
• Fibonacci extension levels indicate a price area that will be significant for the stock after the pullback/correction is over.
• Extension levels can be drawn on different price waves over time. When levels from these different waves converge at one price, that could be a very important area.
Finding Fibonacci Extension levels
In order to find the Fibonacci extension levels, you have to find the recent significant Swing High and Swing Low.
• For uptrends, click on the Swing Low and then on the Swing High. Then go to the Fibonacci setting and click on reverse. Or if your software directly has the extension tool then it’s even easier.
• For downtrends, click on the Swing High and then on the Swing Low. Then go to the Fibonacci setting and click on reverse.
Example: Fibonacci extension in an uptrend
Example: Fibonacci extension in a downtrend
Difference Between Fibonacci Retracements and Fibonacci Extensions
• Fibonacci retracements provide levels for a pullback whereas Fibonacci extensions provide levels to move in the direction of the existing trend.
• For instance, a stock goes from 50 to 100, and then back to 75. The move from 100 to 75 is a retracement. If the price starts rallying again and goes to 150, that is an extension because the price moved past the previous swing high which is 100 in this case.
This is everything you need to know about Fibonacci retracement and extension levels. This thread is more than enough to make you profitable. Keep reading and revising until you learn everything written in this post. I hope you find this post useful. Also, if anyone is interested in getting a consolidated PDF version of this thread, then you can message me, I'll provide it.
Disclaimer: This is NOT investment advice. This post is meant for learning purposes only. Invest your capital at your own risk.
Happy learning. Cheers!
@johntradingwick

Retracements and Expectations👨🏫 A students ask me to clarify a strategy I use when momentum trading using retracements in something I call the "Springboard Effect"
The theory is, the deeper the retracement after the initial impulse move the less chance of an extension or "strength" of the continuation.
I like to use the analogy of a Spring Board, (or diving board) and the stiffness of the board or the amount of "spring" it has 👇
🤔 Imagine we we have 4 different boards, all with a different amount of springs and we are going to drop the same amount of weight ⚖️ from the same height onto each board.
When we drop the weight onto the board that has lots of springs, it wont retract far before launching the weight high 🚀
If we drop the weight on a board that has a less springs it will retract further, but have less strength to launch the weight very high 🛫
If we drop the weight onto a board that has barely any springs then it will retract a lot and then struggle to even launch the weight higher than the height it was dropped from 😤
In this analogy.....
The height we dropped the weight from, is the top of the impulse move 📈
The different boards are the different fib retracement levels 🧮
The springs are the buyers at those levels 💵
How far it throws the weight is the strength or price action of the extension 💪
👉 A Bounce on the 382 tells us that there are plenty of buyers wanting to enter this market asap, this is a good sign that the extension could be strong. I like to target the 1.618 extension and or match it up to a level of resistance close by
👉 A bounce on the 50 tells me there is still a lot of bullish momentum but buyers where happy to buy it much lower, I'll still consider this bullish and target the 1.272 extension and match it up with some resistance close by or front run the level if I have to.
👉 A bounce on the 618 I dont really consider to be a strong move, I feel we will get a good bounce and may extend further, but I play close attention to the previous high incase we double top. I will look for things like candle stick reactions and use the CCI to spot divergence if momentum is lacking.
👉 A bounce on the 782 I consider a failure of the trend, I will expect buyers to still step in, but it will be a weak bounce and only really look to target other fib levels inside the retracement as potential resistance and this trade becomes more of a short term scalp.
I hope this makes sense and adds some value to your trading, peace ✌️


CONFLUENCE TRADING | YOUR KEY TO ACCURATE ENTRIES 🥇
If you are struggling with the identification of accurate trading entries,
you definitely should try confluence zones .
Note: there are hundreds of variations of confluence elements.
In this example, we will discuss trend lines and fibonnachi.
❗️To identify a confluence zone, the price must follow a trend line
(it should match higher lows if the market is bullish;
it should match lower highs if the market is bearish).
Once the trend line is confirmed by at least two touches and consequent reactions ,
you can look for a confluence zone.
1️⃣Project a trend line and identify the next POTENTIAL touchpoint of the market with a trend line.
2️⃣Take the last impulse in the direction of the trend.
Draw a fib retracement based on it
(swing low to swing high in case if the market is bullish,
swing high to swing low in case if the market is bearish).
3️⃣Take the previous impulse (it must be in the same direction as the initial one).
Draw a fib retracement based on it.
4️⃣Look for a match of retracement levels of the last two impulses and a projected trend line.
In case if two retracement fib.levels & trend line match, you found a confluence point.
5️⃣ Apply it as a safe entry point.
You will get a perfect trend following opportunity.
❤️ Please, support this idea with a like and comment! ❤️
⬇️ Subscribe to my social networks! ⬇️

EW FIBONACCI Ratios, FIB Retracement and Extension application !In this post, I'm going to focus on Fib Retracement and Fib Extension Ratios by Elliott Wave, and show you how to best use these tools.
Fibonacci ratios are mathematical ratios derived from the Fibonacci sequence.The Fibonacci sequence is the work of Leonardo Fibonacci.
Fibonacci sequence is used in many applications, movies and photography, space studies, stock market actions, and many other fields.
Fibonacci is a proven approach for measure price movement relationships. For Elliott heads, it means Fibonacci numbers are tools to help guide us in our interpretation where we think price movements will go.
The most common Fibonacci ratios used in the stock markets are:
1 - 1,272 - 1,618 - 2,618 -3,618- 4.23 (extension)
0.236 - 0.382 - 0.5 - 0.618 - 0.786 (retracement)
Let's start with Elliott Impulsive Wave rules !
Wave 1: the beginning of each wave and retracet with
Wave 2: may never retrace deeper than the beginning of wave 1
Wave 3: often the longest, but never the shortest
Wave 4: may never retrace below the top of wave 1
Wave 5: x
Fibonacci ratios :
Wave 2
The most common retracements we look for in a Wave 2 pullback are either a 0.5 or 0.618 retracement of Wave 1
We expect only 12% of Wave 2 to hold 0,382 retracements of Wave 1
We anticipate 73% of Wave 2 retracements between 0,5 to 0,618
We anticipate 15% of Wave 2 to retrace below the 62%
Wave 3
Wave 3 is related to Wave 1
Fibonacci relationships:
Wave 3 is either
1,618 length of Wave 1
or 2,618 the length of Wave 1
or 4,236 the length of Wave 1
The most common multiples of Wave 1 to Wave 3 are the 1,618 and 2,618
If Wave 3 is extending, we typically look for 4,236 or higher
Only approximately 2% will a Wave 3 be less than Wave 1
We anticipate 15% of Wave 3 trade between 1 and 1,618 of Wave 1
We can anticipate 45% of the time Wave 3 will push to between 1,618 and 1,75
We can anticipate 8% of Wave 3 will extend beyond 2,618 or higher
Wave 4
Wave 4 is related to Wave 3
0,236 of Wave 3 or
0,382 of Wave 3 or
0,50 of Wave 3 or
0,618 of Wave 3
We can anticipate only 15% of the time Wave 4 to retrace between 0,236 to 0,382
We can anticipate 60% of the time Wave 4 to retrace between 0,382 and 0,5
We can anticipate 15% of the time Wave 4 to retrace between 0,5 and 0,618
We can anticipate 10% of the time Wave 4 retrace 0,618 or greater
Wave 5
Wave 5 has two relationships. Wave 5 has a direct correlation to the Fibonacci relationship of Wave 3
1. If Wave 3 is greater than 1.62, or extended
Wave 5 is a 1 to 1
or 1.618 of Wave 1
or 2,618 of Wave 1
I don't know any statistics, but in my experience a 1.618 or 1 to 1 is the most likely
2. If Wave 3 is less than 1,618. Wave 5 will often overextend.The ratio of Wave 5 will be based on the length from the beginning of Wave 1 to the top of Wave 3
Extended Wave 5 is either 0,618 from the beginning of Wave 1 to top of Wave 3
or 1,618
Unfortunately, my english is not so good and I work with google translate, but if you have any questions I will be happy to answer them .
➡️If you like my posts smash the like👍👍 button, comment or follow me. It helps me to publish more free education, also on request ⬅️
Fib retracement and Extension application follow 📚

My new fibonacci levels toolHi crypto traders,
After many years of using Fibonacci retracement, my predictions started to be less relevant since Trading View started allowing to change the fib levels from regular scale to LOG scale. Since then I got confused especially with crypto that many coins 10x easily. So i decided to get my own fib levels tool (feel free to back test it on your own).
Basically, I took the Fibonacci sequence numbers of 21,34,55,89 as my fib levels to watch for retracement. For the number 76, I added fib number, 21, to 55 . Then I ‘ve noticed that between 21 and 34, the difference is the UNLUCKY number 13. Number 13, it is also the difference between 76 and 89. This gave me a confirmation that 76 is an important level to watch even if it is not a fib level.
Hopefully this is helpful for some people out there. From now on, I will be using those levels for my chart analysis.
Stay safe!

UPDATE Retracement Levels Script: Finding Support and ResistanceI have updated my Retracements Level script to alert traders to long term Support and Resistance levels based on 50% Fibonacci levels. I think that this is a simple and highly valuable tool that every trader should have in their toolbox to identify key levels that price may respect.
In this video I go over the many uses:
-Long term levels for Entering and Exiting positions
-Multiple Timeframe Analysis
-Catching Catalyst events like Earnings
-Projecting Support and Resistance far into the future

Fibonacci RetracementFibonacci Retracement is the only instrument that,
sometimes, I use in my graphs. To draw it correctly,
you must draw it from the lower point to the higher
one of the movement that you are analyzing. Once
the price reaches the 0.5 zone, you can place your
entry. Many like also the 0.61 level, you can add it
from the settings.

Quick Tutorial on Trend based Fib TimeThis is a quick tutorial on the Trend based Fib Time.
Please like the video if you thought it was helpful, and follow us for more quick tutorials and ideas!
Let us know down in the comments what tool do you want us to do a tutorial on.

Educational: AB=CD pattern w/ BTC exampleOne fairly easy and useful pattern for determining reversals is the AB=CD pattern.
The pattern simply looks for two rising or falling legs up or down respectively. Then one simply measures the retracement level from point B followed by the projection from C (luckily tradingview has a tool to assist with this). If these values equal a 0.618 or 0.786 retracement followed by a 1.272 or 1.618 projection respectively, the pattern is likely to indicate a reversal of the current trend. For example, above we can clearly see the pattern almost perfectly matched the required levels of 0.618 and 1.272.
However, no pattern is guaranteed, so it is always recommended to seek out confirmation. As we can see in the above example, there is bearish reversal divergence that can be seen on both RSI and MACD (dotted green lines), whereby price is rising while oscillators are falling, indicating an even greater likelihood for a reversal.
Upon confirmation of a reversal, one can then target Fibonacci retracement levels as key points of interest as can be seen above.
A nice part about this pattern is how simple it is to spot and draw out particularly with tools available on tradingview.
Hopefully you are able to use this pattern as another useful tool in your arsenal!

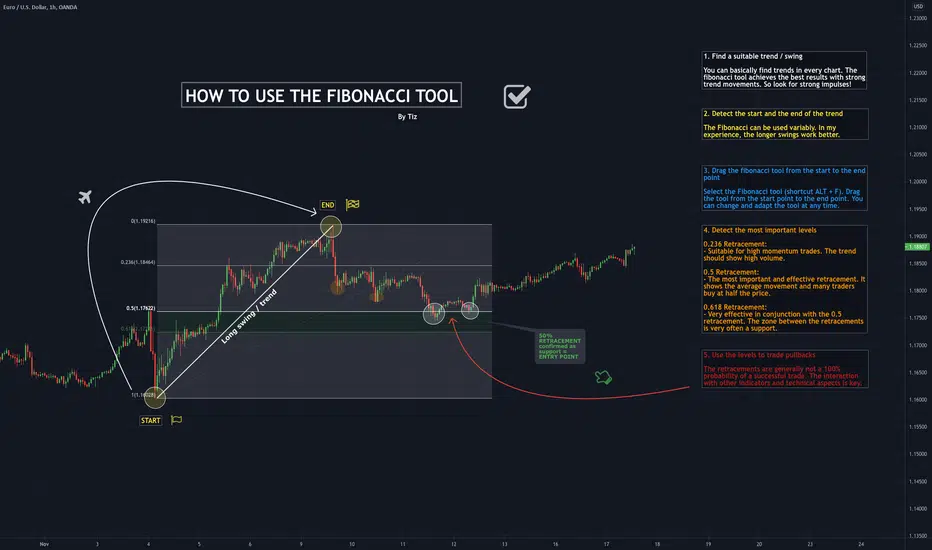
How to use FIBONACCI TOOL1. Find a suitable trend / swing
You can basically find trends in every chart. The fibonacci tool achieves the best results with strong trend movements. So look for strong impulses!
2. Detect the start and the end of the trend
The Fibonacci can be used variably. In my experience, the longer swings work better.
3. Drag the fibonacci tool from the start to the end point
Select the Fibonacci tool (shortcut ALT + F). Drag the tool from the start point to the end point. You can change and adapt the tool at any time.
4. Detect the most important levels
0.236 Retracement:
- Suitable for high momentum trades. The trend should show high volume.
0.5 Retracement:
- The most important and effective retracement. It shows the average movement and many traders buy at half the price.
0.618 Retracement:
- Very effective in conjunction with the 0.5 retracement. The zone between the retracements is very often a support.
5. Use the levels to trade pullbacks
The retracements are generally not a 100% probability of a successful trade. The interaction with other indicators and technical aspects is key.
TOP 5 Tools To TradeHi traders!
Working process of any trader is usually related with usage of different tolls. These tools are invnted to make traders’ life easier. For instance, you shouldn’t just build lines of support and resistance by yourselves, just choose 3 main points and use Fib ExtensionMany of you asked us, what tools we usually use in our daily stuff. Well, we use many different indicators, oscillators and other tools like Fiba, Pivots and so one. Today, we’ll give TOP-5 tools, that’ll make your trading activity easier and more efficient.
Fibonacci retracement
Fibonacci retracement levels are horizontal lines that indicate where support and resistance are likely to occur. They are based on Fibonacci numbers. Each level is associated with a percentage. The percentage is how much of a prior move the price has retraced. The Fibonacci retracement levels are 23.6%, 38.2%, 61.8%, and 78.6%. While not officially a Fibonacci ratio, 50% is also used.
The indicator is useful because it can be drawn between any two significant price points, such as a high and a low. The indicator will then create the levels between those two points.
Suppose the price of a stock rises $10 and then drops $2.36. In that case, it has retraced 23.6%, which is a Fibonacci number. Fibonacci numbers are found throughout nature. Therefore, many traders believe that these numbers also have relevance in financial markets.
How to use?
Put the first point to lower low, the second to the higher high or vice versa.
Fibonacci extension
Fibonacci extensions are a tool that traders can use to establish profit targets or estimate how far a price may travel after a retracement/pullback is finished. Extension levels are also possible areas where the price may reverse. Fibonacci extensions are a way to establish price targets or find projected areas of support or resistance when the price is moving into an area where other methods of finding support or resistance are not applicable or evident.
To study it accurately, read our Fiba Extension From Scratch (link in the description).
Pivot Point
A pivot point is a technical analysis indicator, used to determine the overall trend of the market over different time frames. The pivot point itself is simply the average of the intraday high and low, and the closing price from the previous trading day. In fact, price above the pivot point is thought to indicate ongoing bullish trend, while price below the pivot point indicates bearish one.
The pivot point is the basis for the indicator, but it also includes other support and resistance levels that are projected based on the pivot point calculation. All these levels help traders see where the price could experience support or resistance. Similarly, if the price moves through these levels it lets the trader know the price is trending in that direction.
Commonly, traders use Pivot Points as support and resistance levels as well as stop-loss levels. In the combine with oscillators (MFI, OBV, etc.) and Fiba levels we invent efficient strategies.
Ichimoku
One of the most informative indicator in world of trading. It can give you both support/resistance levels and sell buy signals. Out crew uses it every day. However, many traders consider it rather difficult to interpret. If you want to know more about it and use it as efficient as it’s possible, check out our articles (link in description)
Pitchfork
Andrews' Pitchfork can be used by traders to establish profitable opportunities and swing possibilities. On a long-term basis, Pitchfork can be used to identify and gauge overall cycles that impact underlying spot activity.
In general, traders will purchase the asset when the price falls near the support of either the center trendline or the lowest trendline. Conversely, they'll sell the asset when it approaches the resistance of either the center line or the highest trendline. Even though the center line can be used to identify areas where a security may find support or resistance, it is generally not as strong as the two outside lines. In practice, the levels identified by this indicator are very useful for identifying strategic positions for stop-loss orders.
To apply the pitchfork, you should choose the pivot of “trend start” (A on the chart). Than, chose the significant maximum(B on the chart) and significant minimum.
DISCLAMER: Information is provided only for educational purposes. Do your own study before taking any actions or decisions.

FIB your way to SUCCESS! In his historic 13th century novel Liber Abaci (Book of the Abacus), Leonardo Fibonacci brought a special sequence of numbers known as the Fibonacci series to Western civilization. Before we look into how Fibonacci numbers and ratios are used in the financial markets to predict future support and resistance levels, let's have a look at where they came from and how they were created.
A simple mathematical expression that describes a Fibonacci series is given as follows:
F(n+1)=Fn+ F(n-1)
where Fn represents the current number, F(n-1)the previous number, and F(n+1) the next number in the Fibonacci series. Any integer in the Fibonacci series is the sum of its two previous whole numbers, regardless of how it is represented mathematically.
Starting with F(n-1) = 0 as the previous number and Fn = 1 as the current number in the sequence, we can get F(n+1), the next number in the Fibonacci series, by repeating or iterating the process for each new Fn:
0, 1, 1, 2, 3, 5, 8, 13, 21, 34, 55, 89, 144, 233, 377, ...
The ratio of the current Fibonacci number to its immediate previous number, that is, the ratio (F(n+1)/Fn) or (Fn/F(n-1)), is a special and somewhat mysterious characteristic of the Fibonacci sequence. When we move farther out into the Fibonacci sequence, this ratio reaches 1.618 (to three decimal places). In truth, it turns out that it doesn't matter which two numbers were chosen to start the series in the first place. It will still hit 1.618 as we proceed along with the list! This unique ratio is referred to as the Golden Ratio, or "Phi" .
We already know that Phi = 1.618 (to three decimal places). Here are some other important ratios related to Phi:
a. (1/Phi) = 0.382
b. Phi x Phi = 2.618
c. (2/Phi)-1 =0.236
d. √ (1/Phi) = 0.786
e. √ Phi = 1.272
The items in this list of Phi‐related ratios are regarded as significant ratios in technical analysis and are used widely by technical traders and analysts.
Fibonacci Retracements, Extensions, and Projections
Fibonacci numbers and ratios are often used to time future market reversals, or as time forecasts, as we can see in the following pages. Before going any further, it's a good idea to define the terms retracement, extension and projections in broad terms.
Price Retracements
A market drop or reversal from a significant high, or a rebound from a significant trough, is referred to as a retracement . The amount of retracement is normally expressed as a percentage of the observed price range, and is calculated by comparing the peak to a previous significant trough or a trough to a previous significant peak. In other words, we have both downside and upside retracements. Popular Fibonacci percentage retracements include:
a. 23.6 percent
b. 38.2 percent
c. 61.8 percent
d. 78.6 percent
Price Extensions
A downside extension is any downside retracement that is greater than 100 percent, that is, the downside retracement extends below the previous significant trough, that is, beyond the observed price range. In similar fashion, an upside extension is any upside retracement that is greater than 100 percent, that is, the upside retracement extends above the previous significant peak that is beyond the observed price range. Popular Fibonacci price percentage extension levels include:
a. 127.2 percent
b. 161.8 percent
c. 261.8 percent
d. 361.8 percent
e. 423.6 percent
f. 461.8 percent
Price Projection
An upside price projection is a projection of an observed price range from a higher significant trough. A 100 percent price projection is simply a one to one (1:1) projection of the observed price range from some new higher significant trough. Similarly, Fibonacci downside price projections use the phi‐related percentages for forecasting potential support in a downtrend.
The main Fibonacci percentages associated with projections are:
a. 61.8 percent
b. 161.8 percent
c. 261.8 percent
d. 361.8 percent
e. 423.6 percent
f. 461.8 percent
Trade with care.
If you like our content, please feel free to support our page with a like, comment & subscribe for future educational ideas and trading setups.

fibonacci extensions / retracements - how to and where to applyFibonacci tools are in general a method of technical analysis for determining probable support and resistance levels calculated using ratios (23.6%, 38.2%, 61.8%, and 78.6%) that are derived from Fibonacci sequence (0, 1, 1, 2, 3, 5, 8, 13, 21, …). Fibonacci levels are presented in variety of forums, such as horizontal lines, vertical lines, trend channels , fans , arcs, circles, even a spiral. Fibonacci levels also arise in other ways within technical analysis, for example, one of the best known and widely used Elliott Wave theory
In this article we will have a closer look to Fibonacci Extensions and Fibonacci Retracements
Fibonacci Retracement and Fibonacci Extension levels are in the form of horizontal lines and are calculated in almost similar manner with slight difference. Even tough they look like similar to each other they are quite different and serve for different purpose.
👉 Fibonacci retracement levels indicate how deep a retracement could be, that is, aims to measure the pullbacks within a trend
👉 Fibonacci extension levels indicate how far the next price wave could move following a pullback, that is, aims to measure the impulse waves in the direction of the trend
How to apply Fibonacci Retracement and Fibonacci Extension
These levels should not be relied on exclusively,Reversals can be confirmed with candlesticks, momentum indicators, volume or chart patterns.
Here are the links of educational posts and indicator versions of the Fibonacci Tools that I made, you are kindly invited to check
Auto Fib Channels, besides Auto Fib Channels this study include Auto Fib Retracement, Auto Fib Extension and Auto ZigZag indicator
Auto Pitchfork, is advised due to its similarities with Auto Fib Channels and also it includes Auto Fib Retracement and Auto ZigZag indicator
Auto Fib Speed and Resistance Fans, is an important tool to identify probable support and resistance and especially a powerful tool to identify reversals and retracement levels. The study presents an alternative approach of drawing the fans which enables a visualization quite similar to Gann Box. Auto Fib Retracement and Auto ZigZag indicator is also available
Related educational posts that presents a quick guide of the drawing tools as well as introductions for their automatic indicator versions
how to apply pitchfork and auto pitchfork study :
how to apply fibonacci fans and auto FibFans study :
how to apply fib channels and auto fib channels study :

how to apply fib channels and auto fib channels studyThe Fibonacci Channel is a technical analysis tool that is used to estimate support and resistance levels based on the Fibonacci numbers. It is a variation of the Fibonacci retracement tool, except with the channel the lines run diagonally rather than horizontally.
The tool is used to aid in identifying where support and resistance may develop in the future. If the uptrend is expected to continue, the 100%, 161.8%, and other higher levels are potential price targets. The same concept applies to downtrends if a downtrend is expected to continue
In an uptrend, the zero-line is like a normal trendline, helping to assess the overall trend direction. If the price falls below it, it may need to be adjusted based on more recent price action, or it could signal that the uptrend is over and that the price is breaking lower. Similarly in a downtrend, the zero-line also acts like a trendline. When the price is below it, it helps confirm the downtrend. If the price moves above it, the indicator may need to be redrawn or the price is moving higher out of its downtrend
Difference Between Fibonacci Channels and Andrew's Pitchfork
Both these indicators attempt to predict future support and resistance levels based on price levels from the past. Fibonacci channels attempt to do this with percentages of a selected price move. Those percentages are then projected out into the future. Andrew's Pitchfork is simpler in some ways as the angled lines are based on three price levels selected the trader and then extended out into the future.
Step By Step Applying Fibonacci Channels
Auto Fib Channels ʙʏ DGT ☼☾
LINK to Auto Fib Channels ʙʏ DGT ☼☾

how to apply fibonacci fans and auto FibFans studyFibonacci Speed and Resistance Fan is an analytical drawing tool used to indicate the support and resistance levels of an existing trend and the price level at which possible changes in the trend may occur.
A Fibonacci Speed Resistance Fan consists of a trend line drawn between two extreme points - a trough and opposing peak or a peak and opposing trough - on which a set of sequential speed resistance lines are drawn above (which represents time) and below (which represents price). These lines are drawn based on time/price percentages of the distance between the beginning and the end of the trend line.
Speed resistance lines not only help to measure trend corrections but also measure the speed of a trend (the rate at which a trendline ascends or descends)
Traders can use the lines of the Fibonacci Speed and Resistance Fan to predict key points of resistance or support, at which they might expect price trends to reverse. Once a trader identifies patterns within a chart, they can use those patterns to predict future price movements and future levels of support and resistance. Traders use the predictions to time their trades
Nobody appears to know whether Fibonacci tools work because markets exhibit some form of natural pattern or because many investors use Fibonacci ratios to predict price movements, making them a self-fulfilling prophecy. In any event, key support and resistance levels tend to occur frequently at the 61.8-percent level (0.618) on both uptrends and downtrends
Fibonacci Speed and Resistance Fans vs. Gann Fans
Gann fans are another form of technical analysis based on the idea that the market is geometric and cyclical in nature. A Gann fan consists of a series of trend lines called Gann angles.
Instead of relying on Fibonacci's golden ratio of 1.618, Gann believed the 45-degree angle (geometric angles of time versus price) to be most important. The Gann fan subsequently draws additional angles at 82.5, 75, 71.25, 63.75, 26.25, 18.75, 15, and 7.5 degrees. These angles are superimposed over a price chart to show potential support and resistance levels
Step By Step Applying Fibonacci Speed and Resistance Fan
Some interpretation examples:
Example of how to identify if the move is Reversal or Retracement
All the above are now available with the Auto Fibonacci Speed and Resistance Fans Study ʙʏ DGT ☼☾,
LINK to Auto Fibonacci Speed and Resistance Fans Study

Fibonacci Retracement and Extensions Imagine a Box that's being fired everytime market makes a swing.
Multiples of boxes of bear/bull. That is what fib is 0 to 1.
Many people say "So its going to go up or So its going to go down?" well answer to that is BOTH.
They are always fighting and more often than naught one will break and other one will move on to its multiplier.
Pretty simple and powerful stuff.
