Fibonacci Retracement


Fibonacci WavesAn idea regarding Fibonacci
I believe the price within the arcs of the fibonacci circle move in waves
With 1.618 being a bearish wave in this case, with a bullish transition to another ring.
There seems to be a clear relationship between 1.618 and .618 its probably simple for someone more knowledgeable in this field which I am still learning.
Explains on chart.
If anyone knows more about this comment please.

Pull Back Rally only until NIFTY Closes above 10000 by April endAs per monthly charts NIFTY has to close above 10000 level to consider this as rally, otherwise it will treated as pull back retracement only.

US30 Target Price 23874Fibonacci Level is broken with a close above 1.618 (22543). Fibonacci Level is retested at 1.618 (22543). Buy limit was set at 1.618 (22543) after the Level was broken with a Daily Close above price 22543.

How To Day Trade Consolidations Profitably With #FibonacciTraders, Several fellow day traders have been asking to show how they can day trade using fibonacci based analysis which I use for swing trading. The fibonacci based analysis is applicable to all chart time frames and on all instruments in all markets. It even works on tick charts. In this educational video I present how we could have made 130 pips easily with day trading GBPUSD using fibonacci based analysis. Support and motivate me by hitting the like button, subscribing to my channel and sharing this analysis with other traders. Comment below and let me know what you think of this analysis and what is yours? I welcome all comments, feedback, ideas and sharing of knowledge.
Have a great trading week!

What Path For SPX?
With the entire world a bit shaken by everything in it including the S&P 500 Index now would be a good time to see how the market has previously turned the corner after being clipped by a “Black Swan”.
I’ll start with the monthly chart which will update monthly, weekly, daily, etc. Technical Indicators I enjoy using include moving averages, Williams Alligator, Gaussian Channels and occasionally the VSRS. I might also use ADX and RSI, occasionally.
This chart includes a reversed Fibonacci Retracement Scale along with both Elliott Impulse and Correction Waves retracements of the SPX going back to August of 1982 to help us keep a calm and level mind going forward.
If you take notice you will see the market is still well above the blue 100 EMA however you can observe the market has been below it several times in the history of the SPX as well as the red 200 EMA.
You might also recognize the Elliot characteristics in the Elliott Impulse Wave from Aug 2009 up to the past ATH of 3393. Notice point 2 does not drop below point 0 at (c), that leg 3 is the longest, that leg 1 and 5 closely match in length and that it is also the start of the Elliott Correction Phase.
Is there anything that could substantiate that? There is. The Elliot Correction Phase has undeniably begun. The low for March was a measly 162 points above being a full 50% Fib Retracement. That same low also dove below the last Elliott Impulse Wave 5.
The refreshing thing I think is the Elliott Correction Wave is a simple path to follow.
Hope to see all of you as we progress forward.
Remember. This is not trading advice. Please engage the like button and add your comments below, Follow me if you wish, share it if you want.

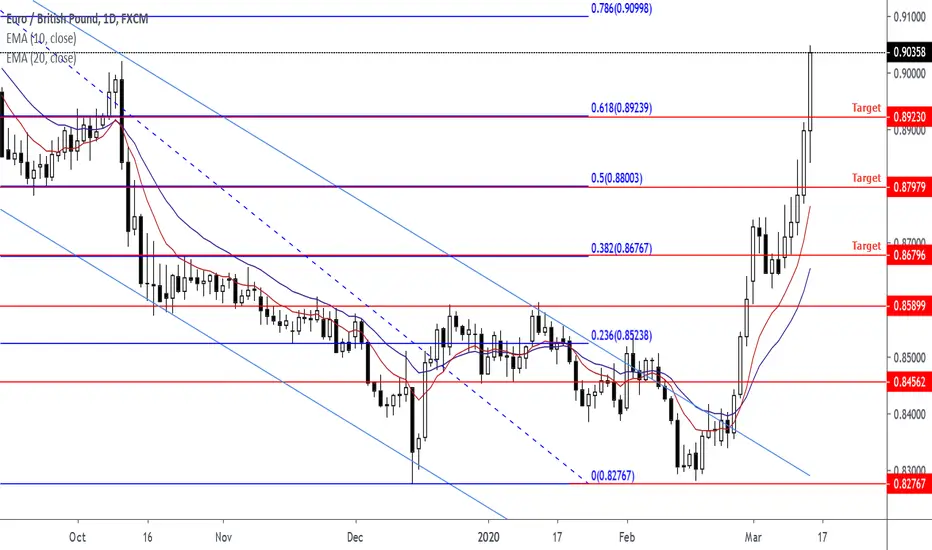
EURGBP 2020/03/15 Parallel Channel and Fibonacci LevelEURGBP Parallel Channel and Fibonacci Trade Idea From 2020/01/31. Price hit three targets.

Ethereum - How we conduct Technical analysisTechnically I refer specifically to ETH in this post but this analysis should help guide analysis on other securities, crypto or otherwise. I hope the chart is self explanatory and if not please ask. We are basically looking for bullish divergences which I have highlighted using angled lines and also utilizing the Fibonacci tool. Please look up videos on youtube if you don't know how to use it. However I have provided arrow tipped lines showing how it can be used to predict retracement as well as extension levels. In placing the 0 and 100 points *beginning and end of Fibonacci spread) we basically need to look for and identify our impulse wave, a clear movement in any direction, up or down. Lastly never forget to utilize volume, we can see from the horizontal bars towards the right of the screen that the path of least resistance is up. Thanks for reading and I hope this helps.

#CADCHF Fibonacci Analysis Tutorial & OpportunityTraders, in this short analysis, I show how to draw Fibonacci ratios to predict market movements and plan trades. We also look at how we plan to execute these trades for best R:R.
Hit the like button if enjoyed this analysis and found it useful. Thanks!

The ADR Secret for Market Maker Traders!In this video, I will show you how to use the Daily chart to predict best ADR ranges.
You will also learn how to turn fibonacci tool into an ADR tool. Plus a lot more.

#GBPUSD #HarmonicPatterns #Consolidation #ForexTutorialGBPUSD has been consolidating and creating harmonic patterns and Fibonacci confluences. Trading consolidation does not have to be boring. All we need is the just the knowledge of Fibonacci ratios and harmonic patterns

Bitcoin - Big players are using these levels, so why not you? Before reading, please show me some love by liking and commenting! It's free, so why not?
In this post I want to show you the power of the Golden Pocket (0.618 -0.65 Fibonacci retracement). After one year in a downtrend, we finally saw that price increased and reached a high of $13920 on Bitmex.
But why did the price stop exactly at this level?
For those who think that TA is not working, here is the answer:
Fibonacci is a fantastic tool that works in all markets of the world, and when you understand how to use it, it make the difference between an amateur and a pro trader.
In this example, since we are looking for a short opportunity, we just took the high that we reached the 11 December 2017 and the low of 10 December 2018. And what do you notice? Yes, price stopped exactly at this Golden Pocket.
Is this a coincidence? Not at all.
Why this level is very important and why do you see price rejection most of the time at this level?
Because big players are using it, financial institutions with large capitals that have very complex trading algorithm use it every single day, whether it is for scalping, day trading or swing trading.
Now when using the Golden Pocket we don't want to blindly long or short at this level. What we are looking for is confluence with at least something else.
In this case, what made this trade a high probability one is the fact that the Golden pocket was sitting exactly at the previous weekly level of $13873 (previous support that became resistance) which is enough of a confluence to take the trade.
Big players are using those levels, so why not you?
If you love this content please support me by sharing, commenting and following me! Thank you and ...
Have an amazing day!

Some tipsSome of the way I use 382's ( and other things ); Some of the problems with shorting highs and how I handle it.

How To Plan Plan A Trade With Fibonacci Ratio ConfluenceHi Traders, In this video we will look at How To Plan Plan A Trade With Fibonacci Ratio Confluence. Fibonacci ratios are most powerful tools with they are used in right manner. We can use them in all sorts of market conditions and asset classes. Fibonacci confluence creates harmonic patterns and gives us very good reward risk ratio. The best thing is the possibility to pre-plan and quantify a trade with high accuracy.
Please feel free to comment or ask questions. Hit the like button if you found value in this post. Thanks! :)

Trading Consolidation Profitably In Forex Markets With FibonacciTrading Consolidation Profitably In Forex Markets With Fibonacci and Harmonic Patterns (A Fibonacci Confluence Tutorial)
Hi Traders, In this videos we look at how to trade consolidation periods profitable using fibonacci and harmonic patterns. Apart from using support and resistance, trend lines and channels, we can use the power of fibonacci ratios. Best thing about fibonacci ratios is that we can pre-define targets or make a fairly accurate prediction about market's move. We can can quantify trades in advance. Fibonacci is one the main tools that I use in my confluence trading. Fibonacci is the first tool that pick to start my analysis.
Feel free to post your comments or ask questions. Sorry I ran out of time so I will create another part. If you find this useful please Give it a like and share with fellow traders.
Like, Share and Comment.
Thanks

XAUUSD Fibonacci Level and Support Resistance LevelConfluence with 1478.85 Horizontal Support Resistance Level and 50% Horizontal Fibonacci Level (1478.87)

Analisis tecnico y cientos de PipsPodemos ver como con el análisis técnico, con acción precio, se pueden agarran buenas y efectivas entradas, no es necesario algún indicador, sin embargo es ideal apoyarse en la herramienta de Fibonacci para tener mas seguridad de su operación.
Siguiendo los principio de Ralf Ellitot, podemos ver la estructura definiendo las 5 olas de ese ciclo del mercado, aprovechando así la tendencia, y que los pisos pasan a ser techos, para confirmar con velas de 4 horas bastante información para tomar la decisión de entrar en los trades y tomar buenas ganancias, siempre surfeando la tendencia, dejándose llevar por la ola del mercado.
Nota: En la imagen me confundi, se compra cuando techo sea piso. Claremente se ve como el techo pasa a ser piso. (No piso a techo, eso seria venta)

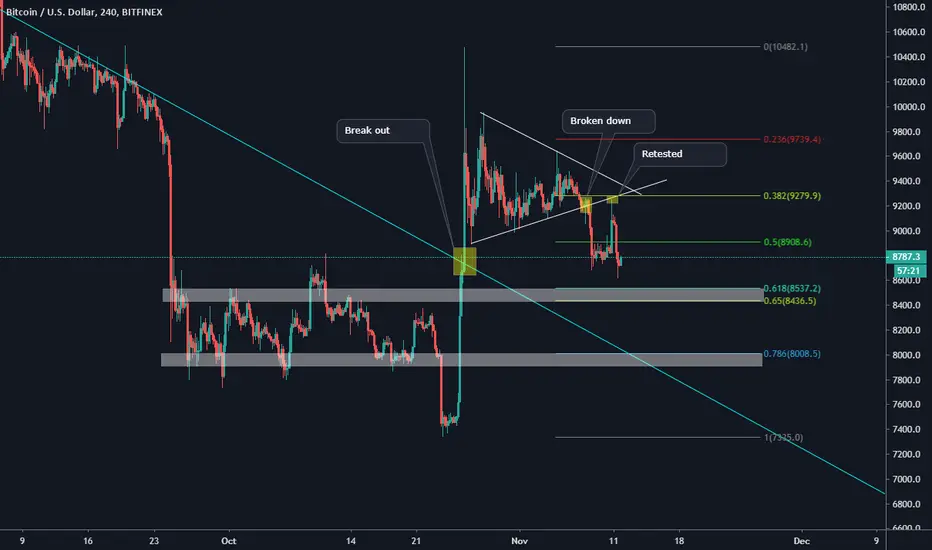
The Precision of Break Out StrategyHello All! Welcome back with me in this another bitcoin analysis. First of all, I want you to look at my previous analysis about shadow support on bitcoin in this article which is holding true. We have seen a spike to test the previous broken support that is now become resistance.
On this chart, we will cover the mid term view of the bitcoin's movement. First of all, I want to repeat again the knowledge of the break out strategy that I am using. So, here it is :
1. Initial Break Out : is the initial try of the price to surpass the support or resistance and on the higher time frame, we see it close just out of the current range.
2. Retesting the previous broken level : Just like the basic terminology, what ever that goes up, it will retrace to find another point of interest. In this case usually we see a pull back after the broken out of the previous support or resistance. Usually we saw a rejection toward this previous s/r and this will be our ideal entry for longing or shorting.
3. The real Break out : Price will start its rally after the phase 2 get a clear confirmation.
Therefore, I see in the mid term, there might be a potential reverse in price to the blue resistance trend line. because since the initial break out of this resistance trend line, we haven't seen any test toward this previous resistance that is now become support. And within this terminology, I personally very interested in looking for the fibonacci level to determine which will be the candidate for support level. I see these 2 levels, which has confluence zone with the resistance trend line. They are the golden pocket around $8500 and the 78.6 fib retracement around $8000. However, this 2 levels of support was previously become a price range since September 25th until October 20th.
Although there are a lot of bearish bias that occuring in the market, I am still hoping that the $8000 can hold the price from further drop. Drop from current level will cause the chance of the price hit the $6000 or lower will getting bigger.
BTC Short term viewHello fellas, welcome back with bitcoin update again and again. Coming to the consolidation zone, we can see a lot of frustation and a lot of uncertainty has came to this crypto space. The only good view is on the altcoin market which is holding its most of the bottom support. A coin like Omisego, Nano, and Stellar (beside the coin burn fundamental) has surged up from its bottom, this will once again become the indication of increasing attraction of free money to this altcoin market.
Coming back to the bitcoin insight which always phenomenal and being unpredictable, I want to analyze it in short term view and in lower time frame. Based on my technical analysis, we can easily see that the $9500 has been a very very huge resistance for bitcoin. In last few days, we have seen a very sideways market. But, slowly the price is forming a higher low structure since October the 26th, 2019. Therefore, it forms like an ascending type of the triangle. Although a lot of bearish pressure has intimidate the bulls for a long time, but the bulls still remain strong and consistent at least at lower time frame. I could change my bias from bearish to bullish short term as if the price can break the $9500 and we can see a push further toward $9700 or even the $10000 region. But, as long as the resistance is remain valid, I am still bearish short term.
Anything can happen in crypto market.

BTC (Prj.Y19.P6.TEST).Video.Recording.TESTJust ignore.
I'm trying out the video recording and publishing function for the first time.

Manipulation, Death Cross and Xi Jinping's statementHello fellas, welcome back to our Saturday update about bitcoin. Let's get to the point
We have seen a 40% surge on bitcoin in 1 day of trading. However, even in crypto industry, this is still a tremendous moves so far and unfortunately, once again it indicates that the crypto market is showing its unstable circumstance which can easily manipulated. Just right before the 40% surge, the China president, Xi Jinping shared his view about bitcoin and announce a support on blockchain in China. However, this gives a tremendous effect on crypto market. Altcoin's market lose a lot of volume but on the other hand, money inflow in bitcoin is growing even faster.
I believe that it is only the manipulation that some parties made to wipe out the people who short the market. I do expect a little pullback to the upside but I never thought that it was this tremendous. I am a type of the people who don't believe in fundamental analysis, I am 100% technical believer. All the short term spike is just manipulative as always. Now, look at the higher time frame of daily chart.
After the 40% surge to the upside, today's candle produce the 12% wick of rejection and is still moving below the white resistance region. this white resistance region was the broken support that is now become resistance as well. And the white trend line is the resistance trend line that has held the price since june 26th, 2019. As long as the price is still moving below this trend line, I will still remain bearish as well.
Another view on another technical indicator, which is EMA 55 and MA 200, we can easily deduce the death cross has already occured. However, death cross is always be the most respected factor to look for most of swing traders. I am expecting a daily candle closure will be below the EMA 55 which is the blue dynamic line to confirm this continuation of down trend.
