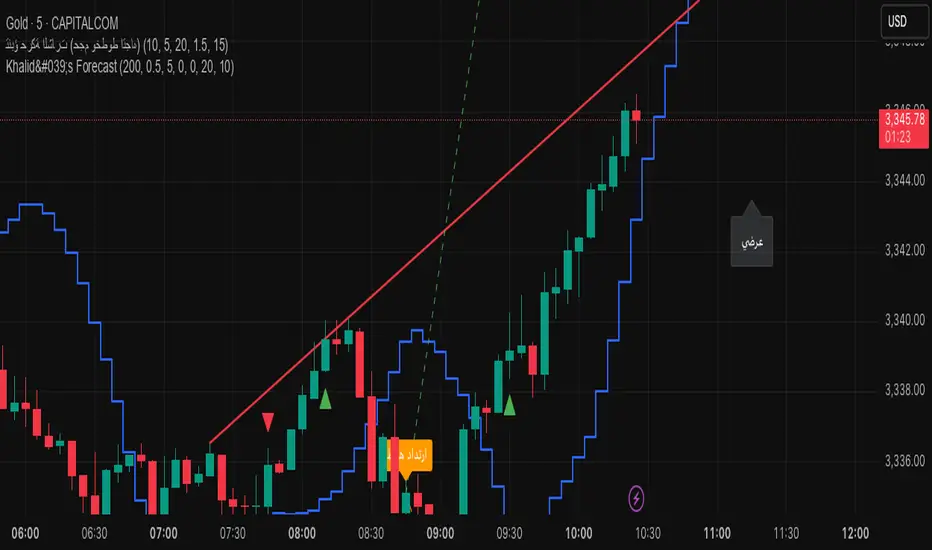
تنبؤ حركة الشارت (حجم وخطوط اتجاه)this indicator for estimated movement on 15 or 5 mints try it and note the R & S lines .
good luke
Breadth Indicators

Khalid's Custom Forecastthis is very very improved indicator for daly trading .
please analysis and note the S & R

Heikin Ashi Trend Strategy (Beginner)FOR BEGINNERS
Perfect! Below is a custom Pine Script for TradingView that:
Uses Heikin Ashi candles
Shows buy/sell signals based on trend conditions:
3+ green/red Heikin Ashi candles
Price above/below 20 EMA
RSI filter for momentum

Momentum & stoch rsimomentum and stochastic rsi indicator ideal for day trading. momenum is set to 80 for a smooth and safe analysis.

IB Breakout Strategy with Fib, CVD, and DivergenceEntry rules and signals- I wait for the 5min IB(initial balance) to form every session for eg-(first 5min candle of london session or ny session, marking top wick to bottom wick of first 5 min candle with a midpoint in that zone.Then look for CVD(cumulative volume delta) if it's alining with my analysis.I also mark previous session fib levels for scalp entries on .618 or .78 level.Also i do mark previous day VAH(value area high),VAL(value area low) and POC(point of control) for better understanding of direction.
Initial stop loss and take profit values-Initial stop loss varies from 200$ to 500$ and take profit varies from 250$ to 500$.
Number of contracts you plan to trade based on system stats and risk management-I plan to trade 1-2 contracts until i reach the safety net.Once safety net is achieved based on my entry level i decide the contract size which varies from 1-4 contracts.
Trade management and any trailing stop methods-I trail the stop once i feel like there's enough room for the trade.I manage the trade on the basis of strength of a candle, if its taking much time without strength i exit the trade.

D15 Precision IndicatorD15 Precision Indicator
The D15 Precision Indicator is a high-accuracy intraday trading tool optimized for 15-minute charts. It identifies precise BUY and SELL signals only when all key conditions align:
✅ Price above/below EMA 21 & EMA 50
✅ Price above/below VWAP
✅ Price within predefined support/resistance zones
✅ Break of Structure (BOS) confirmed by pivot levels
✅ High-volume breakout candle
✅ Optional confirmation from previous candles for added precision
The script includes:
Clear visual arrows (BUY/SELL)
Dynamic background highlights for signals
Support/Resistance zone boxes
All key indicators plotted (EMA, VWAP, zones)
Ideal for disciplined traders aiming for 80%+ win rate through strict signal filtering and visual clarity.

EMA Slope AngleTo help you find out how good is the current trend.If its positive look for longs and vise versa

Khalid's Custom Forecastthis indicator very useful o be link to others to read the future of the prices .

Oz SIGNAL PRO v6 is a powerful 15-minute trend-following indicator tailored for precision trading. It detects Break of Structure (BOS) and CHoCH signals with built-in volume confirmation and overlays premium/discount zones directly on the chart. The indicator includes:
🔹 Visual buy/sell labels at breakout points
🔸 Dynamic EMA and VWAP for trend filtering
🟩 Automatic support/resistance zones
🔔 Alert-ready for signal automation
Ideal for intraday traders seeking clean, high-confidence signals.
Upgrade-ready: Easily extend with FVGs, order blocks, liquidity sweeps & backtesting.

Trajectory Channel (VWAP Highs/Lows) [Euler-Inspired]This script identifies and visualizes key price trajectories by connecting recent pivot highs and lows on the weekly timeframe using either VWAP or Heikin-Ashi closes. It draws fully extended trend lines between the two most recent qualifying pivot highs (in red) and lows (in green), allowing traders to interpret natural directional channels—similar to manual trajectory plotting.
Inspired by Euler’s method of approximating paths, this tool avoids clutter by selectively connecting pivots that align with structural movement, providing traders with long-term support and resistance trajectories.
Use the sensitivity input to control how strictly pivots are defined, and toggle between VWAP-based or Heikin-Ashi-based pivots depending on your strategy.


STMD Indicator PROThe STMD Indicator PRO is designed for traders looking to capture strong trends using moving average alignment and the powerful Elephant Bar pattern, popularized by Oliver Velez.
📋 How it works?
✔ Simple Moving Averages:
SMA 8 (Black)
SMA 13 (Purple)
SMA 20 (Blue)
SMA 200 (Red, optional filter)
✔ Signal conditions:
All SMAs aligned and trending in the same direction
Price near the short-term SMAs
A strong candle (Elephant Bar) with a big body and small opposite wick
Signal only on the first or second consecutive candle of the same color
✅ Features
✔ Background color showing trend bias
✔ Alerts ready: STMD Buy and STMD Sell
✔ Optional SMA 200 filter for higher timeframe confirmation
📌 Disclaimer: This script is for educational purposes only. Not financial advice.

Bollinger Bottom + Middle Lines with Inline TextThis script visualizes key Bollinger Band levels based on two different SMAs (20 & 50 periods), with clear labeling and a smart price table.
🔸 Features:
Draws lower and middle Bollinger Band lines for both SMA(20) and SMA(50)
Inline text at the end of each line instead of default labels (cleaner view)
A dynamic table in the top-right corner, sorted from highest to lowest level
Color-coded rows:
▪️ Orange → BB20 Mid & BB20 Lower
▪️ Green → BB50 Mid & BB50 Lower
Auto-updates each bar without cluttering the chart
✅ Ideal for identifying technical accumulation zones
✅ Suitable for investors using scaling-in strategies or mean-reversion logic

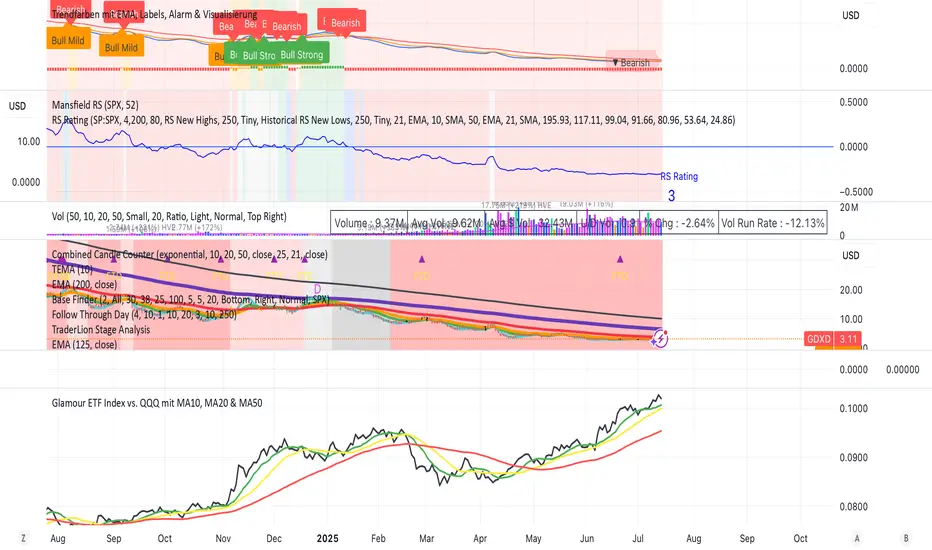
Glamour ETF Index vs. QQQ mit MA10, MA20 & MA50Stan Weinstein uses the term "Glamour Index" as a sentiment indicator to assess how speculative or overheated the stock market is. The Glamour Index measures the relationship between so-called "glamour stocks" (trendy stocks, hyped stocks with high media attention and sometimes extreme price increases) and solid, more conservative stocks. Weinstein uses this index to: 1) Analyze market sentiment – particularly whether the market is in a speculative euphoria phase.
2) Identify warning signs of a potential top formation or an impending downturn.
My basket compares performance against the QQQ (alternatively, SPY or any other benchmark is also possible).
My basket consists of the ETFs in the ARK universe, as well as other growth ETFs such as IPO, FFTY, and QQQJ.

RSI with Background Colorhis script implements a trading strategy based on an EMA (Exponential Moving Average) crossover, confirmed by the RSI (Relative Strength Index), and includes a built-in stop-loss and take-profit.

Multi-Timeframe Trend Analysis [Aaron Diaz]🧠 Indicator Review: Multi-Timeframe Trend Analysis
📌 What Does It Do?
The "Multi-Timeframe Trend Analysis" indicator by Aaron Diaz performs a trend assessment across multiple timeframes using Exponential Moving Averages (EMAs) as internal logic. Instead of plotting EMAs on the chart, this version only displays a clean dashboard that shows whether each EMA is trending up or down, keeping your chart clutter-free.
🧾 Based on the original indicator by BigBeluga, this version was modified by Aaron Diaz to remove the EMA plots and focus solely on actionable trend information via a table.
🔍 How It Works
It calculates 5 different EMAs (default: 20, 30, 40, 50, 60 periods).
For each EMA, it checks if it’s trending up (EMA > EMA 2 candles ago) or down.
These signals are then evaluated across 5 customizable timeframes (e.g., 1h, 2h, 3h, etc.).
A dashboard/table appears on the top-right corner of your screen, showing:
🢁 = Uptrend for that EMA and timeframe.
🢃 = Downtrend.
It uses color codes (green = bullish, purple = bearish) to make trend reading fast and intuitive.
🧱 Technical Foundations
Exponential Moving Averages (EMAs):
EMAs give more weight to recent prices, making them highly responsive to current trends.
Widely used to detect momentum and reversals.
Multi-Timeframe Analysis (MTF):
Helps confirm trend strength by analyzing multiple timeframes.
Reduces false signals and noise found in a single timeframe.
📈 Suggested Strategy: "MTF Trend Confluence"
🎯 Goal:
Only trade when multiple timeframes confirm the same directional bias.
✅ Long Entry Rules:
At least 3 out of 5 timeframes must show 🢁 on at least 4 of the 5 EMAs.
Confirm entry with:
A bullish candlestick pattern.
A breakout above recent resistance.
Optional filter: RSI or MACD not in overbought zone.
🔻 Short Entry Rules:
At least 3 timeframes must show 🢃 on at least 4 EMAs.
Confirm with:
A bearish candle or breakdown below support.
Optional filter: RSI or MACD not in oversold zone.
🛑 Exit Rules:
Take Profit at key support/resistance levels or at a 2:1 risk-reward ratio.
Stop Loss below/above the last swing or fixed % (e.g., 1.5–2%).
Exit early if the dashboard shows a shift in trend across key timeframes.
🧪 Example Use Case
You're trading on a 15-minute chart:
The dashboard shows 🢁 across 1h, 2h, and 3h timeframes for EMA20, EMA30, and EMA40.
Price breaks a local resistance level.
You enter long and target the next liquidity zone, placing your stop-loss below the most recent swing low.
⚠️ Important Notes
This is not a signal generator—it’s a trend confirmation tool.
Best used for swing or intraday trend trading.
Avoid using it in ranging or sideways markets.

Crypto Spot Volume Ratio**Overview**
This TradingView Pine Script v7 indicator computes and visualizes each exchange’s spot‐volume share relative to the average across ten major venues. By plotting ten “volume coefficients” around a baseline of 1, you immediately see which exchanges are trading above or below the aggregate average in each bar (timeframe period).
---
## 1. Data Sources
The script pulls spot trading volume for the current symbol (e.g. BTC/USDT, ETH/USDT, SOL/USDT, etc.) from these ten exchanges:
* Binance
* OKX
* Bybit
* KuCoin
* Gate.io
* HTX
* Kraken (USD pair)
* Coinbase (USD pair)
* Bitstamp (USD pair)
* Bitfinex (USD pair)
For USD-quoted venues (Coinbase, Kraken, Bitstamp, Bitfinex), it automatically converts the symbol suffix from “USDT” to “USD.”
---
## 2. Calculation Steps
1. **Fetch Volumes**
Using `request.security`, the script retrieves `volume` from each exchange’s contract at the chart’s timeframe.
2. **Sum and Average**
* **Total Volume (`sumVol`)** = sum of all ten exchanges’ volumes.
* **Average Volume (`avgVol`)** = `sumVol / 10‘.
3. **Compute Coefficients**
For each exchange *i*,
A coefficient > 1 means that exchange’s volume is above the ten‐exchange average; < 1 means below average.
4. **Rendering**
* **Table**: A horizontal row in the top‐right corner lists each enabled exchange’s coefficient (formatted to two decimals).
* **Plots**: Ten overlaid line plots show each exchange’s coefficient time series. A dashed horizontal line at **1** marks the average baseline.
---
## 3. Configuration Options
In the indicator’s settings panel, you can toggle **“Show …”** for any of the ten exchanges. Disabling an exchange will hide both its table entry and its plotted line—but does **not** change the average calculation (which always divides by 10).
---
## 4. Interpretation & Significance
* **Relative Activity**: By normalizing each venue to the ten‐exchange average, you spot shifts in where volume is concentrated.
* **Liquidity Insights**: Exchanges consistently above 1 may offer deeper liquidity, tighter spreads, or attract more order flow. Those below 1 may lag on volume, signaling lower activity or potential outages.
* **Arbitrage & Flow Monitoring**: Sudden spikes on a particular exchange (coefficient >> 1) can indicate localized buying/selling pressure, useful for spotting arbitrage windows, large order flows, or exchange-specific events.
* **Market Health**: Tracking the dispersion of these coefficients over time gives you a quick visual of how balanced or skewed the overall market activity is across venues.
---
## 5. How It Works in Practice
1. **Attach** this indicator to any USDT or USD spot chart (e.g., BTCUSDT, ETHUSDT).
2. **Observe** which exchange lines rise above the dashed **1** line—those venues are currently trading more volume than the average of the ten.
3. **Use** the table to see exact coefficient values each bar.
4. **Toggle** exchanges on/off to focus on specific venues without affecting the universal average baseline.
By comparing ten exchanges on a single pane, you gain real-time clarity on where crypto liquidity and activity are most intense—and where it temporarily wanes—empowering more informed trading, arbitrage strategies, and market‐structure analysis.

MA Band Zones with AlertsThis is a simple script with alerts.
Its a tool, helps traders, who works on price average range, to identify zones away from Moving average + and - side.
it will work on sma, ema, wma.
custom TF
custom source
alert 5 alert variation to choose from.
there is small glitch, kindly uncheck both the background boxes in in the input setting. it will removed in the next version

Turtle Trading System + ATR Trailing StopIndicator Description: Turtle ATR Trailing Stop
The **Turtle ATR Trailing Stop** is a technical indicator designed to enhance the classic Turtle Trading System by incorporating a dynamic trailing stop based on the Average True Range (ATR). This indicator is ideal for traders seeking to manage risk and lock in profits on both long and short positions in trending markets.
Key Features:
- Turtle Trading Levels: Calculates the 20-day highest high and lowest low to identify potential breakout points, a core principle of the Turtle Trading System.
- ATR-Based Trailing Stop: Utilizes a trailing stop that adjusts dynamically based on a multiple of the ATR (default multiplier: 2.0), providing a volatility-adjusted exit mechanism.
- Position Flexibility: Supports both long and short positions, with the trailing stop positioned below the highest price for long trades and above the lowest price for short trades.
- Smooth Updates: The trailing stop updates on each bar, ensuring a more responsive adjustment to price movements, rather than only on new highs or lows.
- Reset Mechanism: Automatically resets the trailing stop when the price deviates significantly (configurable threshold, default 0.1%), adapting to major trend reversals.
- Alerts: Includes customizable alerts that trigger when the price reaches the trailing stop level, notifying traders of potential exit points.
- Debugging Tools: Features an on-chart debug table displaying ATR, Close, Highest Price, Lowest Price, Potential Stop, and Trailing Stop values for real-time analysis.
How It Works:
- For **Long Positions**: The trailing stop starts below the initial close price (minus 2*ATR) and moves up as the highest price increases, locking in profits while trailing at a fixed ATR distance.
- For **Short Positions**: The trailing stop starts above the initial close price (plus 2*ATR) and moves down as the lowest price decreases, protecting against upward price movements.
- The stop resets if the price falls (for long) or rises (for short) beyond the set threshold, ensuring adaptability to new market conditions.
Customization:
- Period Settings: Adjust the length for highs/lows (default 20) and ATR period (default 14).
- ATR Multiplier: Modify the distance of the trailing stop (default 2.0).
- Reset Threshold: Fine-tune the percentage at which the stop resets (default 0.1%).
- Position Type: Switch between "Long" and "Short" modes via input settings.
Usage:
Apply this indicator to any chart in TradingView, set your preferred parameters, and monitor the trailing stop line (yellow) alongside the Turtle highs (red) and lows (blue). Use the debug table to validate calculations and set alerts to stay informed of stop triggers.
This indicator combines the trend-following strength of the Turtle System with a flexible, ATR-based stop-loss strategy, making it a powerful tool for both manual and automated trading strategies.


Samrat Directional Movement Index with Mediun to track ADX Samrat Directional Movement Index with Mediun to track ADX has a mediun line added for better tracking of ADX and +DI an -DI for traders.Feedback welcome
