Multi XXL IdicatorMulti XXL Indicator
Ma s (50,100,200)
Keltner
Bollinger 2 und 3
Future Pivot
Multi Timeframe MA
Breadth Indicators

MTF Bollinger Bands - ModifiedModified version of tansancrypto's MTF Bollinger to Pinescript 4 and removed limiters on BB1/BB2 max Sigma values.
Original Script:

Weis Wave Volume (Pinescript 4)Port of LazyBear's Weis Wave Volume indicator to pinescript v4 from v2.

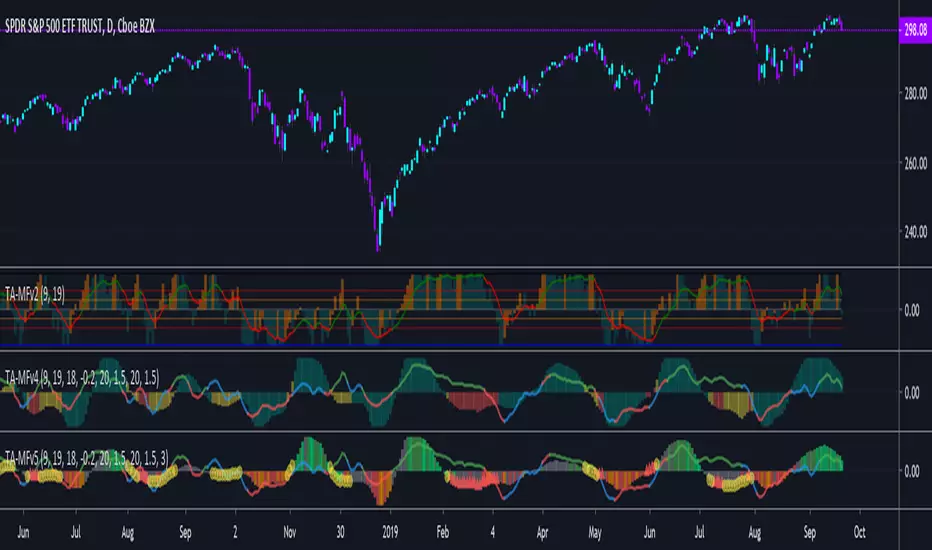
TA-Money Flow-Version5This is the MACD of a stochastic OBV movement indicator, Squeeze Momentum Indicator, and addition coloring for Market Direction Indicator . It is good (right) to work with both price and volume.
In this version we've moved the divergence highlighting to symbols at the ends of the histograms. Same coloring scheme as previous, yellow is divergence of either OBV or SQZ , red is both divergence. In the previous version we added in the "squeeze on - blue" highlighting to show follow through of divergence (or just squeeze/stall). We also added in another old script, but colors so well, Lazybears (Market Direction Indicator, linked below). Also incorporated a 3 color or 5 color scheme from the MDI script as a bool. It works great on any time frame, but you need to have volume data. Not sure where I originally got this (stoch-OBV, somewhere off Tradingview several years ago, thanks to the person who shared), Squeeze/MDI is Lazybear, links below.
Enjoy.
Version 5:
Moved divergence highlighting to symbols on histogram
Added coloring based on MDI
TA-Money-Flow-Version4
TA-Money-Flow-Version3
TA-Money-Flow-Version2
Squeeze-Momentum-Indicator-LazyBear
Market-Direction-Indicator-LazyBear


How to Collapse, hide, fold blocks of your codeThis script contains no trading value. This is no indicator.
It is only showing how to use a powerful editor feature:
To collapse (hide, fold) and expand (unhide, unfold) some blocks of your code.
Don't tell me you never wished it was there ;)
Well - it is!
How to enable it?
Look at line 4 of this script. It starts with //, but then there is this "opening curly bracket"
- it marks where block of code starts.
It produces that small arrow near number "4" of the code line, which you can click.
You close the block with "closing curly bracket" in line 18.
Thanks @ricardosantos for showing me this!
Next breakthrough editor feature like that will be Search&Replace. Stay tuned!
*********
Forex / Indices / Commodities traders who want to start AUTO-TRADING might want to take a look at http://www.tradingconnector.com, which allows no-latency trades execution from TradingView to MT4.

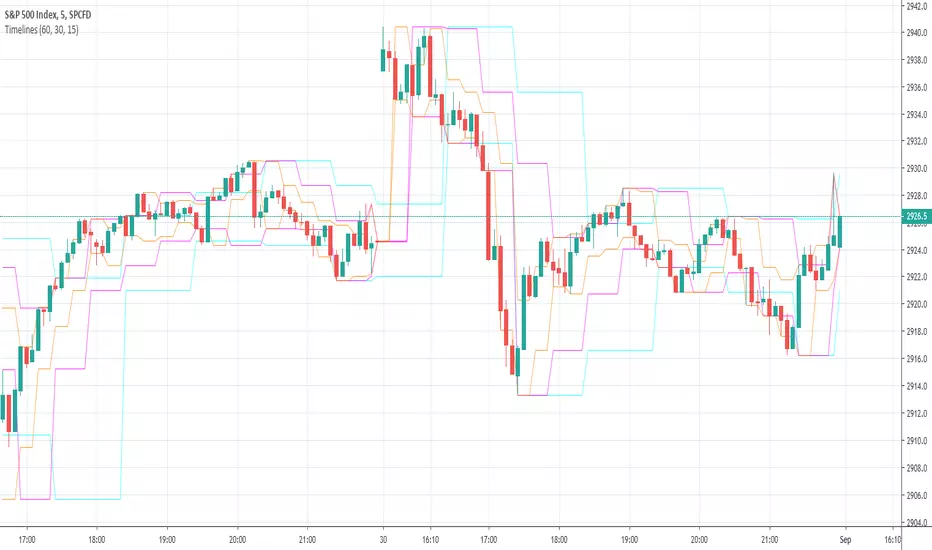
Timelines-Buschi
English:
This is a little, simple script I made upon request from a user.
It shows the highs ad lows of up to three custom timelines (e. g. 60 min, 30 min and 15 min) within a chart.
Deutsch:
Dies ist ein kleines, einfaches Skript, das ich auf Anfrage eines Nutzers erstellt habe.
Es zeigt die Hochs und Tiefs von bis zu drei individueller Zeitreihen (z. B. 60 min, 30 min und 15 min) innerhalb eines Charts.
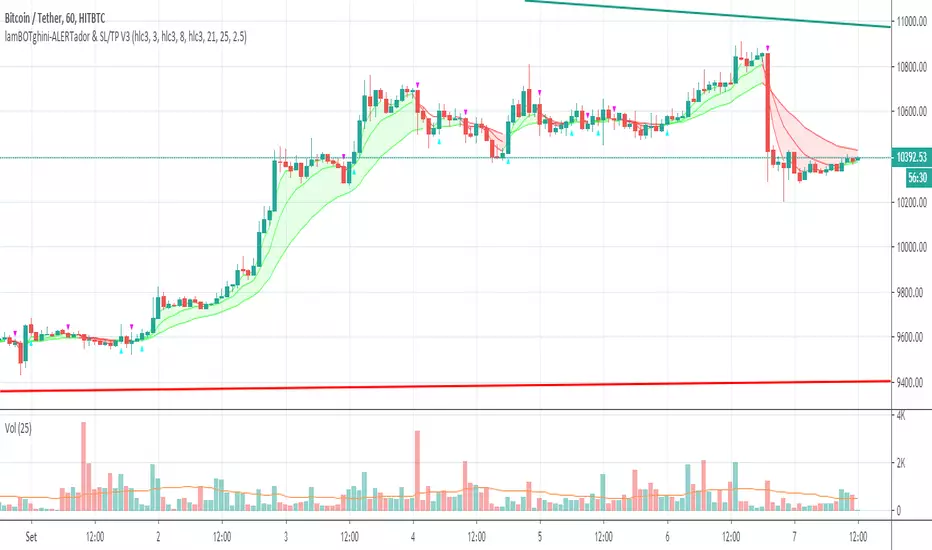
Trend Confirmation Indicator - Triple OBVDear all, you might wonder is there a confirmation indicator that has a high hit rate, is dependable, and could rely on the information it gives you when making a decision?
Here I present an indicator I developed specifically for cryptocurrency, in the minds of eliminating fakeouts and traps.
Trend is always invalid then there is a lack of volume, so by tracking the momentum of price direction & volume, we can have a ballpark about where the market is moving to.
On balance volume
obvshort = ema3
obvmedium = ema9
obvlong = ema26
This is a lagging indicator, which means it's not good at predicting reversal.
This is also the reason why
long signal = obvshort > obvmedium and obvshort > obvlong
shortsignal = obvshort < obvmedium and obvshort < obvlong
both without obvmedium >< obvlong
This indicator will not lie to you.
At last
Save Hong Kong, the revolution of our time.


cumulative colorJust a sum of up/down candles (+/- 1), and sum of consecutive up/down candles (choose on or another so that it displayed properly)
