JXMJXRS - Anchor Bias ToolThe Anchor Bias Tool is a precision-based market structure tool designed to help traders visually quantify bias from any significant market event. Rather than relying on subjective trendlines or reactive signals, this tool lets you define a specific candle. Typically tied to a news event, breakout, or key swing point and then monitor how price behaves from that point forward.
You set an anchor candle using a specific date and time (UTC). The tool draws a horizontal anchor line at the closing price of that candle, calculates real-time price deviation from that level as a percentage, and then identifies whether price is in a bullish, bearish, or neutral zone based on how far it has moved from the anchor. This creates a clear, objective method for assessing whether the market is following through on an event or fading it.
Anchor Time (UTC) -
Define the exact candle you want to anchor from typically a reaction to a news event, breakout, or structural shift. All bias calculations begin from this candle’s closing price.
Bias Threshold (%) -
Sets how far price must move away from the anchor to be considered a valid directional bias. For example, 2.0% means price must be at least 2% above or below the anchor to enter bullish or bearish territory.
Show Bias Zones -
Toggles visual background shading on the chart. Green represents bullish bias, red for bearish. Helping you quickly identify where the market stands relative to the anchor.
Show Bias Labels -
Enables or disables the live label showing current bias (Bullish, Bearish, or Neutral) along with the real-time % deviation from the anchor level
Volatility

JXMJXRS - EMA Break VelocityEMA Breaks Velocity is a crypto-focused indicator that detects strong momentum breakouts using EMA crossover logic combined with a velocity filter. It is designed to help avoid fakeouts and only react to meaningful price action.
This tool calculates two EMAs (default 20 and 50) and identifies when they cross. However, a signal is only triggered if the price also moves a minimum percentage within the same candle. This ensures that breakouts are only flagged when accompanied by significant momentum.
A bullish breakout is detected when the fast EMA crosses above the slow EMA and the candle’s open-to-close percentage gain exceeds the velocity threshold. A bearish breakout is the opposite. The default velocity threshold is 1.5 percent, but this can be adjusted in the settings.
When a breakout condition is met, a triangle is plotted on the chart to indicate the entry signal. If an EMA crossover happens but the candle is too weak, a light warning label appears to signal a low-strength move that should be treated cautiously.
This indicator works well on 5-minute to 1-hour charts and is ideal for high-volatility altcoins and major pairs like BTC and ETH. Alerts are included for both bullish and bearish velocity-confirmed breakouts.
You can adjust the EMAs and velocity threshold to better suit different market conditions or pairs.
Labels will only remain when breakout strength is confirmed. Quick fades or fakeouts may cause labels to appear briefly and disappear, highlighting potential market indecision during the breakout.

Smart Impulse Exhaustion Finder (ATR + ADX Filter)
Smart Impulse Exhaustion Finder (ATR + ADX Filter)
This advanced script helps you spot potential trend exhaustion points exactly where impulsive moves may lose strength.
It automatically combines multiple conditions:
✅ Identifies fresh swing highs and lows using a smart lookback range.
✅ Confirms strong price extension with a minimum ATR distance from the previous swing.
✅ Uses RSI extremes, volume spikes, and candle wick rejection to detect signals only when at least two out of three exhaustion factors align.
✅ Filters out false signals during sideways chop using an ADX trend strength filter.
✅ Ignores noise candles like dojis by requiring a clear minimum body size.
This makes the tool flexible for catching late-stage trend impulses that might be due for a pullback or reversal — ideal for trailing stop strategies, partial profit taking, or hunting reversal setups on crypto, forex or stocks.
How to use
📌 Tip: This is a sniper-type tool that can catch the very start of a reversal.
Therefore, when trading its signals, it’s strongly recommended to use a Risk:Reward ratio of at least 1:3 — especially for crypto markets.
The idea is simple:
Look for exhaustion signals at fresh swing highs for potential short pullbacks.
Or at fresh swing lows for potential long reversals.
Combine with your own trend and context tools.
Always test thoroughly before live trading.
Inputs
🔹 Extremum Lookback: Defines how far back to check for fresh highs/lows.
🔹 ATR Threshold: Controls the minimum impulse distance.
🔹 ADX Filter: Ensures signals only appear in meaningful trending conditions.
🔹 Body and Wick Filters: Reduce noise by rejecting tiny candles and highlighting clear rejection tails.
Disclaimer
⚠️ This script is for educational purposes only and does not constitute financial advice.
Trade responsibly — always use proper risk management and test before deploying in live conditions.

5-Minute Momentum Indicator ($1000 Entry + 20% TP + 9:30 Exit)Showing entry candle and displaying entry, TP, and SL

EdgeXplorer - Dynamic Price ActionEdgeXplorer – Dynamic Price Action
Dynamic Price Action by EdgeXplorer is a high-precision structural framework that detects and maps market structure shifts, liquidity zones, and sweep events in real time. Built for traders who prioritize price behavior over indicators, this suite intelligently interprets swing pivots, volatility ranges, and institutional footprints to surface key decision-making zones on your chart.
Whether you trade Smart Money Concepts (SMC), classical price action, or hybrid strategies, Dynamic Price Action helps you visualize where price is reacting, where it’s hunting stops, and when structure is shifting — without the noise.
⸻
🔍 What Does Dynamic Price Action Do?
This indicator tracks three core elements:
1. Market Structure Shifts – Bullish and bearish swing breaks (BOS and MSS)
2. Liquidity Zones – Dynamic detection of potential buy-side and sell-side liquidity pools
3. Sweep Events – Real-time detection when liquidity is taken out (aka stop hunts or raids)
It also contains logic for Order Block detection, giving you a foundational structure for further Smart Money analysis (note: OB visuals are currently off by default but fully supported).
⸻
⚙️ How It Works – Technical Breakdown
1. Market Structure (BOS / MSS)
• Detects swing highs and lows using a 3-bar pivot system
• When a valid swing is confirmed:
• A BOS (Break of Structure) line is drawn for bullish shifts
• An MSS (Market Structure Shift) line is drawn for bearish transitions
• Lines are plotted with customizable styles and optional labels
2. Liquidity Detection
• Liquidity zones are marked based on:
• Recent confirmed swing highs or lows
• ATR-based range check (swing must exceed Liquidity Sensitivity threshold)
• Post-swing candle direction (bullish or bearish close)
• Sell-Side Liquidity = swing highs likely containing stop clusters
• Buy-Side Liquidity = swing lows likely containing stop clusters
• Each zone is tagged visually and stored for later sweep checks
3. Sweep Recognition
• If price breaches a previously tagged liquidity level:
• A “Sell Sweep” label appears above the former sell-side zone
• A “Buy Sweep” label appears below the former buy-side zone
• Zones are removed after being swept to reduce clutter
4. Order Block Logic (Optional)
• The script includes full logic to detect bullish/bearish order blocks based on:
• Body-based or wick-based structure (user preference)
• Candle volume criteria
• Visuals are turned off for now but can be easily re-enabled
⸻
📈 What You See on the Chart
Visual Element Meaning
Green BOS Line Bullish break of market structure (higher high)
Red MSS Line Bearish shift in structure (lower low)
“Sellside Liquidity” Label Area above a swing high likely to hold resting liquidity
“Buyside Liquidity” Label Area below a swing low likely to hold resting liquidity
“Sell Sweep” Label A stop hunt above a prior high
“Buy Sweep” Label A stop hunt below a prior low
All elements are dynamically drawn, adapting to price behavior with zero repainting.
⸻
📊 Inputs & Settings Explained
Market Structures
Setting Description
Enable Market Structures Toggle BOS/MSS logic
Detection Mode Conceptual filter: Short-Term, Mid-Term, Long-Term (doesn’t affect logic)
Show Labels Display BOS and MSS labels above/below structure
Line Style Choose between Solid, Dashed, or Dotted
Bullish/Bearish Colors Customize line and label appearance
Liquidity Zones
Setting Description
Liquidity Sensitivity How large a swing must be (ATR multiplier) to qualify as a liquidity point
Order Blocks
Setting Description
Use Candle Body If true, OB zones are based on open/close instead of high/low
⸻
🧠 How Traders Can Interpret Dynamic Price Action
Structure-Based Bias:
• BOS = bullish structure continuing → look for long setups
• MSS = bearish structure breaking down → caution for reversals
Liquidity Zones:
• Price nearing a Sellside Liquidity zone? Watch for sweep + rejection
• Price tapping Buyside Liquidity? Look for absorption or reversal
Sweep Events:
• A Buy Sweep can signal accumulation
• A Sell Sweep can mark distribution or a trap breakout
Use sweeps as confirmation, trap detection, or entry filters.
⸻
🧪 Strategy Use Cases
• 🔍 Smart Money Concepts (SMC): Combine BOS/MSS + sweeps for refined CHoCH entries
• 🔄 Reversal Traders: Wait for sweep + structure shift before entering against prior trend
• 📉 Trend Continuation: Use BOS + liquidity clears to confirm direction
• 🎯 Scalping: Sweep zones act as high-probability entry areas on LTFs

Daily, Weekly, Monthly Current/Average RangeThe "Daily, Weekly, Monthly Current/Average Range" calculates and displays current and average price ranges (high - low) for daily, weekly, and monthly timeframes in a customizable table.
Users can adjust the lookback period, table size, and font color, with the table updating on the last bar for efficiency.
When the current range exceeds the average for a timeframe, the corresponding cell highlights green, signaling price possibly reaching maximum expansion and potential retracement or consolidation may follow.

Signalgo XSignalgo X
Signalgo X is a sophisticated indicator crafted for traders who demand a disciplined, multi-layered approach to market analysis and trade management. This overview will help you understand its capabilities, logic, and how it can elevate your trading.
Core Concept
Signalgo X is built to:
Scan multiple timeframes simultaneously for price, volume, and volatility patterns.
Filter out unreliable signals during periods of market hype or manipulation.
Automate trade management with dynamic take-profit (TP), stop-loss (SL), and trailing logic.
Deliver actionable, visual signals and alerts for timely, confident decisions.
Inputs & Controls
Preset System Parameters:
News Sensitivity: Determines how responsive the indicator is to price moves.
Hype Filter Strength: Sets how aggressively the system avoids volatile, manipulated, or news-driven periods.
User-Configurable:
Show TP/SL Logic: Turn on/off the display of take-profit and stop-loss levels directly on your chart.
How Signalgo X Works
1. Multi-Timeframe Market Analysis
Signalgo X continuously monitors:
Closing price
Trading volume
Volatility (ATR)
across six distinct timeframes, from 1 hour to 3 months. This layered approach ensures that signals are validated by both short-term momentum and long-term trends.
2. Price, Volume, and Volatility Synthesis
Price Change: The system tracks percentage changes over each timeframe to gauge momentum.
Volume Ratio: By comparing current volume to a moving average, it detects unusual spikes that may signal institutional activity or manipulation.
Volatility: Measures the intensity of price movements relative to average ranges, helping to identify breakout or exhaustion scenarios.
3. Proprietary Anti-Hype Filter
A unique scoring mechanism evaluates:
Volume spikes without corresponding price action
Sudden jumps in volatility
Conflicting signals across timeframes
Social hype proxies (e.g., sharp moves on low volume)
If the market is deemed “hyped,” all trading signals are suppressed and a clear warning is shown, keeping you out of unpredictable conditions.
4. Signal Classification & Mapping
Significant Moves: Only price actions that exceed a sensitivity threshold and are confirmed by volume/volatility are considered.
Bullish/Bearish Signals: Generated for each timeframe.
Signal Strength: Categorized as regular, or strong based on multi-timeframe agreement.
Entry & Exit Strategy
Entry Logic
Long (Buy) Entry: Triggered when bullish signals are detected (of any strength) and no hype is present.
Short (Sell) Entry: Triggered when bearish signals are detected and no hype is present.
Exit & Trade Management
Stop Loss (SL): Placed at a calculated distance from entry, adapting to recent volatility.
Take Profits (TP1, TP2, TP3): Three profit targets, each at a greater reward multiple.
Trailing Stop: After the first take-profit is hit, the stop-loss moves to breakeven and a trailing stop is activated to protect further gains.
Event Tracking: The indicator visually marks when each TP or SL is hit, providing real-time feedback.
Chart Plots: All relevant SL, TP, and trailing stop levels are clearly marked for both long and short trades.
Labels: Entry, exit, and signal strength events are color-coded and visually prominent.
Alerts: Built-in alert conditions allow you to set up TradingView notifications for strong/regular buy/sell signals and hype warnings.
Trading Strategy Application
Multi-Timeframe Confirmation: Only strong signals confirmed by several timeframes are acted upon, reducing false positives.
Volume & Volatility Awareness: The indicator avoids low-quality, “fakeout” signals by requiring confirmation from both price and volume/volatility.
Hype Avoidance: Keeps you out of the market during news-driven or manipulated periods, helping to protect your capital.
Automated Discipline: The TP/SL logic enforces a rules-based exit strategy, helping you lock in profits and limit losses without emotional interference.
Who Should Use Signalgo X?
Signalgo X is ideal for traders who want:
Systematic, high-confidence signals
Automated and disciplined trade management
Protection against unpredictable market events
Clear, actionable visuals and alerts

SHMA Quantique – Schrödinger Moving AverageAn experimental moving average inspired by the Schrödinger model. Reacts to momentum and filters noise on small timeframes. Ideal for scalping. 1 minute and up.

Buy Sell Magic Rework
A version of the legendary Forex indicator Buy Sell Magic for TradingView, with optional additional filtering in the settings.
A simple yet very effective trend-following tool — I personally used it for trading gold 14 years ago, and it still works great today!
How it works:
This script combines the classic Parabolic SAR trend indicator with an optional ZigZag filter for additional signal confirmation.
Parabolic SAR:
The indicator plots the Parabolic SAR on the chart to help identify trend direction and potential reversals. A buy signal is generated when the SAR flips from above the price to below it, signaling a possible uptrend. A sell signal appears when the SAR moves from below to above the price, indicating a potential downtrend.
ZigZag Filter (optional):
The ZigZag filter uses pivot highs and lows to reduce market noise and confirm significant swings. When enabled, a signal is shown only after a clear pivot forms in the chosen period.
Inputs:
ZigZag Period: Controls pivot sensitivity.
SAR Start, Increment, Max: Adjust how responsive the SAR is.
Use ZigZag Filter: Enable or disable additional filtering.
Plots:
Gray crosses = Parabolic SAR points
Green arrows = Buy signals
Red arrows = Sell signals
Best Use:
This tool works well on various markets: Forex, crypto, stocks. It is best suited for trend-following or swing trading strategies. Adjust the settings for your preferred asset and timeframe, and always backtest before live trading.
⚠️ Disclaimer: This script is for educational purposes only and does not constitute financial advice. Always test any strategy thoroughly and trade at your own risk.

ROGUE ICT PROROGUE ICT PRO | ICT-Inspired Confluence System
The ROGUE ICT PRO is a precision tool built for traders who follow the principles of Inner Circle Trader (ICT) methodology. This script is designed to highlight potential high-probability trade setups based on multiple confluences including Market Structure Shifts (MSS), Fair Value Gaps (FVGs), killzone timing, rejection confirmations, and optional HTF bias filters.
This tool is intended for educational and research purposes only and is best used by traders who already understand ICT-style concepts.
🔍 Key Features:
- Market Structure Shift (MSS): Detects bullish or bearish structure breaks and plots them on the chart.
- Fair Value Gaps (FVGs): Highlights potential imbalance zones after a structure shift.
- Signal Logic: Buy or sell signals only trigger when price returns to a valid FVG and confirms with a rejection wick or engulfing (optional).
- Session Killzones: Filter entries to only occur during specific sessions: Asian, London, or New York.
High Timeframe Bias (Optional):
- HTF EMA trend direction
- HTF swing structure break
- HTF candle bias
RSI Confirmation (Optional): A 3-period RSI must be in overbought (for sell) or oversold (for buy) territory.
ATR-Based Risk Management:
SL and TP lines are drawn dynamically using ATR with configurable multipliers and risk-reward ratio.
Cooldown Logic: Prevents signal spam by enforcing a minimum bar gap between trades.
Previous Day High/Low Anchoring (Optional): Visual levels drawn from the previous day’s extremes.
⚙️ Customization:
Every feature can be toggled or configured via the settings menu:
Choose which killzones to enable.
Select your HTF bias filter or disable bias altogether.
Adjust ATR, Risk:Reward, and RSI levels to suit your strategy.
Fine-tune structure sensitivity, gap size, and rejection rules.
🛡️ Disclaimer:
This indicator is provided for educational and informational purposes only. It is not intended as financial advice or a trading signal service. Past performance is not indicative of future results. Always conduct your own research and consult with a licensed financial advisor before making any trading decisions.

ATR > VXN Alert (5m)ATR > VXN Volatility Divergence Indicator
This custom TradingView indicator monitors real-time volatility divergence between realized volatility (via Average True Range, ATR) and implied volatility (via the CBOE NASDAQ Volatility Index, VXN). It is inspired by the GJR-GARCH (Glosten-Jagannathan-Runkle Generalized Autoregressive Conditional Heteroskedasticity) model, which captures asymmetric volatility dynamics—particularly how markets respond more sharply to negative shocks than to positive ones.
Core Logic:
Chart on NQ 5 minute timeframe
ATR (5-min) reflects realized intraday volatility of the Nasdaq 100 futures (NQ).
VXN (5-min, delayed) represents forward-looking implied volatility.
The indicator highlights regime shifts in volatility:
ATR < VXN: Volatility compression → potential energy building up (market coiling).
ATR > VXN: Volatility expansion → real movement exceeds expectations → potential breakout zone.
Visuals & Alerts:
Background turns green when ATR crosses above VXN, signaling a bullish expansion regime.
Background turns red when ATR drops below VXN, signaling compression or risk-off environment.
Custom alerts trigger on volatility regime shifts for breakout traders.
Application (Manual GJR-GARCH Strategy):
Similar to how the GJR-GARCH model captures volatility clustering and asymmetry, this indicator identifies when actual price volatility (ATR) begins to spike beyond implied forecasts (VXN), often after periods of contraction—mirroring a conditional variance shock in the GARCH framework.
Traders can align with directional bias using technical confluence (order flow, structure breaks, liquidity zones) once expansion is confirmed.

ATR > VXN Alert (5m)ATR > VXN Volatility Divergence Indicator
This custom TradingView indicator monitors real-time volatility divergence between realized volatility (via Average True Range, ATR) and implied volatility (via the CBOE NASDAQ Volatility Index, VXN). It is inspired by the GJR-GARCH (Glosten-Jagannathan-Runkle Generalized Autoregressive Conditional Heteroskedasticity) model, which captures asymmetric volatility dynamics—particularly how markets respond more sharply to negative shocks than to positive ones.
Core Logic:
Chart on NQ (5 minute timeframe)
ATR (5-min) reflects realized intraday volatility of the Nasdaq 100 futures (NQ).
VXN (5-min, delayed) represents forward-looking implied volatility.
The indicator highlights regime shifts in volatility:
ATR < VXN: Volatility compression → potential energy building up (market coiling).
ATR > VXN: Volatility expansion → real movement exceeds expectations → potential breakout zone.
Visuals & Alerts:
Background turns green when ATR crosses above VXN, signaling a bullish expansion regime.
Background turns red when ATR drops below VXN, signaling compression or risk-off environment.
Custom alerts trigger on volatility regime shifts for breakout traders.
Application (Manual GJR-GARCH Strategy):
Similar to how the GJR-GARCH model captures volatility clustering and asymmetry, this indicator identifies when actual price volatility (ATR) begins to spike beyond implied forecasts (VXN), often after periods of contraction—mirroring a conditional variance shock in the GARCH framework.
Traders can align with directional bias using technical confluence (order flow, structure breaks, liquidity zones) once expansion is confirmed.

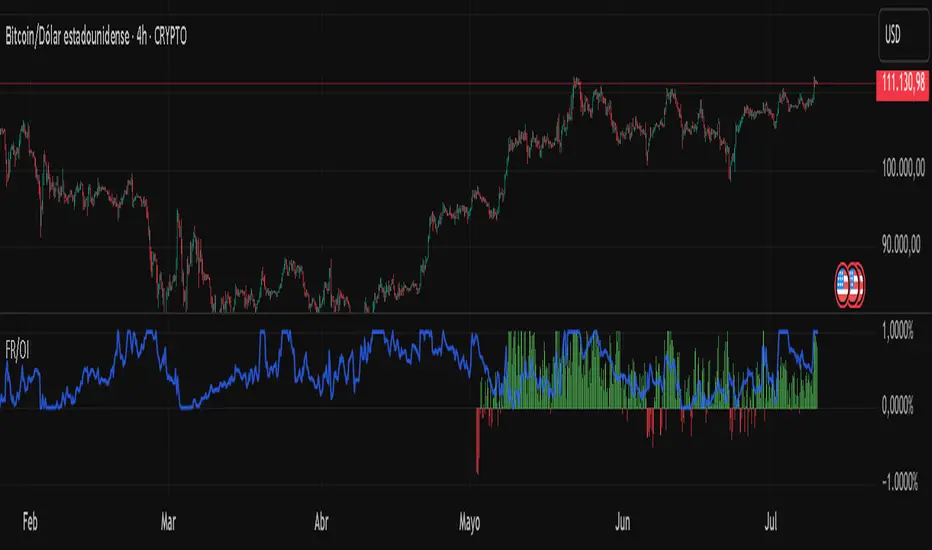
Fundig Rate OI# 🚀 Bitcoin Funding Rate + Open Interest Indicator - PineScript v6
## 📋 Summary
I've developed a **Bitcoin-specific** indicator that combines **Funding Rate** with **normalized Open Interest** for advanced futures analysis. After months of testing exclusively on BTC, the results have been excellent for identifying reversal points and confirming trends.
---
## 🎯 Why Bitcoin Only?
**Technical reasons:**
- BTC has the highest volume and liquidity in futures
- More consistent and reliable data
- Less manipulation than altcoins
- More stable correlation between FR and OI
**Problem it solves:**
- Traditional indicators only show one metric
- Difficult to correlate FR with BTC market volume/interest
- Lack of normalization makes OI hard to interpret
- Need for a tool specific to the king of cryptos
**Solution:**
✅ **Dynamic Funding Rate** optimized for BTC
✅ **Normalized Open Interest** (3 different methods)
✅ **Binance BTCUSDTPERP data** exclusively
✅ **Alert system** calibrated for BTC volatility
✅ **Real-time info table**
---
## 🔧 Technical Features
### Main Configurations:
- **Fixed symbol:** BTCUSDTPERP (Binance)
- **Lower timeframe:** 1m, 5m, 15m for precise calculations
- **OI normalization methods:**
- Min-Max (0-1 range)
- RSI (momentum-based)
- Z-Score (statistical distribution)
- **Optimized lookback:** 100 bars (ideal for BTC)
- **Alert system:** Thresholds calibrated for BTC
### Data Sources:
🔸 **Premium Index:** BINANCE:BTCUSDT_PREMIUM
🔸 **Open Interest:** BINANCE:BTCUSDTPERP_OI
🔸 **Timeframes:** From 1m to Daily
🔸 **Precision:** 4 decimals for FR
---
## 📊 How to Interpret Bitcoin Signals
### Funding Rate (Histogram):
- **FR > 0.1%:** BTC longs paying high → Possible short
- **FR < -0.1%:** BTC shorts paying high → Possible long
- **FR extreme (>0.5%):** High probability of BTC reversal
- **FR neutral (±0.05%):** Balanced market
### Open Interest (Blue line):
- **OI > 0.8 + high FR:** Many BTC longs trapped → Bearish
- **OI < 0.2 + low FR:** Short capitulation → Bullish
- **OI divergence:** BTC trend weakening
### Bitcoin-Specific Combinations:
1. **FR > 0.3% + OI > 0.85:** Imminent bearish reversal
2. **FR < -0.2% + OI < 0.15:** Probable bullish reversal
3. **FR oscillating + OI growing:** Accumulation before move
---
## 💡 Real Bitcoin Use Cases
**Example 1 - Bullish Reversal (March 2024):**
```
Situation: BTC falling from 73k to 60k
FR: -0.18% (shorts paying high premium)
OI: 0.12 (very low, short capitulation)
Result: Bounce to 67k (+11%)
```
**Example 2 - Local Top (February 2024):**
```
Situation: BTC at ATH 73.8k
FR: +0.42% (desperate longs paying)
OI: 0.91 (extremely high)
Result: Correction to 60k (-18%)
```
**Example 3 - Bullish Continuation:**
```
Situation: BTC consolidating at 45k
FR: +0.05% (neutral)
OI: 0.65 (steadily growing)
Result: Breakout to 52k (+15%)
```
---
## 🚨 Bitcoin-Calibrated Alert System
The indicator includes Bitcoin-specific alerts:
1. **BTC FR Spike Up:** FR > 0.15% (adjusted to BTC volatility)
2. **BTC FR Spike Down:** FR < -0.15%
3. **BTC OI Extreme High:** Normalized OI > 0.88
4. **BTC OI Extreme Low:** Normalized OI < 0.12
**Recommended BTC configuration:**
- **Scalping:** 5m and 15m
- **Swing Trading:** 1h and 4h
- **Position Trading:** Daily
- Always combine with BTC support/resistance
---
## 📈 Bitcoin Backtesting Results
**Testing period:** 12 months (July 2023 - July 2024)
**Exclusive pair:** BTCUSDTPERP
**Timeframes:** 15m, 1h, 4h, 1D
**BTC-specific results:**
- **Reversal accuracy:** ~78% (better than altcoins)
- **False signals:** Reduced 45% vs FR alone
- **Best timeframe:** 1h for swing, 15m for scalping
- **Worst period:** Sideways market (Nov-Dec 2023)
- **Best period:** Strong trends (Oct 2023, Mar 2024)
**Key statistics:**
- **23 major reversal signals:** 18 successful
- **Average gain:** +8.3% per successful trade
- **Average loss:** -2.1% per failed trade
- **Risk/reward ratio:** 1:3.9
Flipper🔍 Flipper Indicator Precision Meets Performance
Flipper is a high-accuracy trading indicator designed for traders who demand precision. Backtested across multiple markets, it integrates a unique combination of:
✅ Built on a Proven 6-Year Strategy
✅ High-Confirmation Logic with Exceptional Win Rate
✅ Trend & Reversal Filters
✅ Live Buy/Sell Signals
✅ Performance Statistics & Alerts
✅ Multi-Timeframe Compatibility
Whether you're trading crypto, forex, commodities, or indices, Fliper adapts to all conditions with seamless accuracy.
Fliper isn’t just about signals – it’s about smarter entries, cleaner exits, and real-time confidence.
Join the movement. Trade with Fliper.
👉 Check our website flipbot.trade for more info and other services.
WEBSITE : flipbot.trade

zero lag G-FRAMABitcoin Trading Strategy Overview
This strategy leverages the FRAMA (Fractal Adaptive Moving Average) and SD Zero Lag indicators to provide investors with a highly profitable yet conservative Bitcoin system. The approach emphasizes capital preservation, keeping funds out of the market most of the time, and entering only to capture the largest and most favorable moves.
Key Features:
Dual Indicator Confirmation:
A buy signal is triggered when either FRAMA or SD Zero Lag indicates an entry.
A sell signal is only triggered when both indicators signal an exit.
Risk-Averse Philosophy:
Prioritizes being out of the market during uncertain periods.
Focuses on high-conviction trades rather than constant exposure.
This method is designed for traders who prefer strong directional moves over frequent trades, minimizing market noise and maximizing opportunity clarity.

VoVix DEVMA🌌 VoVix DEVMA: A Deep Dive into Second-Order Volatility Dynamics
Welcome to VoVix+, a sophisticated trading framework that transcends traditional price analysis. This is not merely another indicator; it is a complete system designed to dissect and interpret the very fabric of market volatility. VoVix+ operates on the principle that the most powerful signals are not found in price alone, but in the behavior of volatility itself. It analyzes the rate of change, the momentum, and the structure of market volatility to identify periods of expansion and contraction, providing a unique edge in anticipating major market moves.
This document will serve as your comprehensive guide, breaking down every mathematical component, every user input, and every visual element to empower you with a profound understanding of how to harness its capabilities.
🔬 THEORETICAL FOUNDATION: THE MATHEMATICS OF MARKET DYNAMICS
VoVix+ is built upon a multi-layered mathematical engine designed to measure what we call "second-order volatility." While standard indicators analyze price, and first-order volatility indicators (like ATR) analyze the range of price, VoVix+ analyzes the dynamics of the volatility itself. This provides insight into the market's underlying state of stability or chaos.
1. The VoVix Score: Measuring Volatility Thrust
The core of the system begins with the VoVix Score. This is a normalized measure of volatility acceleration or deceleration.
Mathematical Formula:
VoVix Score = (ATR(fast) - ATR(slow)) / (StDev(ATR(fast)) + ε)
Where:
ATR(fast) is the Average True Range over a short period, representing current, immediate volatility.
ATR(slow) is the Average True Range over a longer period, representing the baseline or established volatility.
StDev(ATR(fast)) is the Standard Deviation of the fast ATR, which measures the "noisiness" or consistency of recent volatility.
ε (epsilon) is a very small number to prevent division by zero.
Market Implementation:
Positive Score (Expansion): When the fast ATR is significantly higher than the slow ATR, it indicates a rapid increase in volatility. The market is "stretching" or expanding.
Negative Score (Contraction): When the fast ATR falls below the slow ATR, it indicates a decrease in volatility. The market is "coiling" or contracting.
Normalization: By dividing by the standard deviation, we normalize the score. This turns it into a standardized measure, allowing us to compare volatility thrust across different market conditions and timeframes. A score of 2.0 in a quiet market means the same, relatively, as a score of 2.0 in a volatile market.
2. Deviation Analysis (DEV): Gauging Volatility's Own Volatility
The script then takes the analysis a step further. It calculates the standard deviation of the VoVix Score itself.
Mathematical Formula:
DEV = StDev(VoVix Score, lookback_period)
Market Implementation:
This DEV value represents the magnitude of chaos or stability in the market's volatility dynamics. A high DEV value means the volatility thrust is erratic and unpredictable. A low DEV value suggests the change in volatility is smooth and directional.
3. The DEVMA Crossover: Identifying Regime Shifts
This is the primary signal generator. We take two moving averages of the DEV value.
Mathematical Formula:
fastDEVMA = SMA(DEV, fast_period)
slowDEVMA = SMA(DEV, slow_period)
The Core Signal:
The strategy triggers on the crossover and crossunder of these two DEVMA lines. This is a profound concept: we are not looking at a moving average of price or even of volatility, but a moving average of the standard deviation of the normalized rate of change of volatility.
Bullish Crossover (fastDEVMA > slowDEVMA): This signals that the short-term measure of volatility's chaos is increasing relative to the long-term measure. This often precedes a significant market expansion and is interpreted as a bullish volatility regime.
Bearish Crossunder (fastDEVMA < slowDEVMA): This signals that the short-term measure of volatility's chaos is decreasing. The market is settling down or contracting, often leading to trending moves or range consolidation.
⚙️ INPUTS MENU: CONFIGURING YOUR ANALYSIS ENGINE
Every input has been meticulously designed to give you full control over the strategy's behavior. Understanding these settings is key to adapting VoVix+ to your specific instrument, timeframe, and trading style.
🌀 VoVix DEVMA Configuration
🧬 Deviation Lookback: This sets the lookback period for calculating the DEV value. It defines the window for measuring the stability of the VoVix Score. A shorter value makes the system highly reactive to recent changes in volatility's character, ideal for scalping. A longer value provides a smoother, more stable reading, better for identifying major, long-term regime shifts.
⚡ Fast VoVix Length: This is the lookback period for the fastDEVMA. It represents the short-term trend of volatility's chaos. A smaller number will result in a faster, more sensitive signal line that reacts quickly to market shifts.
🐌 Slow VoVix Length: This is the lookback period for the slowDEVMA. It represents the long-term, baseline trend of volatility's chaos. A larger number creates a more stable, slower-moving anchor against which the fast line is compared.
How to Optimize: The relationship between the Fast and Slow lengths is crucial. A wider gap (e.g., 20 and 60) will result in fewer, but potentially more significant, signals. A narrower gap (e.g., 25 and 40) will generate more frequent signals, suitable for more active trading styles.
🧠 Adaptive Intelligence
🧠 Enable Adaptive Features: When enabled, this activates the strategy's performance tracking module. The script will analyze the outcome of its last 50 trades to calculate a dynamic win rate.
⏰ Adaptive Time-Based Exit: If Enable Adaptive Features is on, this allows the strategy to adjust its Maximum Bars in Trade setting based on performance. It learns from the average duration of winning trades. If winning trades tend to be short, it may shorten the time exit to lock in profits. If winners tend to run, it will extend the time exit, allowing trades more room to develop. This helps prevent the strategy from cutting winning trades short or holding losing trades for too long.
⚡ Intelligent Execution
📊 Trade Quantity: A straightforward input that defines the number of contracts or shares for each trade. This is a fixed value for consistent position sizing.
🛡️ Smart Stop Loss: Enables the dynamic stop-loss mechanism.
🎯 Stop Loss ATR Multiplier: Determines the distance of the stop loss from the entry price, calculated as a multiple of the current 14-period ATR. A higher multiplier gives the trade more room to breathe but increases risk per trade. A lower multiplier creates a tighter stop, reducing risk but increasing the chance of being stopped out by normal market noise.
💰 Take Profit ATR Multiplier: Sets the take profit target, also as a multiple of the ATR. A common practice is to set this higher than the Stop Loss multiplier (e.g., a 2:1 or 3:1 reward-to-risk ratio).
🏃 Use Trailing Stop: This is a powerful feature for trend-following. When enabled, instead of a fixed stop loss, the stop will trail behind the price as the trade moves into profit, helping to lock in gains while letting winners run.
🎯 Trail Points & 📏 Trail Offset ATR Multipliers: These control the trailing stop's behavior. Trail Points defines how much profit is needed before the trail activates. Trail Offset defines how far the stop will trail behind the current price. Both are based on ATR, making them fully adaptive to market volatility.
⏰ Maximum Bars in Trade: This is a time-based stop. It forces an exit if a trade has been open for a specified number of bars, preventing positions from being held indefinitely in stagnant markets.
⏰ Session Management
These inputs allow you to confine the strategy's trading activity to specific market hours, which is crucial for day trading instruments that have defined high-volume sessions (e.g., stock market open).
🎨 Visual Effects & Dashboard
These toggles give you complete control over the on-chart visuals and the dashboard. You can disable any element to declutter your chart or focus only on the information that matters most to you.
📊 THE DASHBOARD: YOUR AT-A-GLANCE COMMAND CENTER
The dashboard centralizes all critical information into one compact, easy-to-read panel. It provides a real-time summary of the market state and strategy performance.
🎯 VOVIX ANALYSIS
Fast & Slow: Displays the current numerical values of the fastDEVMA and slowDEVMA. The color indicates their direction: green for rising, red for falling. This lets you see the underlying momentum of each line.
Regime: This is your most important environmental cue. It tells you the market's current state based on the DEVMA relationship. 🚀 EXPANSION (Green) signifies a bullish volatility regime where explosive moves are more likely. ⚛️ CONTRACTION (Purple) signifies a bearish volatility regime, where the market may be consolidating or entering a smoother trend.
Quality: Measures the strength of the last signal based on the magnitude of the DEVMA difference. An ELITE or STRONG signal indicates a high-conviction setup where the crossover had significant force.
PERFORMANCE
Win Rate & Trades: Displays the historical win rate of the strategy from the backtest, along with the total number of closed trades. This provides immediate feedback on the strategy's historical effectiveness on the current chart.
EXECUTION
Trade Qty: Shows your configured position size per trade.
Session: Indicates whether trading is currently OPEN (allowed) or CLOSED based on your session management settings.
POSITION
Position & PnL: Displays your current position (LONG, SHORT, or FLAT) and the real-time Profit or Loss of the open trade.
🧠 ADAPTIVE STATUS
Stop/Profit Mult: In this simplified version, these are placeholders. The primary adaptive feature currently modifies the time-based exit, which is reflected in how long trades are held on the chart.
🎨 THE VISUAL UNIVERSE: DECIPHERING MARKET GEOMETRY
The visuals are not mere decorations; they are geometric representations of the underlying mathematical concepts, designed to give you an intuitive feel for the market's state.
The Core Lines:
FastDEVMA (Green/Maroon Line): The primary signal line. Green when rising, indicating an increase in short-term volatility chaos. Maroon when falling.
SlowDEVMA (Aqua/Orange Line): The baseline. Aqua when rising, indicating a long-term increase in volatility chaos. Orange when falling.
🌊 Morphism Flow (Flowing Lines with Circles):
What it represents: This visualizes the momentum and strength of the fastDEVMA. The width and intensity of the "beam" are proportional to the signal strength.
Interpretation: A thick, steep, and vibrant flow indicates powerful, committed momentum in the current volatility regime. The floating '●' particles represent kinetic energy; more particles suggest stronger underlying force.
📐 Homotopy Paths (Layered Transparent Boxes):
What it represents: These layered boxes are centered between the two DEVMA lines. Their height is determined by the DEV value.
Interpretation: This visualizes the overall "volatility of volatility." Wider boxes indicate a chaotic, unpredictable market. Narrower boxes suggest a more stable, predictable environment.
🧠 Consciousness Field (The Grid):
What it represents: This grid provides a historical lookback at the DEV range.
Interpretation: It maps the recent "consciousness" or character of the market's volatility. A consistently wide grid suggests a prolonged period of chaos, while a narrowing grid can signal a transition to a more stable state.
📏 Functorial Levels (Projected Horizontal Lines):
What it represents: These lines extend from the current fastDEVMA and slowDEVMA values into the future.
Interpretation: Think of these as dynamic support and resistance levels for the volatility structure itself. A crossover becomes more significant if it breaks cleanly through a prior established level.
🌊 Flow Boxes (Spaced Out Boxes):
What it represents: These are compact visual footprints of the current regime, colored green for Expansion and red for Contraction.
Interpretation: They provide a quick, at-a-glance confirmation of the dominant volatility flow, reinforcing the background color.
Background Color:
This provides an immediate, unmistakable indication of the current volatility regime. Light Green for Expansion and Light Aqua/Blue for Contraction, allowing you to assess the market environment in a split second.
📊 BACKTESTING PERFORMANCE REVIEW & ANALYSIS
The following is a factual, transparent review of a backtest conducted using the strategy's default settings on a specific instrument and timeframe. This information is presented for educational purposes to demonstrate how the strategy's mechanics performed over a historical period. It is crucial to understand that these results are historical, apply only to the specific conditions of this test, and are not a guarantee or promise of future performance. Market conditions are dynamic and constantly change.
Test Parameters & Conditions
To ensure the backtest reflects a degree of real-world conditions, the following parameters were used. The goal is to provide a transparent baseline, not an over-optimized or unrealistic scenario.
Instrument: CME E-mini Nasdaq 100 Futures (NQ1!)
Timeframe: 5-Minute Chart
Backtesting Range: March 24, 2024, to July 09, 2024
Initial Capital: $100,000
Commission: $0.62 per contract (A realistic cost for futures trading).
Slippage: 3 ticks per trade (A conservative setting to account for potential price discrepancies between order placement and execution).
Trade Size: 1 contract per trade.
Performance Overview (Historical Data)
The test period generated 465 total trades , providing a statistically significant sample size for analysis, which is well above the recommended minimum of 100 trades for a strategy evaluation.
Profit Factor: The historical Profit Factor was 2.663 . This metric represents the gross profit divided by the gross loss. In this test, it indicates that for every dollar lost, $2.663 was gained.
Percent Profitable: Across all 465 trades, the strategy had a historical win rate of 84.09% . While a high figure, this is a historical artifact of this specific data set and settings, and should not be the sole basis for future expectations.
Risk & Trade Characteristics
Beyond the headline numbers, the following metrics provide deeper insight into the strategy's historical behavior.
Sortino Ratio (Downside Risk): The Sortino Ratio was 6.828 . Unlike the Sharpe Ratio, this metric only measures the volatility of negative returns. A higher value, such as this one, suggests that during this test period, the strategy was highly efficient at managing downside volatility and large losing trades relative to the profits it generated.
Average Trade Duration: A critical characteristic to understand is the strategy's holding period. With an average of only 2 bars per trade , this configuration operates as a very short-term, or scalping-style, system. Winning trades averaged 2 bars, while losing trades averaged 4 bars. This indicates the strategy's logic is designed to capture quick, high-probability moves and exit rapidly, either at a profit target or a stop loss.
Conclusion and Final Disclaimer
This backtest demonstrates one specific application of the VoVix+ framework. It highlights the strategy's behavior as a short-term system that, in this historical test on NQ1!, exhibited a high win rate and effective management of downside risk. Users are strongly encouraged to conduct their own backtests on different instruments, timeframes, and date ranges to understand how the strategy adapts to varying market structures. Past performance is not indicative of future results, and all trading involves significant risk.
🔧 THE DEVELOPMENT PHILOSOPHY: FROM VOLATILITY TO CLARITY
The journey to create VoVix+ began with a simple question: "What drives major market moves?" The answer is often not a change in price direction, but a fundamental shift in market volatility. Standard indicators are reactive to price. We wanted to create a system that was predictive of market state. VoVix+ was designed to go one level deeper—to analyze the behavior, character, and momentum of volatility itself.
The challenge was twofold. First, to create a robust mathematical model to quantify these abstract concepts. This led to the multi-layered analysis of ATR differentials and standard deviations. Second, to make this complex data intuitive and actionable. This drove the creation of the "Visual Universe," where abstract mathematical values are translated into geometric shapes, flows, and fields. The adaptive system was intentionally kept simple and transparent, focusing on a single, impactful parameter (time-based exits) to provide performance feedback without becoming an inscrutable "black box." The result is a tool that is both profoundly deep in its analysis and remarkably clear in its presentation.
⚠️ RISK DISCLAIMER AND BEST PRACTICES
VoVix+ is an advanced analytical tool, not a guarantee of future profits. All financial markets carry inherent risk. The backtesting results shown by the strategy are historical and do not guarantee future performance. This strategy incorporates realistic commission and slippage settings by default, but market conditions can vary. Always practice sound risk management, use position sizes appropriate for your account equity, and never risk more than you can afford to lose. It is recommended to use this strategy as part of a comprehensive trading plan. This was developed specifically for Futures
"The prevailing wisdom is that markets are always right. I take the opposite view. I assume that markets are always wrong. Even if my assumption is occasionally wrong, I use it as a working hypothesis."
— George Soros
— Dskyz, Trade with insight. Trade with anticipation.

Trend NavigatorThe Trend Navigator is a trend-following indicator designed to help traders identify and navigate major market trends. It is built for patient traders who prefer a data-driven approach, particularly on volatile assets like cryptocurrencies and stocks.
How It Works
This indicator is not a "black box." It identifies potential trend shifts by calculating dynamic support and resistance bands. The logic is based on a proprietary adaptive moving average pair with standard deviation bands to adapt to market volatility.
Bullish Trend Signal: When price breaks above the upper band, the bars turn GREEN, signaling a potential new uptrend.
Bearish Trend Signal: When price breaks below the lower band, the bars turn RED, signaling a potential new downtrend or an exit for long positions.
The indicator includes customizable inputs (Length and Multiplier) and configurable alerts for all signals. You can use it to auto-trade or for alerting you of trend changes. My suggestion is to use the fixed % of equity mode for position sizing, alongside with the long-only mode, without leverage, in the daily or weekly timeframe.
It can also operate long and short or with position sizing based on max risk at the strategy's stop, optionally. Refer to backtest data in your chosen markets, feel free to experiment to apply it in a way that suits you, and don't hesitate to ask questions.
Hypothetical Backtesting Performance
The published performance results are hypothetical and were achieved in a simulated environment. Past performance is not indicative of future results.
Asset: Ethereum (Kraken:ETHUSD)
Timeframe: Daily
Test Period: August 2015 - July 2025
Initial Capital: $1,000
Order Size: 90% of equity -keeping 10% in cash as a buffer-
Commission: 0.1%
Slippage: 2 ticks
Performance Metrics:
Win rate: 46%
Total Net Profit: over +1,900,000%
Total Closed Trades: 63
Sortino Ratio: 4.254
Max Drawdown: 42%
(These results were generated using the default indicator settings of Length: 20 and Multiplier:1, long only mode, fixed % of equity at 90% for sizing)
Who Is This For?
Trend and Swing Traders
Crypto & Stock Traders on daily or weekly charts
Investors who value a statistical, non-emotional approach
Risk Disclaimer
Trading involves substantial risk and is not suitable for all investors. The tool provided is for educational purposes only and should not be construed as investment advice. All trading decisions are your own. Hypothetical or simulated performance results have certain limitations and do not represent actual trading.
Cheers,
Ivan Labrie.

Dynamic Volume Flow by smaThe Dynamic Volume Flow (DVF) script blends a refined Volume Flow Indicator with adaptive Support & Resistance zones. It analyzes volume strength relative to price movement and dynamically adjusts key levels using pivot detection and percentile ranges.
Traders can choose between fixed or adaptive zones to better track potential breakout areas and trend shifts. Visual fills make important volume levels easy to interpret.
—
Note: The exact calculation method is proprietary and remains closed-source.

↕️ OSCILACIÓN + VOLATILIDAD % MTFOscillator.
It averages the price swing over a selected number of candles in the chosen timeframe, helping inform decisions for placing stop-loss levels or executing trade entries.

EdgeXplorer - Momentum EngineMomentum Engine by EdgeXplorer
Momentum Engine is a precision-driven oscillator and trend framework engineered to track market momentum with adaptive clarity. Unlike traditional momentum indicators, this engine blends ATR-based envelope logic, multi-mode oscillator scaling, and real-time directional overlays—all in one responsive system.
Designed for intraday traders and swing strategists alike, Momentum Engine offers a streamlined way to visualize momentum direction, impulse strength, and volatility-adaptive trend zones—with minimal noise and maximum context.
⸻
🔍 What Does Momentum Engine Do?
Momentum Engine visualizes market energy through a volatility-aware oscillator and accompanying trend overlays. It adapts dynamically to price behavior and enables traders to:
• Detect momentum waves with real-time visual cues
• Confirm directional bias using trend overlays and impulse zones
• Switch between Regular and Normalized oscillator modes
• See heatmap-based signal confirmation for crossovers
• View optional info panels, labels, and trend bar colors for clarity
It’s a compact yet powerful system built for discretionary and systematic use.
⸻
⚙️ How It Works – Technical Breakdown
1. Trend Envelope Logic
At its core, Momentum Engine constructs a price envelope using:
• The average of the highest closes and highs (Baseline Length)
• The average of the lowest closes and lows
• A multiplied ATR to scale the distance between upper and lower bounds
These bounds determine trend bias:
• Price above the short side of the channel → Bullish
• Price below the long side → Bearish
• In-between → Neutral
A dynamic midline tracks the central channel axis.
2. Oscillator Wave Calculation
The momentum oscillator reacts to price positioning relative to the envelope:
• In Regular Mode, it shows raw price deviation from the trend channel
• In Normalized Mode, it maps price movement into a 0–100 scale with historical scaling logic
Both modes use smoothing (Smoothing) to reduce noise.
3. Overlay Channel (Optional)
• Displays trend floors (bull) and ceilings (bear) on the price chart
• Color-coded trend shifts appear as pulse circles
• Optionally, bars themselves can be recolored for instant trend recognition
4. Heatmap Signal Zones
The background dynamically changes based on oscillator crossovers:
• Bullish signal → Yellow heatmap
• Bearish signal → Blue heatmap
These zones signal momentum ignition, especially helpful for early entries.
⸻
📈 What You See on the Chart
Element Meaning
Green Momentum Wave Bullish pressure (oscillator > midline or >50)
Red Momentum Wave Bearish pressure (oscillator < midline or <50)
Zero Line Base reference in Regular mode
Gray Guide Lines (Normalized) Bands for Overbought (85), Oversold (15), and Neutral (33–50)
Channel Lines Trend bias boundaries (bull/bear zones)
Pulse Marker (Circle) Trend direction change
Bar Colors (Optional) Bull or bear bar overlays for added clarity
Background Heatmap Bullish or bearish impulse confirmation
Info Table (Optional) Real-time trend and oscillator data panel
Debug Labels (Optional) Inline oscillator readings per bar
⸻
📊 Inputs & Settings
Engine Settings
Input Description
Timeframe Optional custom timeframe override
Baseline Length Determines envelope size (larger = smoother trend)
Multiplier Factor Controls ATR-based range expansion
Momentum Wave Settings
Input Description
Mode Regular = raw wave, Normalized = 0–100 scaling
Bull/Bear Colors Wave color customization
Line Width & Smoothing Visual clarity adjustments
Overlay Channel
Input Description
Show Overlay Toggle trend ceilings/floors on chart
Channel Colors Separate bull/bear lines
Trend Bar Color Recolors candle bodies based on trend bias
Signal Heatmap
Input Description
Enable Heatmap Background impulse shading toggle
Bull / Bear Colors Adjust visual tone of crossover zones
Add-ons
Input Description
Show Debug Labels View oscillator values at each bar
Show Info Panel Display current trend, oscillator value, and mode
⸻
🧠 How to Use Momentum Engine
Regular Mode
• Oscillator above 0 = Bullish bias
• Oscillator below 0 = Bearish bias
• Use zero line as your confirmation threshold
Normalized Mode
• 85 → Overbought / exhaustion
• <15 → Oversold / reversal watch
• Crossing 50 → Momentum ignition
• 33–50 → Neutral zone / ranging phase
Visual Interpretation Tips
• Green wave + yellow heatmap = Bull momentum confirmation
• Red wave + blue heatmap = Bear momentum confirmation
• Pulse marker = New trend — evaluate strength with wave slope
• Trend bar coloring = Scan trend alignment at a glance
⸻
🧪 Use Cases & Strategy Ideas
• ⚡ Scalping Impulse Moves
Use oscillator + heatmap crossover to catch directional bursts
• 🔁 Pullback Continuation
Wait for momentum to reset near neutral zone, then re-enter trend
• 📉 Reversal Triggers
Look for divergence or Normalized wave flipping at extremes
• 🎯 Multi-timeframe Confirmation
Set custom timeframe and layer on top of a higher or lower TF structure

GARCH Volatility [Trading Signals]This is a GARCH-like indicator rather than a full academic GARCH model
Current Strengths:
Current Strengths:
Captures core volatility clustering (alpha + beta)
Provides actionable signals
Lightweight for TradingView
When to Use This vs True GARCH:
Use This For: Real-time trading signals, visual market analysis
Use Full GARCH For: Risk modeling, quantitative research

Uber TTM Squeeze [UTS]📈 TTM Squeeze – Volatility-Adapted Breakout & Momentum Indicator
A precision volatility and momentum indicator inspired by John Carter’s original TTM Squeeze – now enhanced for modern, rules-based traders seeking breakout opportunities.
🔵 What Is “The Squeeze”?
The “squeeze” occurs when both the upper and lower Bollinger Bands contract and sit entirely within the Keltner Channel. This signals a period of low volatility—price action becomes range-bound and moves sideways, with no clear momentum in either direction.
During these low-volatility periods, it’s best to avoid trading, as entering positions in a choppy market can lead to getting eaten up by whipsaws and false signals. The TTM Squeeze helps you identify these quiet, uncertain phases so you can steer clear of unnecessary risk and wait for stronger opportunities.
When the squeeze ends (as indicated by a color change in the bars and a momentum flip in the histogram), volatility returns and the market is primed for a potential breakout—this is when you want to pay attention.
✅ What Makes This Version Unique?
• Integrates Bollinger Bands and Keltner Channel, adapting to current volatility using ATR and standard deviation
• Squeeze condition (“energy building”) is detected when Bollinger Bands contract inside the Keltner Channel
• Separately settable Moving Averages for both, the Bollinger Bands and the Keltner Channel
• Extreme fine tuning potential due to various settings
🔁 Trend-Split, Directional Histogram
• Green bars for rising momentum
• Bars only appear colored at true momentum change – no repainting or extra noise
• Green and gray bars highlight squeeze on/off status in real-time
🎛️ Customizable Moving Averages
• Choose from 26 MAs (SMA, EMA, SMMA, LWMA ... ) for the Keltner Channel and Bollinger Bands
• All key lengths and multipliers are adjustable for advanced tuning
• Volatility width adapts to ATR period and your chosen smoothing
The 26 high quality Moving averages to choose:
• "SMA", Simple Moving Average, R. H. Hooker, 1901
• "EMA", Exponential Moving Average, P. N. Haurlan, early 1960s
• "MDMA", McGinley Dynamic MA, John R. McGinley, 1990s
• "DSEMA", Double Smoothed EMA, William Blau, year unknown
• "DEMA", Double EMA, Patrick G. Mulloy, 1994
• "TEMA", Triple EMA, Patrick G. Mulloy, 1994
• "WMA", Weighted MA, Author and year unknown
• "PWMA", Parabolic Weighted MA, Author and year unknown
• "VWMA", Volume Weighted MA, Author and year unknown
• "HULL", Hull MA, Alan Hull, 2005, year unknown
• "TMA", Triangular MA, Author and year unknown
• "B2P", Two Pole Ehlers Butterworth, John F. Ehlers, 2004
• "S2P", Two Pole Ehlers Smoother, John F. Ehlers, year unknown
• "S3P", Three Pole Ehlers Smoother, John F. Ehlers, year unknown
• "SINE", Sine Weighted MA, Author and year unknown
• "LINREG", Linear Regression Value (LSMA), Author and year unknown
• "ILINREG", Integral of Linear Regression Slope, Author and year unknown
• "NLMA", Non Lag MA, Author and year unknown
• "ZLMA", Zero Lag MA, Author and year unknown
• "KIJUN", Kijun-Sen Ichimoku, Goichi Hosoda, late 1930s
• "SSM", Super Smoother, John F. Ehlers, year unknown
• "ALMA", Arnaud Legoux MA, Arnaud Legoux, year unknown
• "KAMA", Kaufman Adaptive MA, Perry J. Kaufman, 1998
• "FRAMA", Fractal MA, John F. Ehlers, year unknown
• "RMA", Running MA, J. Welles Wilder Jr., 1978
• "JMA", Jurik Moving Average, Mark Jurik, year unknown
🎯 Clean Signals, Fast Readability
• Only one trend arrow appears per momentum flip, removing ambiguity
• Semi-transparent fills reinforce directional moves for easy chart reading
• Suits both manual and algorithmic traders who want rapid volatility detection
🕰️ History & Context
Originally developed by John Carter, the TTM Squeeze is known for timing volatility breakouts. This version maintains the original squeeze logic but modernizes it for dynamic, rules-based trading—helping you catch the big moves as volatility transitions from quiet to explosive.
🔔 Alerts
Create alerts via the “Add Alert” dialog and select the appropriate signal.
• “Trade Signal” on crossover of the Bands above the Channel
• “No-Trade Signal” on Bollinger Band squeeze
• Supports “Once Per Bar Close” to avoid repainting
📝 About
• Pine Script®: v6
• Created: 2025-07-09
⚠️ Disclaimer
For educational purposes only. Not financial advice. Trading involves risk; apply sound risk management and backtest thoroughly before live trading.

AI Smart Liquidity Signal 🚀
The "AI Smart Liquidity Signal" indicator is an advanced technical analysis tool designed for traders on TradingView. It aims to identify high-probability trading opportunities by analyzing liquidity dynamics and integrating a comprehensive suite of intelligent filters. This indicator provides precise entry and exit signals, complete with defined take-profit and stop-loss levels, helping traders make informed decisions.
Key Features:
Advanced Liquidity Analysis: The indicator identifies and plots liquidity trendlines based on key pivot points (Pivot High/Low), revealing "liquidity breakouts" that often precede significant price movements. This analysis offers unique insights into hidden supply and demand zones in the market.
Comprehensive Signal Filtering System: To ensure the highest quality signals, the indicator incorporates a robust filtering system, including:
Trend Filters: General and Smart Trend analysis using Moving Averages (SMA, EMA) to determine market strength and direction.
Momentum and Volatility Filters: Utilizing indicators like RSI, MACD, and ATR to assess momentum and price volatility, helping to avoid false signals in choppy markets.
Candle Body Strength Filters: Evaluating the strength of candle bodies to confirm signal validity.
Support & Resistance Filters: Identifying dynamic and retested support and resistance zones, and filtering signals that might be trapped within these areas.
Higher Timeframe Filters: Ability to enable trend filters from higher timeframes (e.g., 30-minute, 1-hour, 4-hour) to ensure signal confluence with larger trends.
Session Filter: Trade only during specific market sessions (Asian, London, New York) to focus trading on the most active periods.
Integrated Risk Management: The indicator provides automatic Take Profit (TP1, TP2, TP3) and Stop Loss (SL) levels based on Average True Range (ATR), helping traders effectively manage their trades and set realistic targets.
Multi-Timeframe (MTF) Scanner: The indicator allows you to monitor buy and sell signals across multiple timeframes simultaneously (from 1-minute to 1-day), providing a holistic market view and helping to identify the best entry opportunities.
Customizable Alerts: Set up instant alerts for buy/sell signals, entry/exit levels, or when price touches support/resistance zones, to stay informed about trading opportunities without constant chart monitoring.
Clear Visual Representation: All signals, trendlines, take-profit/stop-loss levels, and support/resistance zones are clearly and intuitively displayed on the chart, facilitating visual analysis.
How It Works:
The indicator employs a sophisticated algorithm that combines liquidity analysis with signal confirmation through a customizable set of filters. It identifies potential reversal points in the market (pivot points) and draws liquidity trendlines that represent areas of price attraction or rejection. When these lines are broken, an initial signal is generated. This signal then passes through a series of filters (such as RSI, MACD, ATR, trend analysis, support and resistance) to enhance its accuracy and reduce false positives. The final signals are displayed with dynamically calculated take-profit and stop-loss levels.
Why Choose AI Smart Liquidity Signal?
Enhanced Accuracy: Thanks to its multi-layered filtering system, the indicator aims to provide more precise and reliable signals.
Effective Risk Management: Integrated take-profit and stop-loss levels help you protect your capital and maximize profitable trades.
Comprehensive Market View: The multi-timeframe scanner gives you a broad market perspective, helping you identify the strongest trends and opportunities.
User-Friendly: Despite its internal complexity, the indicator is designed to be user-friendly, with clear input options allowing you to customize it to fit your trading style.
Whether you are a novice or an experienced trader, the "AI Smart Liquidity Signal" indicator provides you with the necessary tools to enhance your trading strategy and improve your results.
