Adaptive Causal Wavelet Trend FilterThe Adaptive Causal Wavelet Trend Filter is a technical indicator implementing causal approximations of wavelet transform properties for better trend detection with adaptive volatility response.
The Adaptive Causal Wavelet Trend Filter (ACWTF) applies mathematical principles derived from wavelet analysis to financial time series, providing robust trend identification with minimal lag. Unlike conventional moving averages, it preserves significant price movements while filtering market noise through signal processing that i describe below.
I was inspired to build this indicator after reading " Wavelet-Based Trend Identification in Financial Time Series " by In, F., & Kim, S. 2013 and reading about Mexican Hat wavelet filters.
The ACWTF maintains optimal performance across varying market regimes without requiring parameter adjustments by adapting filter characteristics to current volatility conditions.
Mathematical Foundation
Inspired by the Mexican Hat wavelet (Ricker wavelet), this indicator implements causal approximations of wavelet filters optimized for real-time financial analysis. The multi-resolution approach identifies features at different scales and the adaptive component dynamically adjusts filtering characteristics based on local volatility measurements.
Key mathematical properties include:
Non-linear frequency response adaptation
Edge-preserving signal extraction
Scale-space analysis through dual filter implementation
Volatility-dependent coefficient adjustment, which I love
Filter Methods
Adaptive: Implements a volatility-weighted combination of multiple filter types to optimize the time-frequency resolution trade-off
Hull: Provides a causal approximation of wavelet edge detection properties with forward-projection characteristics
VWMA: Incorporates volume information into the filtering process for enhanced signal detection
EMA Cascade: Creates a multi-pole filter structure that approximates certain wavelet scaling properties
Suggestion: try all as they will provide slightly different signals. Try also different time-frames.
Practical Applications
Trend Direction Identification: Clear visual trend direction with reduced noise and lag
Regime Change Detection: Early identification of significant trend reversals
Market Condition Analysis: Integrated volatility metrics provide context for current market behavior
Multi-timeframe Confirmation: Alignment between primary and secondary filters offers additional confirmation
Entry/Exit Timing: Filter crossovers and trend changes provide potential trading signals
The comprehensive information panel provides:
Current filter method and trend state
Trend alignment between timeframes
Real-time volatility assessment
Price position relative to filter
Overall trading bias based on multiple factors
Implementation Notes
Log returns option provides improved statistical properties for financial time series
Primary and secondary filter lengths can be adjusted to optimize for specific instruments and timeframes
The indicator performs particularly well during trend transitions and regime changes
The indicator reduces the need for using additional indicators to check trend reversion
Volatility

Linearity IndexThe Linearity Index (LI) indicator helps traders identify trending and choppy markets by measuring price movement efficiency. It calculates LI using a user-defined lookback period (default: 61 days), dividing the net price change by the sum of absolute daily changes. LI ranges from -1 to 1:
Positive LI: Upward trend
Negative LI: Downward trend
Near 0: Choppy or flat market
Key FeaturesTable Display:
Summarizes data over three periods (1st Year, 2nd Year and 3rd Year)
Linear Days: LI > 0.2 (strong linearity)
Trend Days: Close > 50 SMA and LI > 0.05 (upward trend)
Linearity Index Ratio (LIR): Linear Days / Trend Days,
color-coded:Red (< 0.25)
Yellow (0.25–0.50)
Green (> 0.50)
Total LIR : average of every year's LIR and color coded based on overall LI color
View modes: Full (detailed), Compact (abbreviated), Mini (Yr & LIR only)
Visuals:Horizontal lines at 0.20 ("Linearity Level") and 0.05 ("Choppiness Level")
Background color: Green (LI > 0.2), Red (LI < 0.05)
LI plotted as a dark gray histogram
Customization:Adjustable lookback period
Selectable table view mode (Full, Compact, Mini)
Purpose : The LI indicator provides a quick way to assess market trends and linearity over time, with visual cues and a customizable table for deeper analysis. Ideal for traders seeking to gauge trend strength and market efficiency.
Took inspiration from @OmkarBanne 's Trend vs Chop Detector

FVG Candle TYHE42This indicator highlights potential Fair Value Gaps (FVGs) directly on the relevant candle by changing its body color.
The logic is simple yet effective:
A bullish FVG is detected when the current low is above the high from two candles back.
A bearish FVG is detected when the current high is below the low from two candles back.
When such a gap is detected, the previous candle is colored (default: yellow) to provide a clean, unobtrusive visual cue. This helps traders quickly identify price imbalances without cluttering the chart with shapes or labels.
Users can customize the highlight color from the settings to better suit their chart theme or personal preference.
This indicator is especially useful for traders using Smart Money Concepts (SMC), ICT, or other price imbalance-based strategies.

Smart Money Concepts smart money concept with high and low.new concept that will tell you about support and resistance also discount and premium zone's.

RSI- RSI 8 Level Indicator
- Finally, The Bullish and Bearish 8 Level Power Zone indicator with alerts on each level!
Customize the colors however you like and remember if you need to set alerts you can also do that in the alerts section of the indicator. Just make sure what level the alert is for, and always look out for regular divergence, hidden divergence, and exaggerated divergence using this indicator that goes along with the power zones. :)
- RSI Strategy
Trading Bullish & Bearish Power Zones using regular divergence, hidden divergence, and exaggerated divergence.
P.s.
90, 80, 50, 40 Bullish Power Zones in green
65, 55, 30, 20 Bearish Power Zones in red

Capital Risk OptimizerCapital Risk Optimizer 🛡️
The Capital Risk Optimizer is an educational tool designed to help traders study capital efficiency, risk management, and scaling strategies when using leverage.
This script calculates and visualizes essential metrics for managing leveraged positions, including:
Entry Price – The current market price.
Stop Loss Level – Automatically derived using the 30-bar lowest low minus 1 ATR (default: 14-period ATR), an approach designed to create a dynamic, volatility-adjusted stop loss.
Stop Loss Distance (%) – The percentage distance between entry and stop.
Maximum Safe Leverage – The highest leverage allowable without risking liquidation before your stop is reached.
Margin Required – The amount of collateral necessary to support the desired position size at the calculated leverage.
Position Size – The configurable notional value of your trade.
These outputs are presented in a clean, customizable table overlay so you can quickly understand how position sizing, volatility, and leverage interact.
By default, the script uses a 14-period ATR combined with the lowest low of the past 30 bars, providing an optimal balance between sensitivity and noise for defining stop placement. This methodology helps traders account for market volatility in a systematic way.
The Capital Risk Optimizer is particularly useful as a portfolio management tool, supporting traders who want to study how to scale into positions using risk-adjusted sizing and capital efficiency principles. It pairs best with backtested strategies, and does not directly produce signals of any kind.
How to Use:
Set your desired position size.
Adjust the ATR and lookback settings to fine-tune stop loss placement.
Study the resulting leverage and margin requirements in real time.
Use this information to simulate and visualize potential trade scenarios and capital allocation models.
Disclaimer:
This script is provided for educational and informational purposes only. It does not constitute financial advice and should not be relied upon for live trading decisions. Always do your own research and consult with a qualified professional before making any trading or investment decisions.

TX EM LevelsThis script is for beginner trader that need guide to gauge where to place their stop loss and take profit level in different trading style like swing trade, intraday or scalping. It is taking into consideration of market volatility in different product.
Created for TX student usage, kindly use this as a guide for your trade risk management.

Finance Nirvana Buy/Sell Signals Generator V1.0Finance Nirvana Buy Sell Indicator combines multiple layers of analysis into a single, streamlined overlay. It plots key trend and volatility structures—EMAs and Bollinger Bands—while computing a fast, zero-lag EMA (ZLEMA20) for more responsive trend detection. Extreme RSI and volume events are flagged directly on the chart, and classic two-bar price-action (Buy / Sell) signals are only triggered when confirmed by ATR-based volatility breakouts, ADX trend strength, dynamic RSI momentum filters, and volume confirmations. A multi-timeframe alignment table shows both “bullish vs. bearish” status and live RSI readings across 5m, 15m, 60m, 240m, and daily frames, and intraday pivot, support, and resistance levels are drawn for easy reference.

SessionStat+ [JJumbo]SessionStat+
The SessionStat+ indicator is a sophisticated and dynamic tool crafted for TradingView, designed to empower traders with precise, data-driven insights into price movements across customizable trading sessions and timeframes. Tailored for day traders, swing traders, and market analysts, this script generates critical pivot points—such as highs, lows, and projections—by analyzing historical price ranges, enabling traders to anticipate key support, resistance, and breakout levels with confidence. Whether you’re targeting the volatility of the New York session, tracking the daily range during Regular Trading Hours, or analyzing custom sessions like the Asia market, SessionStat+ delivers actionable intelligence to align with your trading strategy. Its intuitive interface, robust customization options, and rich visualizations make it an essential tool for navigating diverse markets, from stocks and forex to cryptocurrencies.
Key Features:
Customizable Sessions: Define up to four unique sessions with user-specified start/end times and timezone support .
Multiple Timeframes: Analyze 15-minute, 1-hour, 4-hour, daily, weekly, or custom sessions for versatility across asset classes.
Pivot Point Projections: Generates high, low, and extended projection levels based on average and median price ranges over a configurable lookback period.
Advanced Visualizations: Plots levels as lines with optional boxes, midpoint lines, and customizable labels displaying price values and session identifiers.
Dynamic Statistics Table: Displays real-time metrics, including average expansion, distribution, and minum average ranges, for each active session or timeframe.
Flexible Extension Options: Choose to extend levels until the session ends or to the end of the trading day (6:00 PM in the selected timezone).
Robust Customization: Adjust line styles (solid, dashed, dotted), colors, label sizes, and toggle features like boxes, projections, and manipulation levels.
Historical Data Analysis: Leverages past session data to project reliable levels, ideal for both real-time trading and backtesting strategies.
Market Adaptability: Suitable for stocks, forex, cryptocurrencies, with support for historical data analysis during market closures.

AMV Impulse AssistantThe AMV Impulse Assistant is a custom momentum tool designed to assess how aggressively price is moving relative to recent volatility. It combines Bollinger-based range analysis and fast-moving average behavior to generate a dynamic impulse score. This score helps identify when price action is potentially overextended or showing signs of unusual momentum — useful for pullback traders, breakout traders, and anyone managing entries during trending conditions.
What it does:
Tracks the relationship between a short WMA and Bollinger basis to gauge directional strength.
Measures price movement compression/expansion with a normalized Bollinger Width Percentile.
Combines both into a smoothed Impulse Score (from -10 to +10) that reflects how aggressively price is pushing in either direction.
Colors the score line and highlights background zones when momentum enters extreme ranges.
📈 Use case:
This tool is especially effective for day traders who need to quickly identify when price is moving abnormally fast — either as an exhaustion signal or confirmation of an aggressive continuation. It can be used to:
Confirm the end of a pullback.
Spot overly aggressive moves that may revert.
Avoid entries during neutral chop or volatility compression.
It is best used alongside your primary trend filters and execution tools as a supplementary confirmation.

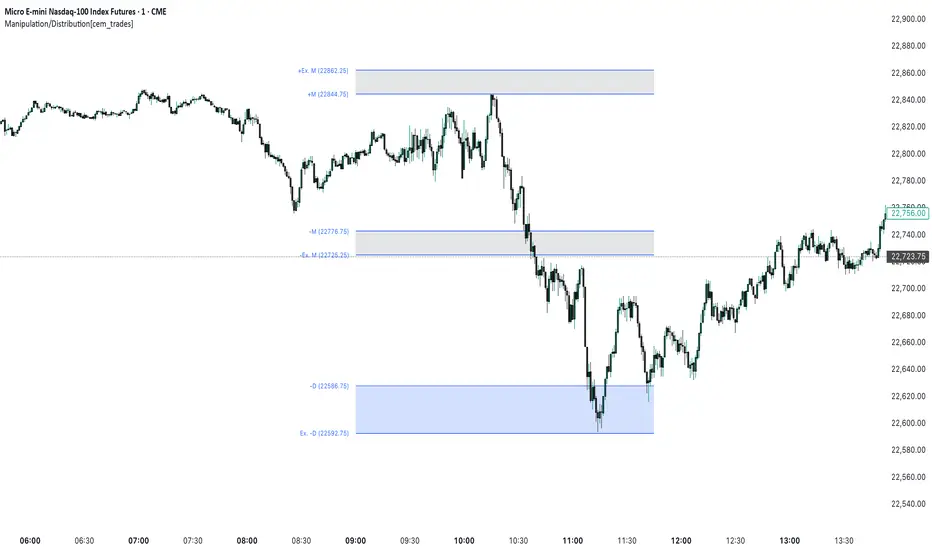
Manipulation/Distribution[cem_trades]This indicator marks four key zones on the chart based on statistical analysis of recent price behavior and volatility structure:
Bearish Manipulation Zone (-M to -Ex. M)
Bullish Distribution Zone (+D to +Ex. D)
Bullish Manipulation Zone (+M to +Ex. M)
Bearish Distribution Zone (-D to -Ex. D)
The manipulation zones (M) are located closer to the current price and represent areas where stop hunts or false breakouts are statistically more likely. If price enters and reacts within one of these zones, the opposite distribution zone (D) becomes a potential target.
The Extended (Ex.) levels visualize the wider boundary for each zone based on historical expansion data, helping traders frame directional bias and risk levels.
This indicator is particularly useful for:
Detecting possible liquidity grabs
Anticipating reversals or continuations after manipulation
Structuring trades with defined invalidation and target zones
Note: This invite-only script uses a proprietary model for dynamic zone placement and boundary extension logic that is not found in open-source scripts.
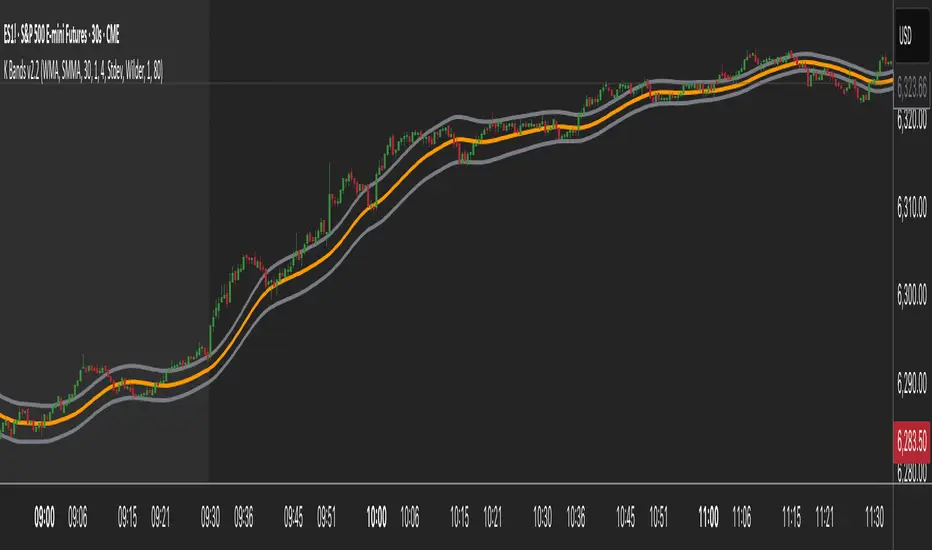
K Bands v2.2K Bands v2 - Settings Breakdown (Timeframe Agnostic)
K Bands v2 is an adaptive volatility envelope tool designed for flexibility across different trading
styles and timeframes.
The settings below allow complete control over how the bands are constructed, smoothed, and how
they respond to market volatility.
1. Upstream MA Type
Controls the core smoothing applied to price before calculating the bands.
Options:
- EMA: Fast, responsive, reacts quickly to price changes.
- SMA: Classic moving average, slower but provides stability.
- Hull: Ultra smooth, reduces noise significantly but may react differently to choppy conditions.
- GeoMean: Geometric mean smoothing, creates a unique, slightly smoother line.
- SMMA: Wilder-style smoothing, balances noise reduction and responsiveness.
- WMA: Weighted Moving Average, emphasizes recent price action for sharper responsiveness.
2. Smoothing Length
Lookback period for the upstream moving average.
- Lower values: Faster reaction, captures short-term shifts.
- Higher values: Smoother trend depiction, filters out noise.
3. Multiplier
Determines the width of the bands relative to calculated volatility.
- Lower multiplier: Tighter bands, more signals, but increased false breakouts.
- Higher multiplier: Wider bands, fewer false signals, more conservative.
4. Downstream MA Type
Applies final smoothing to the band plots after initial calculation.
Same options as Upstream MA.
5. Downstream Smoothing Length
Lookback period for downstream smoothing.
- Lower: More responsive bands.
- Higher: Smoother, visually cleaner bands.
6. Band Width Source
Selects the method used to calculate band width based on market volatility.
Options:
- ATR (Average True Range): Smooth, stable bands based on price range expansion.
- Stdev (Standard Deviation): More reactive bands highlighting short-term volatility spikes.
7. ATR Smoothing Type
Controls how the ATR or Stdev value is smoothed before applying to band width.
Options:
- Wilder: Classic, stable smoothing.
- SMA: Simple moving average smoothing.
- EMA: Faster, more reactive smoothing.
- Hull: Ultra-smooth, noise-reducing smoothing.
- GeoMean: Geometric mean smoothing.
8. ATR Length
Lookback period for smoothing the volatility measurement (ATR or Stdev).
- Lower: More reactive bands, captures quick shifts.
- Higher: Smoother, more stable bands.
9. Dynamic Multiplier Based on Volatility
Allows the band multiplier to adapt automatically to changes in market volatility.
- ON: Bands expand during high volatility and contract during low volatility.
- OFF: Bands remain fixed based on the set multiplier.
10. Dynamic Multiplier Sensitivity
Controls how aggressively the dynamic multiplier responds to volatility changes.
- Lower values: Subtle adjustments.
- Higher values: More aggressive band expansion/contraction.
K Bands v2 is designed to be adaptable across any market or timeframe, helping visualize price
structure, trend, and volatility behavior.
Supertrend AT v1.0📌 Supertrend AT v1.0 — Strategy Overview
Overview
Supertrend AT v1.0 is a fully automated trading strategy based on the Supertrend indicator.
It identifies trend reversals and places long or short entries accordingly, with built-in position sizing, stop-loss/take-profit management, and commission-aware calculations.
🚀 Key Features
✅ Entry Signals Based on Trend Reversals
Long entry when Supertrend changes from downtrend to uptrend
Short entry when Supertrend changes from uptrend to downtrend
✅ Risk-Based Position Sizing
Calculates position size so that a stop-loss only risks a fixed percentage (RPT) of total capital
✅ Reward/Risk Ratio-Based Target Price Calculation
Take-profit price is computed not by price difference, but by actual loss and desired reward-to-risk (RR) ratio
✅ Fully Commission-Aware
Commission is factored into entry, stop-loss, and take-profit price calculations
Ensure commission settings match in both the input panel and the strategy properties tab
✅ Dual Language Support
Switch between English and Korean interface
✅ Visual Trade Levels & Info Display
Entry, stop, and target prices plotted on the chart
Real-time open PnL and equity shown in an on-screen table
⚙️ How to Use
Apply Strategy to Chart
Load the strategy and configure the following parameters in both the Input tab and the Properties tab:
Commission rate (e.g., 0.05%)
Market decimal precision (e.g., 4 for 0.0001)
Adjust Entry Parameters
RPT: Risk per trade as a percentage of your total equity (e.g., 2%)
RR: Reward-to-risk ratio (e.g., 3 = target profit is 3× the potential loss)
Choose whether to allow Long or Short trades
For Auto-Trading Integration
Make sure the minimum order size is valid for your exchange
If the calculated quantity is below the exchange's minimum unit, it may result in errors
⚠️ Important Notes
❗ Non-Repainting — Supertrend is based on confirmed candles and does not repaint
❗ Backtest-Only — The strategy is for signal generation only and does not execute real trades without external automation
❗ Margin-Based Calculations — Default settings assume margin trading; adjust accordingly
📄 License & Disclaimer
This strategy is licensed under the Mozilla Public License 2.0.
This script is not financial advice. Use at your own risk.
Always test thoroughly with backtesting and paper trading before using in live markets.

Kelly Optimal Leverage IndicatorThe Kelly Optimal Leverage Indicator mathematically applies Kelly Criterion to determine optimal position sizing based on market conditions.
This indicator helps traders answer the critical question: "How much capital should I allocate to this trade?"
Note that "optimal position sizing" does not equal the position sizing that you should have. The Optima position sizing given by the indicator is based on historical data and cannot predict a crash, in which case, high leverage could be devastating.
Originally developed for gambling scenarios with known probabilities, the Kelly formula has been adapted here for financial markets to dynamically calculate the optimal leverage ratio that maximizes long-term capital growth while managing risk.
Key Features
Kelly Position Sizing: Uses historical returns and volatility to calculate mathematically optimal position sizes
Multiple Risk Profiles: Displays Full Kelly (aggressive), 3/4 Kelly (moderate), 1/2 Kelly (conservative), and 1/4 Kelly (very conservative) leverage levels
Volatility Adjustment: Automatically recommends appropriate Kelly fraction based on current market volatility
Return Smoothing: Option to use log returns and smoothed calculations for more stable signals
Comprehensive Table: Displays key metrics including annualized return, volatility, and recommended exposure levels
How to Use
Interpret the Lines: Each colored line represents a different Kelly fraction (risk tolerance level). When above zero, positive exposure is suggested; when below zero, reduce exposure. Note that this is based on historical returns. I personally like to increase my exposure during market downturns, but this is hard to illustrate in the indicator.
Monitor the Table: The information panel provides precise leverage recommendations and exposure guidance based on current market conditions.
Follow Recommended Position: Use the "Recommended Position" guidance in the table to determine appropriate exposure level.
Select Your Risk Profile: Conservative traders should follow the Half Kelly or Quarter Kelly lines, while more aggressive traders might consider the Three-Quarter or Full Kelly lines.
Adjust with Volatility: During high volatility periods, consider using more conservative Kelly fractions as recommended by the indicator.
Mathematical Foundation
The indicator calculates the optimal leverage (f*) using the formula:
f* = μ/σ²
Where:
μ is the annualized expected return
σ² is the annualized variance of returns
This approach balances potential gains against risk of ruin, offering a scientific framework for position sizing that maximizes long-term growth rate.
Notes
The Full Kelly is theoretically optimal for maximizing long-term growth but can experience significant drawdowns. You should almost never use full kelly.
Most practitioners use fractional Kelly strategies (1/2 or 1/4 Kelly) to reduce volatility while capturing most of the growth benefits
This indicator works best on daily timeframes but can be applied to any timeframe
Negative Kelly values suggest reducing or eliminating market exposure
The indicator should be used as part of a complete trading system, not in isolation
Enjoy the indicator! :)
P.S. If you are really geeky about the Kelly Criterion, I recommend the book The Kelly Capital Growth Investment Criterion by Edward O. Thorp and others.

Market Strength Meter 📊 by sma**Market Strength Meter 📊 by sma** is a comprehensive strength dashboard that combines volume dynamics, price momentum, and trend alignment into one easy-to-read visual tool.
Key metrics include:
- Volume relative to average (threshold-based)
- Volume momentum trend
- Price alignment with EMA-based trend
- Market context scoring (Favorable / Neutral / Contrary)
- Real-time buy/sell signal suggestion based on multi-factor confluence
The built-in table updates dynamically and shows:
- Volume strength (weak/moderate/strong)
- Trend direction and strength
- Signal quality (Buy / Sell / Wait)
- Volatility context and EMA distance
It’s designed to support intraday and swing traders who seek a quick but solid view of market conditions without cluttering the chart.
Includes customizable alerts for:
- Confirmed bullish/bearish entries
- Counter-trend volume spikes
- Explosive volume (>200%)
Market Strength Meter es un tablero de fuerza del mercado que analiza volumen, momentum y contexto de tendencia para ofrecer señales claras. Ideal para traders que buscan confluencia de factores y confirmaciones objetivas.


ATR Trend ProDual EMA filter (50 & 200) to identify trend direction and structure
Buy/Sell signals triggered when price breaks out with confirmation
Auto SL/TP projection using recent swing high/low levels
🧠 How to Use:
Look for BUY signals above both EMAs in uptrends
Watch for SELL signals below EMAs in downtrends
Use projected SL/TP levels as trade management zones
Ideal on 5mn time frame and combine with support/resistance or price action for better results

EMA PRO by smaEMA PRO by sma is a multi-factor adaptive trend indicator designed to enhance classic exponential moving averages (EMAs) by dynamically adjusting their sensitivity based on market conditions such as volatility, volume, momentum, and noise filtering.
This tool helps traders visualize trend direction, strength, and potential continuation zones, as well as optional signals and divergence alerts. It includes adaptive logic to provide a smoother, more reactive response to real-time market shifts.
Ideal for intraday and swing traders looking to integrate intelligent EMAs into their decision-making. It offers optional visual elements such as trend zones, buy/sell signals, divergence highlights, and alert conditions.
All calculations are internal and not visible in the public code.
ESPAÑOL:
EMA PRO by sma es un indicador de tendencia adaptativa que mejora las EMAs clásicas con lógica avanzada basada en volatilidad, volumen, momentum y filtros. Permite visualizar señales, zonas de continuación y alertas de divergencia, sin revelar el funcionamiento interno del algoritmo.

THE HISTORY By [VXN]
THE HISTORY By - Monthly Seasonal Analysis Indicator
Development Status: This indicator is currently in the development phase and is not yet finished. Features and functionality may change as development continues.
Overview:
This indicator provides comprehensive historical analysis of monthly price patterns, designed to help traders identify recurring seasonal behaviors and market tendencies for the current month across multiple years of data.
Key Features:
Historical Data Analysis:
- Analyzes up to 10 years of historical performance for the current month
- Calculates monthly returns, win rates, and statistical metrics
- Tracks maximum drawdowns and runups for risk assessment
- Requires daily timeframe for accurate monthly calculations
Pattern Recognition:
- Implements a three-period classification system that breaks each month into segments
- Uses visual indicators (🟢🔴🟡) to represent bullish, bearish, and neutral periods
- Helps identify recurring intra-month behavior patterns
Statistical Display:
- Presents historical data in an organized table format
- Shows year-by-year performance comparisons
- Calculates average returns, best/worst performance, and confidence levels
- Displays overall market bias (bullish/bearish tendency) for the current month
Dynamic Zone Overlays:
- Projects Fibonacci-based support/resistance levels based on historical volatility
- Adjusts zone positioning based on the month's historical bias
- Provides visual reference points for potential price targets or reversal areas
Practical Applications:
- Seasonal trading strategy development
- Risk management through historical context
- Understanding market cyclicality and recurring patterns
- Educational tool for studying price behavior over time
Note: This indicator is designed for analysis and education purposes, helping traders understand historical market patterns rather than providing direct trading signals. The data should be used in conjunction with other forms of analysis and proper risk management. As this is still under development, please expect updates and refinements to functionality.

EVaR Indicator and Position SizingThe Problem:
Financial markets consistently show "fat-tailed" distributions where extreme events occur with higher frequency than predicted by normal distributions (Gaussian or even log-normal). These fat tails manifest in sudden price crashes, volatility spikes, and black swan events that traditional risk measures like volatility can underestimate. Standard deviation and conventional VaR calculations assume normally distributed returns, leaving traders vulnerable to severe drawdowns during market stress.
Cryptocurrencies and volatile instruments display particularly pronounced fat-tailed behavior, with extreme moves occurring 5-10 times more frequently than normal distribution models would predict. This reality demands a more sophisticated approach to risk measurement and position sizing.
The Solution: Entropic Value at Risk (EVAR)
EVaR addresses these limitations by incorporating principles from statistical mechanics and information theory through Tsallis entropy. This advanced approach captures the non-linear dependencies and power-law distributions characteristic of real financial markets.
Entropy is more adaptive than standard deviations and volatility measures.
I was inspired to create this indicator after reading the paper " The End of Mean-Variance? Tsallis Entropy Revolutionises Portfolio Optimisation in Cryptocurrencies " by by Sana Gaied Chortane and Kamel Naoui.
Key advantages of EVAR over traditional risk measures:
Superior tail risk capture: More accurately quantifies the probability of extreme market moves
Adaptability to market regimes: Self-calibrates to changing volatility environments
Non-parametric flexibility: Makes less assumptions about the underlying return distribution
Forward-looking risk assessment: Better anticipates potential market changes (just look at the charts :)
Mathematically, EVAR is defined as:
EVAR_α(X) = inf_{z>0} {z * log(1/α * M_X(1/z))}
Where the moment-generating function is calculated using q-exponentials rather than conventional exponentials, allowing precise modeling of fat-tailed behavior.
Technical Implementation
This indicator implements EVAR through a q-exponential approach from Tsallis statistics:
Returns Calculation: Price returns are calculated over the lookback period
Moment Generating Function: Approximated using q-exponentials to account for fat tails
EVAR Computation: Derived from the MGF and confidence parameter
Normalization: Scaled to for intuitive visualization
Position Sizing: Inversely modulated based on normalized EVAR
The q-parameter controls tail sensitivity—higher values (1.5-2.0) increase the weighting of extreme events in the calculation, making the model more conservative during potentially turbulent conditions.
Indicator Components
1. EVAR Risk Visualization
Dynamic EVAR Plot: Color-coded from red to green normalized risk measurement (0-1)
Risk Thresholds: Reference lines at 0.3, 0.5, and 0.7 delineating risk zones
2. Position Sizing Matrix
Risk Assessment: Current risk level and raw EVAR value
Position Recommendations: Percentage allocation, dollar value, and quantity
Stop Parameters: Mathematically derived stop price with percentage distance
Drawdown Projection: Maximum theoretical loss if stop is triggered
Interpretation and Application
The normalized EVAR reading provides a probabilistic risk assessment:
< 0.3: Low risk environment with minimal tail concerns
0.3-0.5: Moderate risk with standard tail behavior
0.5-0.7: Elevated risk with increased probability of significant moves
> 0.7: High risk environment with substantial tail risk present
Position sizing is automatically calculated using an inverse relationship to EVAR, contracting during high-risk periods and expanding during low-risk conditions. This is a counter-cyclical approach that ensures consistent risk exposure across varying market regimes, especially when the market is hyped or overheated.
Parameter Optimization
For optimal risk assessment across market conditions:
Lookback Period: Determines the historical window for risk calculation
Q Parameter: Controls tail sensitivity (higher values increase conservatism)
Confidence Level: Sets the statistical threshold for risk assessment
For cryptocurrencies and highly volatile instruments, a q-parameter between 1.5-2.0 typically provides the most accurate risk assessment because it helps capturing the fat-tailed behavior characteristic of these markets. You can also increase the q-parameter for more conservative approaches.
Practical Applications
Adaptive Risk Management: Quantify and respond to changing tail risk conditions
Volatility-Normalized Positioning: Maintain consistent exposure across market regimes
Black Swan Detection: Early identification of potential extreme market conditions
Portfolio Construction: Apply consistent risk-based sizing across diverse instruments
This indicator is my own approach to entropy-based risk measures as an alterative to volatility and standard deviations and it helps with fat-tailed markets.
Enjoy!

VDN1 - T3 Tilson + IFT + ATRThis strategy combines three powerful indicators to create a high-quality and low-noise trading system:
🔹 T3 Tilson: Serves as the main trend indicator. It reacts smoothly to market direction changes while reducing noise.
🔹 Inverse Fisher Transform of RSI: A momentum filter that sharpens the signal precision. Only trades in the direction of positive or negative momentum.
🔹 ATR Filter: Avoids entries during low volatility (sideways) periods. Ensures the market is active enough before executing trades.
Core Logic:
* Long Entry: T3 Tilson rising + IFT(RSI) > 0 + ATR > threshold
* Short Entry: T3 Tilson falling + IFT(RSI) < 0 + ATR > threshold
* All trades use a fixed size of 1 unit for consistent risk evaluation.
Performance Notes:
* Works exceptionally well on index futures (e.g., NAS100, US30, GER40)
* Shows low drawdown and high profit factor (PF > 3) on those assets
* Also performs decently on XAUUSD, even with only \~32% win rate — thanks to favorable risk/reward
* BTC and ETH may require modified versions due to higher volatility and whipsaws
This is a master version — clean, unoptimized, and stable.
Use this as a core engine to build and test enhanced versions (e.g., with TP/SL, dynamic filters, etc.)
Happy testing and trading!

H BollingerBollinger Bands are a widely used technical analysis indicator that helps spot relative price highs and lows. The tool comprises three lines: a central band representing the 20-period simple moving average (SMA), and upper and lower bands usually placed two standard deviations above and below the SMA. These bands adjust with market volatility, offering insights into price fluctuations and trading conditions.
How this indicator works
Bollinger Bands helps traders assess price volatility and potential price reversals. They consist of three bands: the middle band, the upper band, and the lower band. Here's how Bollinger Bands work:
Middle band: This is typically a simple moving average (SMA) of the asset's price over a specified period. The most common period used is 20 days.
Upper band: This is calculated by adding a specified number of standard deviations to the middle band. The standard deviation measures the asset's price volatility. Commonly, two standard deviations are added to the middle band.
Lower band: Similar to the upper band, it is calculated by subtracting a specified number of standard deviations from the middle band.
What do Bollinger Bands tell you?
Bollinger bands primarily indicate the level of market volatility and trading opportunities. Narrow bands indicate low market volatility, while wide bands suggest high market volatility. Bollinger bands indicators can be used by traders to assess potential buy or sell signals. For instance, a sell signal may be interpreted or generated if the asset’s price moves closer or crosses the upper band, as it may indicate that the asset is overbought. Alternatively, a buy signal may be interpreted or generated if the price moves closer to the lower band, as it may signify that the asset is oversold.
However, traders should be cautious when using Bollinger Bands as standalone indicators when making trading decisions. Experienced traders refrain from confirming signals based on one indicator. Instead, they generally combine various technical indicators and fundamental analysis methods to make informed trading decisions. Basing trading decisions on only one indicator can result in misinterpretation of signals and heavy losses.
Bollinger Bands assist in identifying whether prices are relatively high or low. They are applied as a pair—upper and lower bands—alongside a moving average. However, these bands are not designed to be used in isolation. Instead, they should be used to validate signals generated by other technical indicators.
Calculation of Bollinger Band

Fear and Greed Index [DunesIsland]The Fear and Greed Index is a sentiment indicator designed to measure the emotions driving the stock market, specifically investor fear and greed. Fear represents pessimism and caution, while greed reflects optimism and risk-taking. This indicator aggregates multiple market metrics to provide a comprehensive view of market sentiment, helping traders and investors gauge whether the market is overly fearful or excessively greedy.How It WorksThe Fear and Greed Index is calculated using four key market indicators, each capturing a different aspect of market sentiment:
Market Momentum (30% weight)
Measures how the S&P 500 (SPX) is performing relative to its 125-day simple moving average (SMA).
A higher value indicates that the market is trading well above its moving average, signaling greed.
Stock Price Strength (20% weight)
Calculates the net number of stocks hitting 52-week highs minus those hitting 52-week lows on the NYSE.
A greater number of net highs suggests strong market breadth and greed.
Put/Call Options (30% weight)
Uses the 5-day average of the put/call ratio.
A lower ratio (more call options being bought) indicates greed, as investors are betting on rising prices.
Market Volatility (20% weight)
Utilizes the VIX index, which measures market volatility.
Lower volatility is associated with greed, as investors are less fearful of large market swings.
Each component is normalized using a z-score over a 252-day lookback period (approximately one trading year) and scaled to a range of 0 to 100. The final Fear and Greed Index is a weighted average of these four components, with the weights specified above.Key FeaturesIndex Range: The index value ranges from 0 to 100:
0–25: Extreme Fear (red)
25–50: Fear (orange)
50–75: Neutral (yellow)
75–100: Greed (green)
Dynamic Plot Color: The plot line changes color based on the index value, visually indicating the current sentiment zone.
Reference Lines: Horizontal lines are plotted at 0, 25, 50, 75, and 100 to represent the different sentiment levels: Extreme Fear, Fear, Neutral, Greed, and Extreme Greed.
How to Interpret
Low Values (0–25): Indicate extreme fear, which may suggest that the market is oversold and could be due for a rebound.
High Values (75–100): Indicate greed, which may signal that the market is overbought and could be at risk of a correction.
Neutral Range (25–75): Suggests a balanced market sentiment, neither overly fearful nor greedy.
This indicator is a valuable tool for contrarian investors, as extreme readings often precede market reversals. However, it should be used in conjunction with other technical and fundamental analysis tools for a well-rounded view of the market.
