Support/Resistance Short StrategyChart TF: 4H
Indicators: 14 EMA, 40 EMA, Vortex Indicator 30, RSI 22, TRIX 10
I have been tweaking this simple, yet profitable, system for a few weeks and wanted to share it with the public to receive feedback/opinions.
Short Entry Conditions:
1) 40 EMA > 14 EMA.
2) A bearish candle must break below a support level.
3) The price must be under both EMAs.
4) VI(-) > VI(+) by at least .15
5) RSI < 50
6) TRIX < 0
If all conditions are met, enter short.
Stop Loss:
1) Set SL to the closest resistance.
Take Profit:
1) Set TP 1:1 R/R with the stop loss.
In this recent 28 day stretch, 02/19/20 - 03/18/20, this strategy gave 5 successful short entries and over 300 pips on NZDCHF.
M-oscillator

EURJPY 1 Hr MACD histogram positive divergence key ingredientIn this example there I have pointed out 2 MACD histogram positive divs.
Can you spot a key difference?
If using divergences, it is not a bad idea to utilize your volume. Notice the increase in demand, into new low ground, with the accommodating MACD positive divergence (example to the right).
Although there is a positive divergence (to the left of the chart) notice how the increase in demand is not as high. A counter trend situation did occur, but was rapidly met with enough supply to cancel the mark-up attempt (upthrust on high volume).
MACD histogram may be another useful confirmation tool. Not only for divergences, but it can also help one to identify accumulation and distribution areas above or below zero line ( for another time).
Hope this helps.
Practice*
Coinbook - VI+/VI-, MACD(5,15,9), & 20/9EMAYou can subscribe to this strategy or have it built into a trading bot at coinbook.com
If you have a good idea we will backtest your trading idea for free at coinbook.com

S&P 500 😷 Coronavirus Panic Selling, but should you worry? 😱🚨PANIC SELLING of stocks due to Coronavirus...😷 in fear that earnings for top companies will drop as productivity comes to a halt. 😩
⚠️ Historically, the SARS outbreak did not cause the stock market to dump farther as we were in the tail end of the Recession.
Coronavirus appears to be coincidentally at the top of a market rally and is just a social trigger to inspire fear, uncertainty, and doubt. FUD 😱
This will allow institutional players to take your money and buy back at cheaper prices. 👿
(The 200 Week Moving Average.)
Ask yourself this... 🤔 because of Coronavirus will you stop logging onto Facebook, will you discard your Apple Macbook, will you stop buying goods from Amazon, will you stop watching Netflix, will your office stop using Microsoft Office?
If the answer is no... DO NOT PANIC SELL your retirement account, please. 🙅♀️
Since 1977, which direction is the stock market moving?
Answer: Up.
☝️☝️☝️
RSI Bearish Divergence playing out:
(Indicator below the chart with squiggly blue lines)
Price makes higher tops, while magnitude of price (RSI) makes lower tops. Warren Buffet and Jeff Bezos already sold their stocks for cash.
No one cares until now... Who do you think will buy the stocks you are panic selling?

Introduction to the BEST All-In-One Oscillators with divergencesHello traders,
A unique indicator displaying many oscillators with a multi-timeframes and regular/hidden divergences options for all oscillators below
1. MACD
2. MACD ZERO LAG
3. RSI
4. DMI/ADX
5. ATR
6. STOCHASTIC RSI
7. TRUE STRENGTH INDEX
8. CANDLE MOMENTUM OSCILLATOR
9. VORTEX INDICATOR
10. COMMODITY CHANNEL INDEX
11. RATE OF CHANGE
☔ Safe crossing mode for RSI/STOCH RSI/CMO: Choose to get alerted whenever the oscillator enters or exits the Overbought/Oversold zone.
Wishing you all the BEST for your trading using it.
Dave

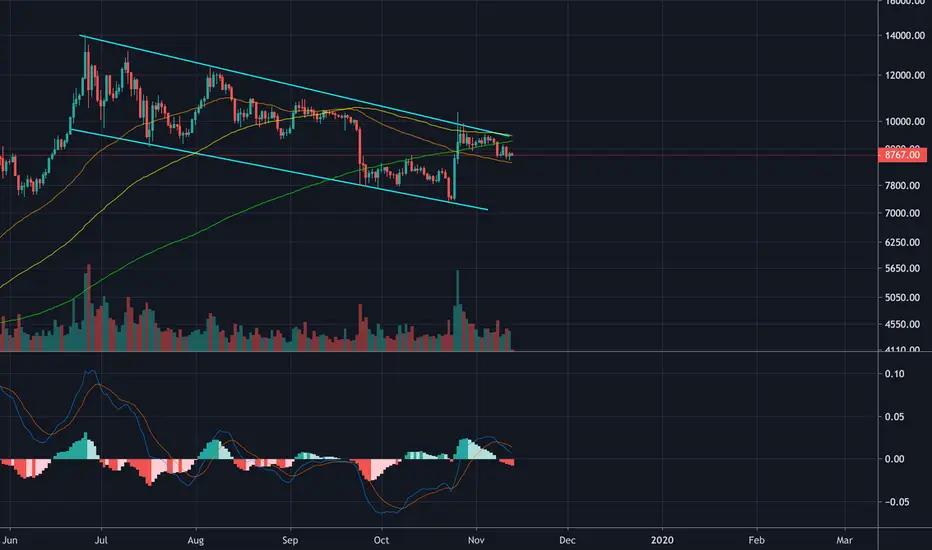
Bitcoin : Bullish momentum is diminishingHello All, here I show you the details about bitcoin. Let's get started!
We have seen a huge push to the upside for the price and it's now entering the huge area of resistance too. In this chart work, I will give a highlight especially on the oscillator indicator that usually has a very important roles on my trading strategy.
Based on the RSI, we've seen a sign of bearish divergence as an indication for reversal pattern. The RSI has entered the overbought region and it has a significantly lower high on RSI but higher high on the price action.
And on the MACD, I see a potential of death cross on the MA line as the histogram is starting losing some strength with ticking down comparing the previous histogram. And if we see deeper to compare with the previous top of the histogram cycle, the histogram is having a lower high too.
The alignment between MACD and the RSI makes me believe that bitcoin will have a correction in near future. That's why I'm targeting the blue region below as a support for possible touch if this bias hold true. And although my bias is the correction is imminent, I haven't shorted the market yet. It simply because I've seen a very thick sell order around $9900 on the bitfinex. And considering there is potentially very volatile movement when the price touches that area, I'll wait for the consolidation pattern to be formed in lower time frame such as 1 hour and 2 hours time frame to enter short position.

Divergence Trading Strategy1. Find divergence
2. Determine swing candle (use body candle to open trade)
3. Determine stoploss level.
4. Use risk/reward to set takeprofit level.
www.babypips.com

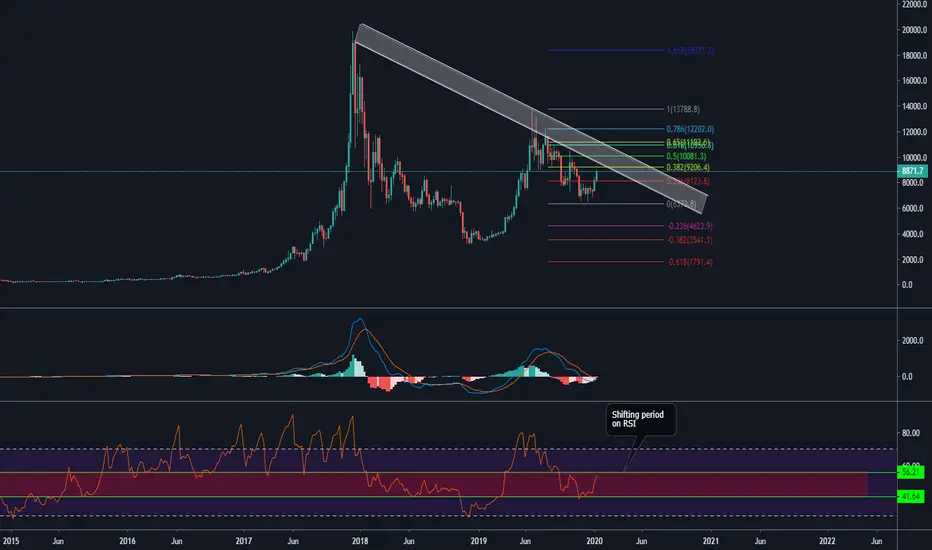
Bitcoin : RSI concern, Bull trap of trend line and MACDHello fellas, welcome back to the analysis about bitcoin. Once again it's very important that we can see the price of bitcoin can touch the $9000 region as a strong resistance based on daily view. But, here I want to look at all possibility that can occur in the market, especially to look at the bigger time frame where we can find out about the major trend which is happening right now.
From the perspective of the weekly chart, we have seen a lower low comparing the ATH in 2017 and the top of 2019. That's why I draw the gray resistance trend line. It's like a zone or range simply because I want to anticipate the bull trap region. And from this perspective, we can see that the price is coming closer to the resistance trend line which has the alignment with the 38.2 fib retracement level.
From the RSI perspective, we can see pink region here, this pink region is the area of shifting from bullish to bearish or bearish to bullish. Every time the RSI breaks out to the upside of this range, it gets bullish and every time the RSI breaks to the lower line, it gets bearish. This time, it tries to break out of the upper line as resistance.
The MACD however still moves in the negative side, although we can see that the histogram is ticking up comparing to the previous weeks. This means the bulls is starting to gain momentum although in overall the bears is taking control. Histogram ticks up to the positive side will be bullish but if Histogram forms a lower low, Bearish.
So far, I'll see what's going on on the daily candle closure to make sure about the next bias. Stay tune.
Daily perspective : trend continuationHello fellas, here I give you another perspective of bitcoin in the daily time frame. In the last few days, the price of the bitcoin is moving so slow and we see decrease in volatility unfortunately. So, I hope after the weekly candle closes in the next few hours, we will see the volatility coming back again.
First of all, I want to give you the explanation of the divergence between the price and the oscillator indicator. There are 2 basic types of divergence if we compare the price with the oscillator indicator. The first divergence is the regular divergence which will indicate the reversal opportunity. And the second one is the hidden divergence which will indicates the trend continuation. And in this analysis, I will give a highlight on the 2nd type of divergence.
From the chart, we can notice a very important price action behavior if we compare it with the oscillator indicator. And the oscillator indicator that I'm using is RSI. we can see that since the August 6th, the price has showed us a lower high structure although at current rate, I'm not so sure if the price has already topped yet. And on the RSI, we can see that it forms a higher high structure since the August 6th, 2019. However, with this current structure, there is a possibility of bearish trend to continue if we get a confirmation of lower high comparing with the top of October 26th.
This hidden divergence perspective will be invalidated if we see the price breaks out of the white resistance zone.


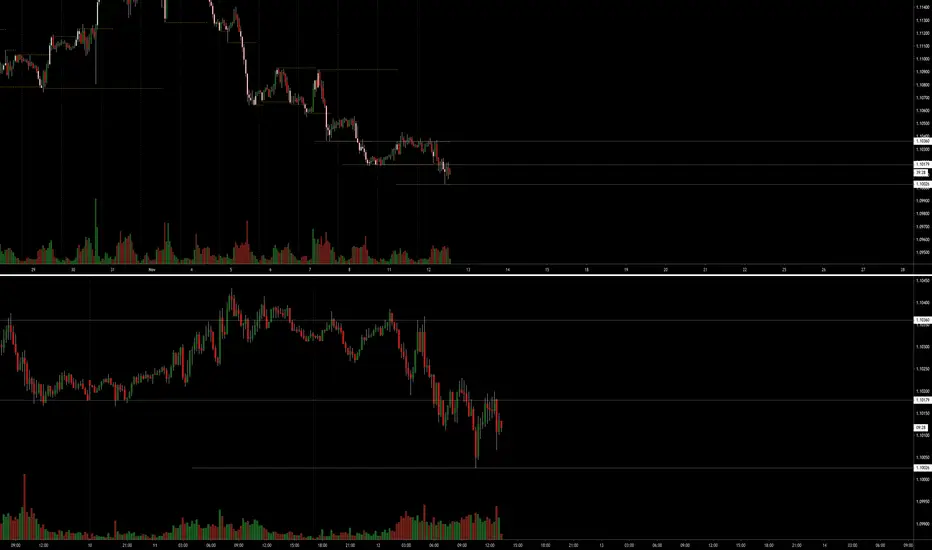
HOW TO FIND CHEAP ENTRY SIGNAL FOR RISKRETURN LIKE 1:10 AND MOREHI BIG PLAYERS,
in this tutorial I want educate you my experience, how to find really cheap entry for trading.
In this example it was possible to take part on a 1:10 trade. It means for 1 USD investment you could take 10 USD return (Risk-Return-Ratio => RRR).
/////////////////////////////////////////////////////
E X A M P L E F O R A B U L L I S H T R E N D
/////////////////////////////////////////////////////
At the beginning we are looking for an oscillator, that shows us an oversold area and in the same time a bullish trend with higher and faster EMA than a slower EMA on the chart. This is possible with a slow EMA(close, 200) and a fast EMA(close, 50) and a RSI(close, 14).... => this is for example my way to find it on the Forex Screener from TradingView at fast as possible.
I developed a similar structure with more quality signals with my candle oscillator indicator. Named: CO 'I.
This indicator allows to see the candle between a range und works at well like the RSI oscillator with 30% and 70% oversold and overbought area. The most positive on this indicator, you don't only see the closing relating price - you see almost more: open, high and low.
Furthermore, I found out that if the body of a candle goes into the range between 30-70% and this is the same trenddirection in the chart, then it was to 90% the lowest/highest bar or 3+ bars nearby them.
So back to my education:
My main view starts on 4H Chart. In this example I found on EUR/JPY a bullish trendfilter with the EMA's and a oversold area on my OC 'I (the wick of the candle was touching the 30% line) - it's only necessary that a touching of the candle is true.
NEXT STEP:
After this bullish signal it is necessary to zoom in the lower timeframe. Here I choosed the 1H Chart and had to wait till the body of the OC 'I also touched the 30% line and of course wait till the candle is finished. It don't depend how much the body touch the 30% line - but it's necessary that the body is touching. In addition, a bullish divergence was built (looking to blue lines).
After the first touching I go into a lower timeframe again. The 15H-Chart was choosed for this example. Hereby the same game: waiting till the body is touching the 30% line.
NOTE: furthermore, if I going into the lower timeframe and the body is already touching - then you don't need to wait for the relase into the range and back to touching again the 30% line.
The 15MIN Chart is the last timeframe. Now we wait till the body goes up and don't touch any line. This is my signal to buy. My exit depends always how the market flow are: in this case it was a big uptrend and a adapting correction wave (this is mostly the time for divergence and this why I set a takeprofit on this high).
With this approuch it was possible to catch a 1:10 trade.
Kind regards
NXT2017

22Buy the code and trading idea details behind this strategy at coinbook.com
We will backtest your trading idea for free: coinbook.com
We build custom trading bots. Please reach out to implement this idea at support@coinbook.zendesk.com.

WILLY WOO - IDENTIFY LONG/SHORT SATURATIONWILLY WOO - IDENTIFY LONG/SHORT SATURATION
Snapshot:
CopyChart:
www.tradingview.com

RSI Divergence in Perspective. Home Depot RSI Divergence.This should not be considered advice. Always do your own research.

DivergenceRSI PIVOT (RSIP) HOW IT WORKS?
This script draws a line when rsi cross over or under the oversold and overbought line. Supprisingly these pivots sometimes good indicator for positive and negative divergence or continuation.
For example:
+ if the price goes above the previos rsi overbought area (red line), it means positive sign and price will contiue to climb like number 1 examples.
+ if the price goes above the previous oversold area (green line). It means positive divergence start like number 2 examples.
+ this script can also say us to up move ended. Because the price can't go above the price like number 3 examples.
+ There are a lots of signals in it ;) you can find them with little effort.
What about 4? Actually it is not a bullish sign but a little pump might come.
Dont be hesitate to use "RSI Pivot" and press like button ;)
Cheers :)

The LMACD on Bitcoin's chart (Logarithmic MACD)The LMACD indicator looks to be even more reliable on Bitcoin's logarithmic 1D chart. You can copy the script of the indicator here:
//@version=3
study(title="Logarithmic Moving Average Convergence Divergence", shorttitle="LMACD")
// Getting inputs
fast_length = input(title="Fast Length", type=integer, defval=12)
slow_length = input(title="Slow Length", type=integer, defval=26)
src = input(title="Source", type=source, defval=close)
signal_length = input(title="Signal Smoothing", type=integer, minval = 1, maxval = 50, defval = 9)
sma_source = input(title="Simple MA(Oscillator)", type=bool, defval=false)
sma_signal = input(title="Simple MA(Signal Line)", type=bool, defval=false)
// Plot colors
col_grow_above = #26A69A
col_grow_below = #FFCDD2
col_fall_above = #B2DFDB
col_fall_below = #EF5350
col_macd = #0094ff
col_signal = #ff6a00
// Calculating
fast_ma = sma_source ? sma(src, fast_length) : ema(src, fast_length)
slow_ma = sma_source ? sma(src, slow_length) : ema(src, slow_length)
lmacd = log(fast_ma) - log(slow_ma)
signal = sma_signal ? sma(lmacd, signal_length) : ema(lmacd, signal_length)
hist = lmacd - signal
plot(hist, title="Histogram", style=columns, color=(hist>=0 ? (hist < hist ? col_grow_above : col_fall_above) : (hist < hist ? col_grow_below : col_fall_below) ), transp=0 )
plot(lmacd, title="LMACD", color=col_macd, transp=0)
plot(signal, title="Signal", color=col_signal, transp=0)
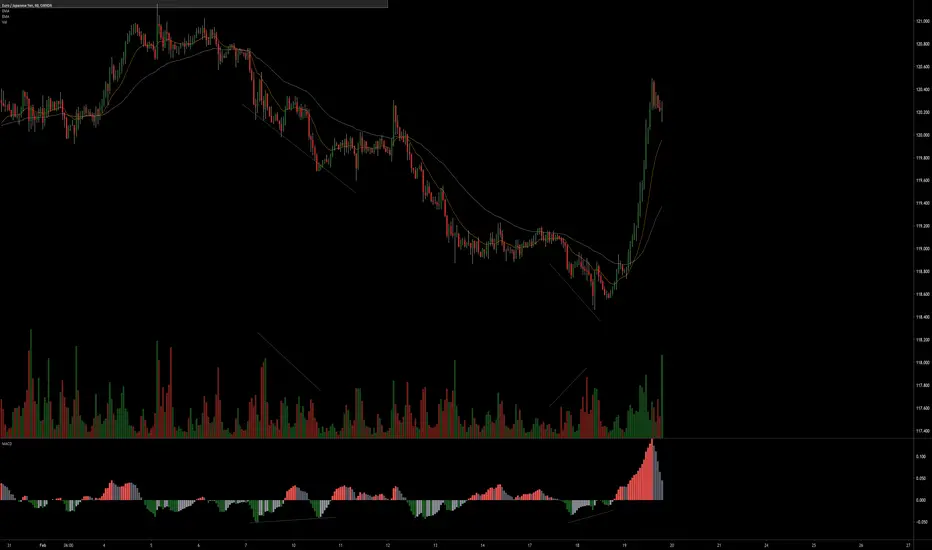
Lazy bear RSI S/R plotting tip In this example the 1 hour is above and 15 min below.
On the 1 hour chart the RSI support and resistance plotting tool is activated. The numeric settings are out of the box. The only change here is the color of the S/R lies and candle illumination.
Once the indicator is activated i chose support and resistance levels that were closer to being in play and superimposed horizontal rays on the selected areas.
You would leave those in place and the drop down to your smaller time frame where you will now have kep support or resistance price level marked. Now you can analyze the volume activity off of these levels based on the higher time frame.
Useful for volume analysis/supply and demand methods. (VSA, Wyckoff, Faders).
The Lazy bear S/R suite contains different variations based on various oscillators and volume. Basically it paints overbought and oversold regions directly on your chart. I cant find any formal instruction on this suite and have been trying to make sense of it on my own. Please add to this if you are more schooled in this are and if you have any questions please ask.
Good Luck!
“Patience is key to success not speed. Time is a cunning speculators best friend if he uses it right”
Jesse Livermore
Sources of education:
Tom Williams Volume spread analysis VSA/ Master the Markets
Richard Wyckoff
Pete Faders VSA*
Read the ticker dot com
Dee Nixon
BTC trading challenge price action/volume techniques
Good luck
Renko Dynamic Index and Zones - Video 3Continuing on trade ideas from video 2 for Renko Dynamic Index and Renko Dynamic Index Zones using a few simple rules.
Other indicators powered by the Renko Engine :
Renko RSI
Renko Trend Momentum
Renko Weis/Ord Wave Volume
Renko MACD and Renko MACD Overlay
Strategies:
RSI-RENKO DIVINE™ Strategy

Renko Dynamic Index and Zones - Video 2I start getting into how I trade the Renko Dynamic Index and Renko Dynamic Index Zones using a few simple rules. I introduce some new coloring schemes and trade direction discovery algorithms.
Other indicators powered by the Renko Engine :
Renko RSI
Renko Trend Momentum
Renko Weis/Ord Wave Volume
Renko MACD and Renko MACD Overlay
Strategies:
RSI-RENKO DIVINE™ Strategy

A More Efficient Calculation Of The Relative Strength IndexIntroduction
I explained in my post on indicators settings how computation time might affect your strategy. Therefore efficiency is an important factor that must be taken into account when making an indicator. If i'am known for something on tradingview its certainly not from making huge codes nor fancy plots, but for my short and efficient estimations/indicators, the first estimation i made being the least squares moving average using the rolling z-score method, then came the rolling correlation, and finally the recursive bands that allow to make extremely efficient and smooth extremities.
Today i propose a more efficient version of the relative strength index, one of the most popular technical indicators of all times. This post will also briefly introduce the concept of system linearity/additive superposition.
Breaking Down The Relative Strength Index
The relative strength index (rsi) is a technical indicator that is classified as a momentum oscillator. This technical indicator allow the user to know when an asset is overvalued and thus interesting to sell, or under evaluated, thus interesting to buy. However its many properties, such as constant scale (0,100) and stationarity allowed him to find multiple uses.
The calculation of the relative strength index take into account the direction of the price changes, its pretty straightforward. First we calculate the average price absolute changes based on their sign :
UP = close - previous close if close > previous close else 0
DN = previous close - close if close < previous close else 0
Then the relative strength factor is calculated :
RS = RMA(UP,P)/RMA(DN,P)
Where RMA is the Wilder moving average of period P . The relative strength index is then calculated as follows :
RSI = 100 - 100/(1 + RS)
As a reminder, the Wilder moving average is an exponential filter with the form :
y(t) = a*x+(1-a)*y(t-1) where a = 1/length . The smoothing constant being equal to 1/length allow to get a smoother result than the exponential moving average who use a smoothing constant of 2/(length+1).
Simple Efficient Changes
As we can see the calculation is not that complicated, the use of an exponential filter make the indicator extremely efficient. However there is room for improvement. First we can skip the if else or any conditional operator by using the max function.
change = close - previous close
UP = max(change,0)
DN = max(change*-1,0)
This is easy to understand, when the closing price is greater than the previous one the change will be positive, therefore the maximum value between the change and 0 will be the change since change > 0 , values of change lower than 0 mean that the closing price is lower than the previous one, in this case max(change,0) = 0 .
For Dn we do the same except that we reverse the sign of the change, this allow us to get a positive results when the closing price is lower than the previous one, then we reuse the trick with max , and we therefore get the positive price change during a downward price change.
Then come the calculation of the relative strength index : 100 - 100/(1 + RS) . We can simplify it easily, first lets forget about the scale of (0,100) and focus on a scale of (0,1), a simple scaling solution is done using : a/(a+b) , where (a,b) > 0 , we then are sure to get a value in a scale of (0,1), because a+b >= a . We have two elements, UP and DN , we only need to apply the Wilder Moving Average, and we get :
RMA(UP,P)/(RMA(UP,P) + RMA(DN,P))
In order to scale it in a range of (0,100) we can simply use :
100*RMA(UP,P)/(RMA(UP,P) + RMA(DN,P))
= 100*RMA(max(change,0),P)/(RMA(max(change,0),P) + RMA(max(change*-1,0),P))
And "voila"
Superposition Principle and Linear Filters
A function is said to be linear if : f(a + b) = f(a) + f(b) . If you have studied signal processing a little bit, you must have encountered the term "Linear Filter", its just the same, simply put, a filter is said to be linear if :
filter(a+b) = filter(a) + filter(b)
Simple right ? Lot of filters are linear, the simple moving average is, the wma, lsma, ema...etc. One of most famous non linear filters is the median filter, therefore :
median(a+b) ≠ median(a) + median(b)
When a filter is linear we say that he satisfies the superposition principle. So how can this help us ? Well lets see back our formula :
100*RMA(UP,P)/(RMA(UP,P) + RMA(DN,P))
We use the wilder moving average 3 times, however we can take advantage of the superposition principle by using instead :
100*RMA(UP,P)/RMA(UP + DN,P)
Reducing the number of filters used is always great, even if they recursion.
Final Touch
Thanks to the superposition principle we where able to have RMA(UP + DN,P) , which allow us to only average UP and DN togethers instead of separately, however we can see something odd. We have UP + DN , but UP and DN are only the positive changes of their associated price sign, therefore :
UP + DN = abs(change)
Lets use pinescript, we end up with the following estimation :
a = change(close)
rsi = 100*rma(max(a,0),length)/rma(abs(a),length)
compared to a basic calculation :
up = max(x - x , 0)
dn = max(x - x, 0)
rs = rma(up, length) / rma(dn, length)
rsi = 100 - 100 / (1 + rs)
Here is the difference between our estimate and the rsi function of both length = 14 :
with an average value of 0.000000..., those are certainly due to rounding errors.
In a chart we can see that the difference is not significant.
In our orange our estimate, in blue the classic rsi of both length = 14.
Conclusion
In this post i proposed a simplification of the relative strength index indicator calculation. I introduced the concept of linearity, this is a must have when we have to think efficiently. I also highlighted simple tricks using the max function and some basic calculus related to rescaling. I had a lot of fun while simplifying the relative strength index, its an indicator everyone use. I hope this post was enjoyable to read, with the hope that it was useful to you. If this calculation was already proposed please pm me the reference.
You can check my last paper about this calculation if you want more details, the link to my papers is in the signature. Thanks for reading !

Profitable RSI optimizes 3 parameters!Well, it's just a small public announcement.
I went to this for a long time and now it has become possible. Profitable RSI now handles 3 parameters of the standard RSI indicator to find the best tuple of settings. So, additionally to period setting, the optimizer takes under consideration different Overbought (from 60 to 70 ) and Oversold levels (from 30 to 40 ) for each RSI period.
Four main conclusions from my research (if you gonna trade with RSI):
The OB/OS levels are not necessary to be the standard 70/30 ones. With all my respect to J. Welles Wilder, but those bounds cannot be considered optimal.
The OB/OS levels can be asymmetric. So OB can be 65 while OS is 39. Not 70/30, not 60/40 and not 75/25. Asymmetric ones.
There is no efficient trading with period setting higher than 50.
We can make a feast even from the old indicator
And the last thing I wanted to add - let's not live in the old paradigms. The world is changing, trading is changing and we must change too. Don't be afraid to experiment with something new for you.
The tool I talked about, the Profitable RSI, is here
Good luck, Good health, God bless you

4H BTC Waves+ Signal charting, full blindFully blind signal charting followup for Waves+, BTCUSD 4h.
All horizontal lines/signals were plotted with the candlestick chart hidden and not visible. Additionally, this time, all directional trades and exits were determined with the chart hidden.
Additional signal explanation and rationale is detailed in yellow text, annotated on the chart/indicators.
8/10 Trades closed in profit (green checkmark). 2 Trades marked with red X were below 2% profit margin, and are considered a loss unless high leverage is used.
Setup/configuration:
Initial setup with Waves+, DOSC (Derivative Oscillator) with signal line disabled. 1-2 bar delay on signals to provide accurate/realistic demonstration of entries/exits (on bar close).
Waves+ has the LSMA line enabled (dark blue).
Waves+ is a hybrid wavetrend fibbonaci oscillator.
Waves+ components:
Light blue line = Waves line
Dark blue line = LSMA line
Red line = Mmenosyne follower (fib line with medium speed)
Green line = Mmenosyne base (fib line with slow speed)
Shaded yellow zone = Explosion Zone warning (Ehler's Market Thermometer)
Red/green center dots = TTM Squeeze Loose Fire(red), TTM Squeeze Strict Fire (green)
Lower dotted line = 38.2 fib line
Upper dotted line = 61.8 fib line
Lower dashed line = 25 wavetrend limit
Upper dashed line = 75 wavetrend limit
Blue 1/2 height block = suggested TP from short/drop incoming 1-2 bars
Orange 1/2 height block = suggested TP from long
Chart markup:
solid green = buy/long signal
solid red = sell/short signal
dashed red = early sell/short signal
dashed green = early buy/long signal
dashed orange = suggested exit from long signal
dashed blue = suggested exit from short signal
Trades closed in profit/loss, no stops, marked up on chart:
Trade closed in profit = green checkmark
Trade closed at a loss = red X.
Trades that are less than 2% in profit will be considered a loss for scalping unless leverage is used.
Incremental for this blind signal test will be documented below/updated as part of the trade idea/post.
