From Congestion to Collapse: Understanding Distribution and H&S A Simple Lesson: How to Identify Congestion Zones in the Market — Schabacker’s Approach and the Head and Shoulders Pattern
⸻
👤 Who Was Schabacker?
🔹 Richard Schabacker was one of the pioneers who authored seminal works on technical analysis.
🔹 He lived over 90 years ago and served as Editor-in-Chief of Financial World magazine.
🔹 His most notable book is:
Technical Analysis and Stock Market Profits
🔹 Published around 1932 in the United States.
🔹 Schabacker is often considered the “grandfather” of technical analysis, and much of the methodology traders use today can be traced back to his insights.
⸻
🟢 What Did He Teach?
🔹 Schabacker introduced a critical concept:
✅ The Congestion Zone
🌟 What Does It Mean?
When the market makes a strong move—either a sharp rally or a steep decline—price often becomes trapped in a range:
• Buyers at higher levels wait for further gains.
• Sellers at lower levels expect more downside.
But in reality, retail traders aren’t moving the market. Large institutions and funds—the so-called smart money—are in control.
👈 When these big players want to exit positions, they avoid selling everything at once to prevent a sudden collapse in price and to avoid revealing their hand.
✅ Their Playbook:
• Keep price contained within a narrow band between support and resistance.
• Gradually increase volume over time.
• Attract new buyers who believe the trend is still intact.
• Quietly distribute their holdings without alarming the market.
🌟 Why Do They Do This?
If they were to dump all at once:
• Price would drop rapidly.
• Everyone would realize a large seller was active.
• Institutions would get stuck, unable to exit at favorable prices.
🔻 So They Create Congestion and Distribution:
1️⃣ Sell discreetly over time.
2️⃣ Maintain the illusion that the trend is healthy.
3️⃣ Trap latecomers who buy into the range.
⸻
🟢 How Do You Recognize This on a Chart?
🎯 A Simple Example:
• Price climbs steadily from 3,000 to 3,300.
• Suddenly, it surges to 3,450.
✅ Most traders think the rally will continue.
🌟 What happens next:
• Price stalls between 3,380 and 3,450.
• Numerous candles form in this area.
• Volume remains elevated.
🔥 Inside this range:
1️⃣ Institutions sell into every upward move.
2️⃣ Early buyers remain committed, hoping for new highs.
3️⃣ New participants enter, unaware of the distribution.
🔻 What Do You See?
• Repeated candles oscillating within the same band.
• Failed breakouts above resistance.
• Sustained high volume.
✅ This is the classic Congestion Zone.
⸻
💡 How Can You Tell If It’s Distribution, Not Accumulation?
• Persistent high volume indicates steady selling.
• Price struggles to make fresh highs.
• Long upper wicks signal selling pressure.
• A Head and Shoulders pattern may start forming.
⸻
🎯 What Happens After Congestion?
• Institutions complete their distribution.
✅ Price breaks sharply below the range.
✅ The market drops quickly.
✅ Late buyers are forced to sell at losses.
⸻
🟢 Practical Illustration:
Visualize the range like this:
| |
| The Range |
| |
3380 ————> Resistance
| Multiple Candles |
| Multiple Candles |
| Multiple Candles |
3300 ————> Support and Neckline
✅ If price breaks below 3,300 on heavy volume:
• The distribution is complete.
• Price declines rapidly.
⸻
📌 Key Takeaway:
After any strong move, expect congestion as large players exit. Once they’re done, the trend often reverses.
⸻
🎯 Quick Tips:
✅ Never rush to buy inside congestion after a big rally.
✅ Watch volume—if it’s high, it’s likely distribution.
✅ Wait for a clear breakdown before shorting.
✅ Your target should at least match the size of the preceding move.
⸻
🔥 Let’s Cover the Head and Shoulders Pattern:
✅ What Is It?
A reversal pattern appearing after a strong uptrend, signaling the end of bullish momentum.
⸻
✅ Pattern Components:
1️⃣ Left Shoulder:
• Price makes a high.
• Pulls back.
2️⃣ Head:
• Rallies to a higher high.
• Declines again.
3️⃣ Right Shoulder:
• Attempts to rise but fails to exceed the head’s high.
4️⃣ Neckline:
• Connects the lows between the shoulders and the head.
🔻 When the Neckline Breaks Down:
It’s a strong sell signal. The market often drops decisively.
⸻
💡 Example in Numbers:
• Price moves from 3,200:
1️⃣ Up to 3,350 (Left Shoulder)
2️⃣ Down to 3,300
3️⃣ Up to 3,400 (Head)
4️⃣ Down to 3,300
5️⃣ Up to 3,350 (Right Shoulder)
6️⃣ Down to 3,300
✅ If price closes below 3,300 on strong volume, the pattern is confirmed.
🎯 Target Calculation:
• Head = 3,400
• Neckline = 3,300
• Distance = 100 points
• Target = 3,200
⸻
🟢 How To Trade It:
1️⃣ Don’t preemptively sell during the right shoulder.
2️⃣ Wait for a confirmed breakdown.
3️⃣ Enter a short position targeting 3,200.
4️⃣ Set your stop loss above the right shoulder.
⸻
🟢 Final Advice:
✅ The Head and Shoulders is powerful if confirmed by volume.
✅ Always wait for the neckline break—otherwise, it could be a false signal.
✅ Keep monitoring volume for confirmation.
⸻
🔥 Be disciplined in your analysis and decisive in your execution.
🔥 As Warren Buffett said:
“The stock market is a device for transferring money from the impatient to the patient.”
⸻
If you found this valuable, let me know—I’d be glad to prepare more lessons. 🌟
Trading Plan

Wait for your EDGE...
Discipline is what separates professionals from amateurs.
Stay patient. Wait for your edge. Let the probabilities work in your favor.
👉 “Agree with this? Hit Boost to spread the message.”
#TradingPsychology #Discipline #BTC #Bitcoin #Forex
#TradingMindset #AlBrooks #TradingDiscipline #PriceAction #ForexTrading #CryptoTrading #StockMarket #MJTrading #TradingQuotes #TraderLife #MindOverMarkets

XAUUSD Traders – The ONLY Timeframes That Matter🎓 XAUUSD Traders – The ONLY Timeframes That Matter
If you want to stop being a liquidity snack for the big players, you must know which timeframes actually reveal what the market makers are doing.
Here’s your complete educational guide for XAUUSD:
⸻
🔍 1️⃣ The 4-Hour (4H) – The Market Maker Blueprint
✅ Why Watch It?
This is where the real accumulation and distribution happens.
Market makers build and unwind positions over multiple sessions—London and New York.
If you want to see the big plan, this is your chart.
✅ What to Look For:
• Strong rejection candles near key resistance (3330–3350).
• Fake breakouts with no follow-through.
• EMA21 and SMA50 acting as dynamic resistance.
• High-volume candles marking where the big boys stepped in.
🎯 Tip: If the 4H chart is bearish, every bounce on smaller timeframes is suspect.
⸻
⏰ 2️⃣ The 1-Hour (1H) – Timing the Trap
✅ Why Watch It?
1H is perfect for seeing the moment the trap is set.
This is when price pumps into resistance or dumps below support—just enough to trigger stops.
✅ What to Look For:
• Quick rallies on low volume (pump phase).
• Reversal candles forming right after a breakout.
• Delta flipping negative as price pushes higher (hidden selling).
🎯 Tip: Combine 4H structure with 1H confirmation—this is where precision timing happens.
⸻
🎯 3️⃣ The 15-Minute (15M) – Entry Execution
✅ Why Watch It?
15M shows micro-structure and liquidity hunts.
This is where you confirm whether that big 1H candle was real—or just a head fake.
✅ What to Look For:
• Sharp wicks that stop out traders (liquidity flush).
• Tight consolidation after a failed breakout.
• Rejection patterns before price reverses.
🎯 Tip: Use the 15M to pull the trigger—not to overthink.
⸻
📅 4️⃣ The Daily – Bias Confirmation
✅ Why Watch It?
Daily sets the macro tone.
You must know whether you’re fighting the bigger wave.
✅ What to Look For:
• Where price closed relative to EMA21 and SMA50.
• Big bearish engulfing candles.
• Volatility expanding or contracting.
🎯 Tip: If daily is bearish, you have extra confirmation to fade pumps.
⸻
⚔️ How to Combine These Timeframes
Here’s the professional workflow:
1️⃣ Daily – Define bullish or bearish bias.
2️⃣ 4H – Spot the setup zone (accumulation or distribution).
3️⃣ 1H – Watch the trap unfold.
4️⃣ 15M – Execute your entry with surgical precision.
✅ This is how you stop chasing noise and start trading structure.
⸻
💡 Pro Wisdom:
“Retail traders react to price. Professionals react to price and context.”
— Technical Analysis and Stock Market Profits
⸻
🚀 Trade smart. Study structure. Outsmart the herd.
#XAUUSD #ForexEducation #PriceActionTrading #MarketMakerSecrets #LearnToTrade

XAUUSD Market Maker Playbook – Learn How the Game Is Rigged🎓 XAUUSD Market Maker Playbook – Learn How the Game Is Rigged
Traders—if you think this market is some pure, fair supply/demand mechanism, you’re getting played.
Market makers run sophisticated pump and dump cycles designed to trap you.
Today, I’m going to break down exactly how they do it, so you can start trading like a sniper, not a sheep.
🔍 Understanding the 3 Manipulation Zones
🟢 GREEN ZONE: Accumulation Range (3286–3300)
Purpose:
Market makers quietly build positions.
They create an illusion of neutrality—small candles, tight ranges.
Signs:
Repeated tests of the same level.
Volume stays steady (not exploding).
Wicks in both directions (so nobody knows who’s in control).
🟡 YELLOW ZONE: The Pump Phase (3300–3330)
Purpose:
Trigger breakout traders.
Induce FOMO buying.
Clear out short stops above the range.
Signs:
Quick impulsive candles with LOW RELATIVE VOLUME.
Price blows through resistance but struggles to hold.
Social media and news start calling “Bull Run.”
🔴 RED ZONE: Distribution & Dump (3330–3350)
Purpose:
Offload large positions into retail buying.
Leave traders trapped at the highs.
Signs:
Spikes of huge volume as price stalls.
Rejection candles (long upper wicks).
Big delta shifts negative (sellers hitting bids hard).
⚔️ How the Market Maker Sequence Works
Here’s how the trap gets set:
1️⃣ Accumulate in Green Zone
Build inventory while convincing everyone “nothing is happening.”
2️⃣ Pump into Yellow Zone
Push price up just enough to trigger momentum traders.
Keep volume deceptively low—so it looks sustainable.
3️⃣ Sell in the Red Zone
Dump big positions into the buying frenzy.
Flip the tape bearish—fast.
Watch as the herd gets stopped out or bag-held.
🎯 Tomorrow’s Possible Plays
✅ Scenario 1 – Classic Pump & Dump
Phase 1: Grind in 3286–3300.
Phase 2: Spike to 3335.
Phase 3: Dump back to 3260.
✅ Scenario 2 – Fake Breakdown Reversal
Phase 1: Slam price to 3250, triggering panic selling.
Phase 2: Accumulate aggressively.
Phase 3: Rip price back to 3320, trapping shorts.
✅ Scenario 3 – Slow Grind Liquidation
Phase 1: Drift up in low volume toward 3330.
Phase 2: Distribute over several hours.
Phase 3: Liquidate longs into NY close.
📚 How YOU Can Spot This Manipulation
Here’s your checklist—save this:
✅ Volume vs. Price Analysis
Big price moves WITHOUT proportionate volume = FAKEOUT.
Big volume at tops/bottoms = Institutional distribution or accumulation.
✅ Delta Confirmation
Positive delta = buyers aggressive.
Negative delta = sellers slamming bids.
Watch for divergence (price up but delta down = hidden selling).
✅ Candlestick Clues
Rejection wicks.
Engulfing candles at key zones.
Multiple failures to break past a level.
✅ Timing
London open and NY open are prime manipulation hours.
Thin liquidity in Asia can exaggerate moves.
💡 Pro Tip:
“The crowd chases price. The professionals track volume, delta, and timing.”
— Technical Analysis and Stock Market Profits
🚀 Stay sharp. Think like a market maker. Trade like a predator.
#XAUUSD #MarketMakerEducation #ForexTrading #PriceAction #LearnT
Mastering Delta–Volume Divergence
🎓 Mastering Delta–Volume Divergence: How to Read Institutional Absorption and Trap Setups
⸻
1️⃣ What Is Delta?
Delta measures the net aggression between buyers and sellers:
• Market Buys: traders lifting the ask
• minus
• Market Sells: traders hitting the bid
✅ Positive Delta indicates stronger buying pressure.
✅ Negative Delta indicates stronger selling pressure.
Delta shows who is initiating trades, not just that trading is occurring.
⸻
2️⃣ What Is Volume?
Volume measures the total number of contracts traded, regardless of who initiated them.
Every matched buy and sell contributes equally to volume.
Volume reveals activity, but not who controls the move.
⸻
3️⃣ What Is Delta–Volume Divergence?
Delta–Volume Divergence occurs when:
✅ Volume is high (lots of trades happening),
✅ But Delta is near zero (neither side dominates).
This signals:
• Intense two-sided activity between buyers and sellers,
• Strong participation on both sides,
• Passive absorption—institutions quietly filling large orders without moving price significantly.
⸻
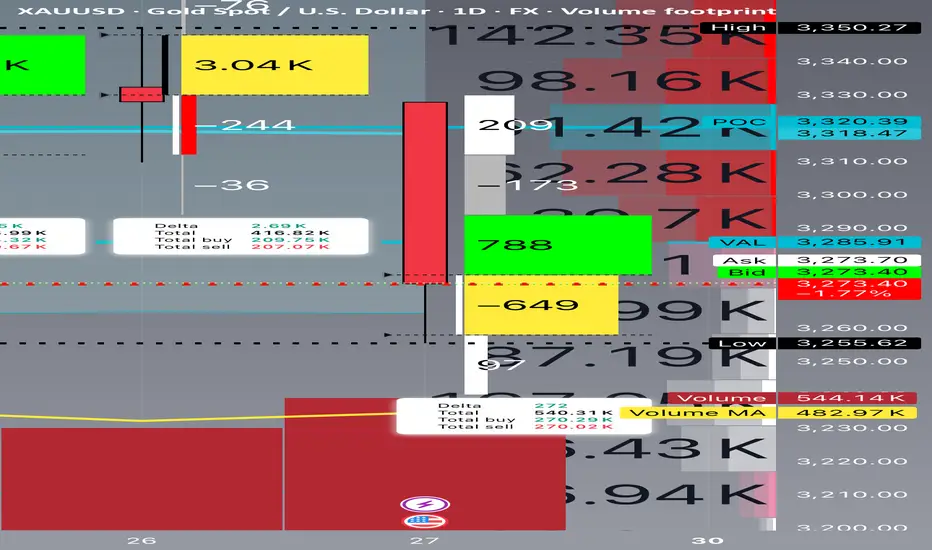
4️⃣ Chart Breakdown – Bar by Bar
Below is a clear example of this concept in practice, reviewing each daily bar from your footprint chart:
⸻
🔴 June 24
• Delta: -8,240 (strong net selling)
• Volume: 575,720 (very high)
• Interpretation:
• Heavy, aggressive selling.
• Clear trend-confirming action.
• No divergence.
⸻
🟢 June 25
• Delta: +4,650 (net buying)
• Volume: 343,990 (moderate)
• Interpretation:
• Counter-trend buying or short covering.
• Less volume and less conviction.
⸻
🟢 June 26
• Delta: +2,690 (mild net buying)
• Volume: 416,820 (higher)
• Interpretation:
• Rising volume but weaker delta.
• Early sign of balance developing.
• Possible absorption beginning.
⸻
🟨 June 27 (Critical Bar)
• Delta: +272 (near zero)
• Volume: 540,310 (very high)
• Interpretation:
• Huge volume churn.
• Neither buyers nor sellers in control.
• Likely institutional absorption of aggressive orders.
✅ This is a textbook example of Delta–Volume Divergence.
⸻
5️⃣ Why This Matters
Professional Insight:
• Sellers had been aggressive for several sessions.
• Suddenly, volume remained elevated, but delta flatlined.
• This suggests:
• Exhaustion of selling aggression, or
• Institutional accumulation and passive positioning.
This often sets the stage for:
• A trap reversal (short squeeze), or
• A continuation flush if sellers regroup and push lower.
⸻
6️⃣ Confirmation Scenarios
Scenario A: Bearish Continuation
• Watch for renewed strong negative delta (e.g., -5,000 or worse).
• Price remains below the last support (~3,250).
• Confirms absorption failed and sellers remain dominant.
Scenario B: Short Squeeze Reversal
• Price reclaims the VAL (~3,285–3,300).
• Delta flips strongly positive (+5,000 or more).
• Trapped shorts begin covering, driving price back toward supply.
⸻
7️⃣ Common Misinterpretation
⚠️ High volume alone does NOT mean momentum.
Key Point:
If delta is flat, high volume simply means churn, not directional energy.
This is why inexperienced traders often get caught:
• They see heavy volume and assume a breakout is underway.
• In reality, the market is absorbing liquidity to trap both sides.
⸻
8️⃣ Professional Tips for Trading Divergence
✅ Wait for confirmation before entering:
• Clear delta shifts, and
• Price reclaiming or rejecting key levels.
✅ Be aware of stop zones:
• Under recent lows if buyers fail,
• Above recent range if sellers get exhausted.
✅ Avoid trading during pure churn without clear follow-through.
⸻
9️⃣ Quick Recap
✅ Delta–Volume Divergence: High volume, flat delta, no clear directional control.
✅ Typically signals absorption and position buildup.
✅ Requires confirmation before committing to trades.
✅ Recognizing it helps you avoid traps and false breakouts.
⸻
🔟 Final Thought
Learning to read divergence is what separates professional traders from retail:
“Volume tells you how hard the market is working. Delta tells you who’s winning.”
Combine both to see the hidden game behind every price bar.
⸻
⚠️ Disclaimer: This lesson is for educational purposes only. Nothing here constitutes financial advice.
When Charts Lie: How Fundamentals Rescued My Forex TradingEvery trader knows the frustration: your analysis is technically flawless, but the market moves against you. I learned this brutally in Q1 2024 when my USD/CAD short—backed by textbook bearish divergence and order block rejection—got steamrolled by a 190-pip rally after Canada’s surprise oil export announcement.
The Blind Spot in Pure Technicals
Price action traders often dismiss fundamentals as "noise," but three scenarios consistently break chart-based systems:
Policy Surprises (SNB removing EUR/CHF floor)
Geopolitical Shocks (Rubles during Ukraine invasion)
Structural Shifts (BOJ abandoning YCC)
These events share one trait: they change the market’s fundamental DNA, invalidating historical patterns.
A Practical Filter
I need to train myself to do something like this: To overlay two fundamental checks before technical entries:
Central Bank Calendar
No trades 12 hours before scheduled meetings
Monitor yield spreads (10YR US vs. DE)
Commodity Links
AUD/USD: Iron ore inventories
USD/CAD: WTI backwardation
Case Study: April 2024 GBP/USD
Technicals suggested continuation above 1.2700
Fundamental red flag: UK real wages shrinking
Outcome: False breakout, 140-pip drop
Your Turn
Try this today: On your next trade, ask:
Is there scheduled event risk?
Does this align with rate expectations?
Are commodities/equities confirming?
The goal isn’t perfection—it’s avoiding obvious mismatches.
For me, I read my own words on what should be done, and most probably, I won't do it. I think the above is too much. I believe there must be an easier way to merge Technical and Fundamental Analysis.

4 Powerful, Daily Affirmations for Faith-Based TradersAffirmations make a huge difference.
But why?
It's because they shape our beliefs.
Whatever we think, affects what we say.
Whatever we say, affects what we do.
Whatever we do, is who we become and what our life actual looks like.
Repeat these affirmations daily and watch your life change before your eyes.
Wealth flows to me with ease as I walk in purpose.
I reject scarcity and embrace Kingdom abundance.
I am open to divine provision in expected and unexpected ways.
I have more than enough to thrive and to give.
Happy trading!
For those of you who are trading to make a bigger impact in the world, I am praying for you!

Automated Execution: TradingView Alerts → Tradovate using AWS LaI’ve built a fully automated pipeline that takes live TradingView alerts and turns them into real orders in Tradovate. Here’s how it works, step by step (I will provide a video on it):
PineScript Alerts
My indicator/strategy in TradingView fires alert() with a JSON payload (symbol, side, qty, price, ATR, ENV).
Webhook to AWS
Alerts hit an API Gateway endpoint in AWS, invoking a Lambda function.
Lambda Processing
Parse the JSON from TradingView.
Calculate Stop‐Loss & Take‐Profit using ATR.
Authenticate to the Tradovate API (demo & live environments).
Place an OCO order (placeOSO) with proper bracket legs.
Send a confirmation message to my Telegram channel.
Tradovate REST API
Auth: POST /auth/accesstokenrequest → accessToken
List accounts: GET /account/list → find accountId
Place OCO: POST /order/placeOSO with entry, SL, TP
Testing & Monitoring
Local smoke tests of Telegram bot.
Lambda console test events for sample payloads.
CloudWatch logs for debugging & alerts on errors.
Why it matters:
Zero manual steps from signal to fill.
Consistent risk management via ATR‐based SL/TP.
Clear audit trail: logs in AWS + Telegram notifications.
Educational resource for anyone building similar setups
Feel free to ask questions or suggest improvements! Please leave comments.

Learn The Difference Between Beginner and Expert in Trading
In the today's post, we will discuss the evolution of a mindset of a trader as he matures in trading.
✔️Beginner
For some unknown reasons, beginners assume that a couple of educational videos and books about trading is more than enough to start trading successfully.
They believe that they got a comprehensive knowledge and that very few things remain to learn.
They start trading, but quickly realize that their knowledge is not enough to make even small gains.
✔️COMPETENT
After practicing a couple of years, traders come to the conclusion
that they know everything in that field. That they learned, tested and tried all concepts and techniques that are available.
They consider themselves to be the experts in the field BUT
for some unknown reasons, these traders still are not able to trade profitably.
✔️EXPERT
After many years of learning, training and practicing, eyes finally open.
Traders realize how limited is their knowledge and how much more there is to learn .
While they already have the skills to trade in profits, they understand now that even the entire life is not enough to learn all the subtleties of trading.
And here is a little lifehack for you:
if you are a beginner, embrace a mindset of an expert.
Start from realizing how little you actually know and how much more there is to know, that will help you a lot in your trading journey.
❤️Please, support my work with like, thank you!❤️
I am part of Trade Nation's Influencer program and receive a monthly fee for using their TradingView charts in my analysis.

Learn 6 Common Beginner Trading Mistakes (FOREX, GOLD)
In the today's post, we will discuss very common beginner's mistakes in trading that you should avoid.
1. No trading plan 📝
That is certainly the TOP 1 mistake. I don't know why it happens but 99% of newbies assume that they don't need a trading plan.
It is more than enough for them to watch a couple of educational videos, read some books about trading and Voilà when a good setup appears they can easily recognize and trade it without a plan.
Guys, I guarantee you that you will blow your trading account in maximum 2 months if you keep thinking like that. Trading plan is the essential part of every trading approach, so build one and follow that strictly.
2. Overtrading 💱
That mistake comes from a common newbies' misconception: they think that in order to make money in trading, they should trade a lot. The more they trade, the higher are the potential gains.
The same reasoning appears when they choose a signal service: the more trades a signal provider shares, the better his signals are supposed to be.
However, the truth is that good trades are very rare and your goal as a trader is to recognize and trade only the best setups. While the majority of the trading opportunities are risky and not profitable.
3. Emotional trading 😤
There are 2 ways to make a trading decision: to make it objectively following the rules of your trading plan or to follow the emotions.
The second option is the main pick of the newbies.
The intuition, fear, desire are their main drivers. And such an approach is of course doomed to a failure.
And we will discuss the emotional trading in details in the next 2 sections.
4. Having no patience ⏳
Patience always pays. That is the trader's anthem.
However, in practice, it is extremely hard to keep holding the trade that refuses to reach the target, that comes closer and closer to a stop loss level, that stuck around the entry level.
Once we are in a trade, we want the price to go directly to our goal without any delay. And the more we wait, the harder it is to keep waiting. The impatience makes traders close their trades preliminary, missing good profits .
5. Greed 🤑
Greed is your main and worst enemy in this game.
It will pursue you no matter how experienced you are.
The desire to get maximum from every move, to not miss any pip of profit, will be your permanent obstacle.
Greed will also pursue you after you close the profitable trades. No matter how much you win, how many good winning trades you catch in a row, you always want more. And that sense main lead you to making irrational, bad trading decision.
6. Big Risks 🛑
Why to calculate lot size for the trade?
Why even bother about risk management?
These are the typical thoughts of the newbies.
Newbie traders completely underestimate the risks involved in trading and for that reason they are risking big.
I heard so many times these stories, when a trading deposit of a trader is wiped out with a one single bad trade.
Never ever risk big, especially if you just started.
Start with a very conservative approach and risk a tiny little portion of your trading account per trade.
Of course there are a lot more mistakes to discuss.
However, the ones that I listed above at the most common
and I am kindly recommending you to fix them before you start trading with a substantial amount of money.
❤️Please, support my work with like, thank you!❤️
I am part of Trade Nation's Influencer program and receive a monthly fee for using their TradingView charts in my analysis.

How to Calculate Forex Lot Size on TradingView. Free Calculator
Do you know that TradingView has a built-in Forex position size calculator?
It is completely free, it is simple to use, and it does not require a paid subscription to use it.
In this article, I will teach you how to calculate a lot size for your trades on TradingView easily in 3 simple steps.
Step 1 - Setting Up the Calculator
First, open a price chart on TradingView and find a "Trading Panel" button in the bottom of the window.
Click "Maximize Panel" afterward.
In the list of brokers, select " TradingView Paper Trading" and click "Connect".
Paper Trading is built in demo trading account on TradingView.
It does not require KYC or any other verification.
Choose "Account" list box and tap "Create Account" .
Then fill all the inputs with exactly the same parameters as your real trading account has.
Type in your exact account size, leverage and commission rate.
Then click "Create".
TradingView position size calculator is ready to use.
Step 2 - Find the Trading Opportunity
Find a trading setup to trade. Make sure that you know the exact entry level and stop loss.
Imagine that you want to buy EURUSD from 1.0899 price level with 1.08846 stop loss level.
Step 3 - Measure a Proper Lot Size
Right-click on a price chart and choose "Trade" and in the appeared menu select "Create New Order".
Fill the following fields:
"Price" - your entry level,
"% risk" - your desired risk per trade in %,
"Stop Loss price" - your stop loss price level.
Your lot size will be based on the calculated units .
In forex trading 1 standard lot equals 100000 units.
The only thing that you should do is to take the exact units number and divide it by 100000.
In our case we have 704225 units.
704225 / 100000 = 7,04 lot.
That will be your lot size for buying EURUSD with 1% risk for 100000 trading account.
If you apply TradingView for market analysis and charting and your trading terminal does not have a lot size calculator, this method will be the quickest and the easiest to apply for measuring the position size.
❤️Please, support my work with like, thank you!❤️
I am part of Trade Nation's Influencer program and receive a monthly fee for using their TradingView charts in my analysis.

NO TRADE? THAT IS THE TRADEToday, I took no trades and I’ll be honest, it was really tempting to break that discipline.
I stared at the chart longer than I needed to. My cursor hovered around the Buy and Sell buttons. My brain tried to convince me that “maybe” this candle meant something. Even though there was no valid sweep, no BOS, and no clean entry into an FVG , the desire to just “be in a trade” was strong.
But I reminded myself:
📌 No Setup = No Trade
📌 Your edge is your lifeline
📌 Discipline is what pays you, not activity
What I felt today is something every trader battles, setup hoping . It’s that mental trap where silence feels wrong, and boredom feels dangerous. But the truth is, boredom is part of being a consistently profitable trader. There are days where your best trade is the one you don’t take.
And I’m proud to say I did nothing.
No revenge trade.
No gambling.
No deviation from plan.
Instead, I observed. I journaled my emotions. I stayed in control. That’s the work behind the scenes: the mental reps that build longevity in this business .
So if you had a quiet session today too, and you resisted the urge to jump in without reason, celebrate that. You're training your mind to trust your system, not your feelings.
Sometimes, the most powerful trade you’ll ever take… is the one you never place.

Learn What is TRAILING STOP LOSS | Risk Management Basics
In the today's article, we will discuss a trailing stop loss. I will explain to you its concept in simple words and share real market examples.
🛑Trailing stop loss is a risk management tool that allows to protect unrealized profits of an active trading position as long as the price moves in the desired direction.
Traditionally, traders trade with fixed stop loss and take profit. Following such an approach, one knows exactly the level where the trade will be closed in a profit and the level where it will be closed in a loss.
Take a look at a long trade on USDCAD above.
The trade has fixed TP Level - 1.354 and fixed SL Level - 1.341.
Once one of these levels is reached, the trade will be closed.
Even though the majority of the traders stick to fixed sl and tp, there is one important disadvantage of such an approach – substantial gains could be easily missed .
After the market reached TP in USDCAD trade, the price temporarily dropped, then a strong bullish rally initiated and the price went way above the Take Profit level. Potential gains with that long position could be much bigger.
Trailing stop solves that issue.
With a trailing stop loss, the trader usually opens the trade with Stop Loss and WITHOUT Take Profit.
Take a look at a long trade on USDCHF.
Trader expects growth, he opens a long position and sets stop loss – 0.8924, while take profit level is not determined.
With a trailing stop loss, the trader usually opens the trade with Stop Loss and WITHOUT Take Profit.
As the market starts growing, one decides not to close the trade in profit, but modify stop loss – trail it to the level above the entry.
As the market keeps rallying, one TRAILS a stop loss in the direction of the market, protecting the unrealized gains.
When the market finally starts falling, the price hits stop loss and a trader closes the trade in a substantial profit.
The main obstacle with the application of a trailing stop is to keep it at a distance from current price levels that is not too narrow nor too wide.
With a wide stop loss distance, substantial unrealized gains might be washed out with the market reversal.
Imagine you predicted a nice bullish rally on Bitcoin.
The market bounced nicely after you opened a long position.
Trailing stop loss too far from current price levels, all the gains could be easily wiped out.
While with a narrow trailing stop distance, one can be stop hunted before the move in the desired direction continues.
A trader opens a long trade on EURJPY and the price bounces perfectly as predicted.
One immediately trails the stop loss.
However, the distance between current prices was too narrow and the position was closed after a pullback.
And then market went much higher.
In conclusion, I want to note that fixed SL & TP approach is not bad , it is different and for some trading strategies it will be more appropriate. However, because of its limitations, occasionally big moves will be missed.
Try trailing stop by your own, combine it with your strategy and I hope that you will make a lot of money with that!
❤️Please, support my work with like, thank you!❤️
I am part of Trade Nation's Influencer program and receive a monthly fee for using their TradingView charts in my analysis.

Not Every Candle Needs a Reaction — I Know I’ve GrownThere was a time I thought I needed to react to every move.
A clean candle? I’d enter.
A minor imbalance? I’d take the risk.
A zone that “looked okay”? I’d justify it.
Why? Because I was chasing something.
Chasing certainty .
Chasing profit .
Chasing control .
But here’s the thing I didn’t understand back then:
Not every candle needs a reaction. And not every move is my move.
🧠 Overtrading Wasn’t a Strategy. It Was a Symptom.
It was a symptom of fear — fear of missing out (FOMO).
It was a symptom of insecurity — not trusting my own process.
It was a symptom of impatience — not letting the market come to me.
I confused activity with progress. I thought being busy on the charts meant I was becoming better. But most of the time, I was just bleeding my edge.
💡 The Turning Point
Growth didn’t happen because I learned a new indicator. It happened the moment I started asking myself:
Is this my setup? Or am I just bored, hopeful, or triggered?
When you define a clear trading plan, with criteria you believe in, the real test isn’t finding setups...it’s waiting for the right ones. Today, I can watch the market move beautifully without me and feel absolutely nothing.
That’s freedom.
That’s growth.
That’s power.
🧘🏽♂️ From Reactive to Intentional
Now, I focus on:
Waiting for my specific SMC criteria to line up
Sticking to my CRT model (PDL/PWH sweep → BOS → FVG)
Trusting that missing one trade means nothing if I stay consistent
Letting the market come to me
I’m no longer in the game to prove something. I’m here to play my edge , manage my risk , and protect my mind.
📌 Final Words
Growth in trading isn't loud. It doesn’t scream from a winning streak. It shows up quietly:
in the trades you didn’t take.
in the silence between setups.
in the patience to do nothing until it’s time.
So if you’re not constantly in a trade, that’s not weakness that’s wisdom.

Gut Feeling Vs. Technical Analysis- How I Take TradesTrading Is Both Art and Science
Every trader, no matter how data-driven, eventually encounters moments when they just know something about the market.
That quiet internal signal:
“Don’t touch this today.”
Or: “Get ready. Something’s coming.”
That’s not random emotion. That’s your gut feeling – and in trading, it's worth paying attention to. But here's the catch:
👉 Gut feeling alone isn’t enough.
👉 Technical analysis alone isn’t either.
The real edge comes when both align.
________________________________________
What Is Gut Feeling in Trading?
“Gut feeling” is a term used to describe intuitive decisions that seem to arise without conscious reasoning. In trading, it often presents as a subtle inner nudge – a warning, a hesitation, or a surge of clarity.
Contrary to popular belief, it’s not just emotion. It’s often the result of:
• Unconscious pattern recognition from years (or decades) of chart-watching
• Internalized market behavior that doesn’t show up on an indicator
• Emotional awareness, sensing when the environment isn’t right to trade
Experienced traders know this isn’t “woo.” It’s pattern memory speaking quietly.
________________________________________
On the Other Hand: What We Call Technical Analysis?
We all know the tools: support/resistance, price action, indicators like RSI, MACD, Bollinger Bands, maybe Smart Money Concepts or just clean trendlines, etc.
Technical analysis gives us structure — measurable, repeatable setups. But let’s not pretend it captures everything:
• News can spike irrationally
• Liquidity can vanish when you least expect it
• And sometimes, the chart says 'yes' but the market mood says 'don’t trust it'
That’s where gut feeling becomes the final filter.
________________________________________
✅ Why I Wait for Alignment
Let’s be honest: most bad trades happen when you force action despite internal hesitation.
Here’s how I frame decisions:
✅ Full alignment
• Gut: Yes
• Technicals: Yes
• 👉 Take the trade
⚠️ Gut says no, but technicals agree
• Gut: No
• Technicals: Yes
• 🚫 Wait – something’s off
⚠️ Gut says yes, but technicals are unclear
• Gut: Yes
• Technicals: No
• 👁 Watch only – do not act
❌ No alignment
• Gut: No
• Technicals: No
• ✅ Stay out – smart decision
You’re not supposed to be in every trade. You’re supposed to be in the right trades.
________________________________________
🔍 Real-Life Example: Gold (XAUUSD)
Yesterday, Gold surged due to geopolitical escalation and renewed tariff tension.
Is looking bullish now: descending trendline broken, above 3350 which acts as confluence support.
📈 The chart said: “Buy.”
🧠 But my gut said: “ No. This is an emotional move. It’s not done correcting .”
So I stayed out.
Why?
Because if I trade while my gut says “no”, I second-guess every tick.
Even if the chart is right, I start hoping it fails — just to prove my feeling was right.
That’s emotional sabotage.
But when gut and chart say the same thing, I don’t hesitate.
Even if the trade loses, I’m at peace. I executed from clarity, not conflict.
That’s not just technical skill. That’s mental edge.
🧠 How to Develop Trustworthy Intuition
If you’re new or inconsistent, your “gut feeling” might just be fear, greed, or FOMO. But over time, real intuition can be trained like a muscle.
1. Screen Time
The more markets you watch, the more silent patterns your brain absorbs. Eventually, you’ll “feel” momentum shifts before indicators print them.
2. Journaling
Write down what you felt before each trade. Did it align with your plan? Over time, you’ll spot which feelings were intuition and which were impulse.
3. Meditation & Clarity
The more you control your emotional noise, the easier it becomes to hear real signals.
________________________________________
⚠️ Common Pitfalls: When Gut Feeling Betrays You
Let’s be clear – not every gut feeling is wise. Here are some red flags:
• Revenge trading disguised as confidence
• FOMO masked as intuition
• Fear of missing out during high volatility sessions
• Fatigue or stress, which distort perception
🧠 Tip: A real gut feeling comes with calm clarity, not urgency or adrenaline.
________________________________________
🎯 Final Thought
Gut Feeling + Technical Analysis = Peace of Mind
The best trades aren’t just technically correct — they’re internally clean. No doubt. No hesitation. No self-conflict.
Wait for alignment. Then execute with full presence.
Disclosure: I am part of TradeNation's Influencer program and receive a monthly fee for using their TradingView charts in my analyses and educational articles.

In Theory, You’re a Great Trader — In Practice, You’re Human🧠 10 Ways Trading Theory Falls Apart in Real Practice
Because in theory, you're rich. In practice, you panic-sold at support.
“In theory, there is no difference between theory and practice. In practice, there is.”
— Yogi Berra
Welcome to trading — where you read about patience and discipline, and then blow up your account chasing a breakout at 3AM.
Let’s explore the top 10 ways trading theory gets wrecked by real-world execution, complete with painful honesty and maybe a laugh or two (because crying is for after market close).
________________________________________
1. 🎯 In theory: You always follow your trading plan.
In practice:
You make a new plan after every trade.
That loss wasn’t part of “the plan,” so obviously the plan was wrong. Let’s fix it — during the trade — in real-time — while it bleeds. Genius.
________________________________________
2. 🧘♂️ In theory: You manage risk carefully.
In practice:
"Let me just move the stop... just this once... just 10 more pips..."
Before you know it, your stop loss is in the next timezone, and your trade is now a long-term investment.
________________________________________
3. 📊 In theory: Backtesting proves the strategy works.
I n practice:
Backtest = you, alone, with no emotions, clicking replay in TradingView.
Live trading = markets screaming, Twitter panicking, and you entering on the 1-minute chart because “it felt right.”
________________________________________
4. 💻 In theory: You’ll be objective.
In practice:
You saw one green candle and whispered:
“This is it. The reversal. I feel it.”
You weren’t objective. You were in a situationship with your trade.
________________________________________
5. 💰 In theory: R:R 2:1 minimum.
In practice:
You close at +0.3R “just to be safe” — and then it hits target 10 minutes later while you re-enter worse, and get stopped.
________________________________________
6. 🕒 In theory: You wait for confirmation.
In practice:
You anticipate confirmation. You hope for confirmation.
Spoiler: hope is not a strategy. But hey, at least you learned… again.
________________________________________
7. 🤖 In theory: You’re a rules-based, emotionless trader.
In practice:
You meditate, breathe deeply, journal, and then buy Gold after CPI with no stop loss and max leverage.
So much for being the Terminator.
________________________________________
8. 📚 In theory: More knowledge = better performance.
I n practice:
You read five books, memorized all candlestick names, and still entered long into resistance because it “looked bullish.”
Trading isn’t trivia night. It’s controlled decision-making under fire.
________________________________________
9. 😤 In theory: You’ll accept losses calmly.
In practice:
First you rage-quit. Then you revenge trade. Then you open ChatGPT and ask:
“Should I hedge this 80% drawdown?”
________________________________________
10. 📆 In theory: You’ll be consistent.
In practice:
You traded London Open on Monday, Asian Session on Tuesday, and New York close on Friday.
Consistency? You don’t even use the same time frame twice in a row.
________________________________________
🚧 So… how do you bridge the gap?
1. Journal your trades — honestly. Especially the emotional mess-ups.
2. Create rules you can actually follow — not Instagram-quote rules.
3. Simulate real conditions — including drawdowns, boredom, and fakeouts.
4. Accept that mistakes are part of the job — and build for resilience, not perfection.
5. Trade small enough that you don’t care much — so you can learn while surviving.
________________________________________
🎯 Final word:
Trading theory is like a clean whiteboard.
But the market? It’s a chaotic toddler with crayons and no rules.
If you can operate inside that chaos — with clarity and emotional control — that’s when the theory starts working.

Learn What Time Frame to Trade. Gold Forex Trading Basics
If you just started trading, you are probably wondering how to choose a trading time frame.
In the today's post, I will go through the common time frames, and explain when to apply them.
1m; 5m, 15m Time Frames
These 4 t.f's are very rapid and are primarily applied by scalpers .
If your goal is to catch quick ebbs and flows within a trading session, that is a perfect selection for you.
30m, 1H Time Frame
These 2 are perfectly suited for day traders.
Executing the analysis and opening the trades on these time frames,
you will be able to catch the moves within a trading day.
4h, Daily Time Frames
These time frames are relatively slow .
They are mostly applied by swing traders, who aim to trade the moves that last from several days to several weeks.
Weekly, Monthly Time Frames
These time frames reveal long-term historical perspective and are mostly used by investors and position traders.
If your goal is to look for buy & hold assets, these time frames will help you to make a reasonable decision.
📝When you are choosing a time frame to trade, consider the following factors :
1️⃣ - Time Availability
How much time daily/weekly are you able to sacrifice on trading?
Remember a simple rule: lower is the time frame, more time it requires for management.
2️⃣ - Risk Tolerance
Smaller time frames usually involve higher risk,
while longer-term time frames are considered to be more conservative and stable.
3️⃣ - Your Trading Goals
If you are planning to benefit from short term price fluctuations you should concentrate your attention on lower time frames,
while investing and long-term capital accumulation suite for higher time frames.
Time frame selection is nuanced and a complex topic. However, I believe that these simple rules and factors will help you to correctly choose the one for you.
❤️Please, support my work with like, thank you!❤️
I am part of Trade Nation's Influencer program and receive a monthly fee for using their TradingView charts in my analysis.

How to Read Market Depth in TradingViewThis tutorial video covers what Depth of Market (Market Depth) is, how to read it, and how traders might use it.
Learn more about trading futures with Optimus Futures using the TradingView platform here: optimusfutures.com/Platforms/TradingView.php
Disclaimer: There is a substantial risk of loss in futures trading. Past performance is not indicative of future results. Please trade only with risk capital. We are not responsible for any third-party links, comments, or content shared on TradingView. Any opinions, links, or messages posted by users on TradingView do not represent our views or recommendations. Please exercise your own judgment and due diligence when engaging with any external content or user commentary.
Order flow and DOM data reflect market participant activity but do not guarantee future price movement or execution certainty. These tools are best used as part of a broader trading strategy that includes risk management and market understanding.

Structure Over Sentiment: Multi-Asset View into Month-End📊 Structure Over Sentiment: Multi-Asset View into Month-End | May 30, 2025
This isn’t a crash. This isn’t a rally. This is digestion.
The multi-asset view tells the real story — and it's not as chaotic as it looks.
🔍 What the Chart Shows:
This correlation lens plots key macro and market drivers YTD:
🟣 Gold (XAUUSD): Leading with +24.71% — this is the quiet macro bid no one’s talking about
🟢 Bitcoin (BTCUSD): Holding +8.47% — volatile, but still showing risk appetite
🔴 10Y Yield (US10Y): Up +5.31% — signalling rates peaking
🟠 Nasdaq (NDX): Nearly flat, -0.36% — NVDA strength masking internal rotation
🔵 S&P 500 (SPX): -2.32% — structurally fine, just not euphoric
🔵 Dow (DJA): -5.91% — lagging, cyclical drag
🔵 Russell 2000 (RTY): -13.60% — small caps under pressure, risk-on caution flag
🟣 Dollar Index (DXY): -6.44% — fading after a strong Q1
🟢 Oil (WTIUSD): -10.26% — no inflation panic here
🧠 Key Insight:
Despite the tariff headlines, sticky PCE, and conflicting narratives — the market remains internally consistent.
Gold is leading
Yields are rising but not sharply
Bitcoin is positive
Equities are flat-to-negative
Oil is weak
Dollar is fading
This is classic late-cycle digestion, not a crisis.
🛡️ Titan Mindset Check-In:
Don’t get lost in single headlines
Follow structure, not speculation
Let leaders lead (NVDA, Gold, BTC)
Protect equity when breath narrows
Zoom out, reduce noise, trade the curve — not the chaos
📍“Volatility isn’t risk. Misinterpretation is.”
Take Profits, Not Chances.
#MultiAssetView #StructureOverShock #TitanProtect #SPX #NDX #BTC #Gold #DXY #WTI #US10Y #MacroFlow #MarketMindset #LateCycleSignals #DigestDontPanic

How Forex Brokers Manipulate Your Trading. Real Examples
Your Forex broker could be manipulating your trades right now - and you would not even know it.
They can rig your charts, trap you in losing trades and steal your money.
In this article, I will expose how they do it, I will show you a real example how broker's manipulations can lead to bad trading decisions and significant losses.
What I’m about to show you will change the way you trade forever, and you’ll never look at your trading charts the same way again.
The story started with a trading live stream in my academy with my students.
We spotted a nice setup to trade.
We found a strong 4H support on Silver with a confirmed liquidity grab after its test.
As a confirmation, we identified a cup & handle pattern on an hourly time frame and a breakout of its neckline with a bullish imbalance.
When I got my entry signal, I opened my trading terminal to execute the trade.
And the way I trade is very specific: I use TradingView for chart analysis BUT I have a separate trading terminal for trade execution.
When I opened the same setup in my trading terminal, I saw a completely different picture and a strong bearish signal.
The broker that I use for technical chart analysis is OANDA , while my trading terminal uses ICMarkets quotes.
On the right is the price chart of SILVER with IC.
There we can see a valid breakout and a candle close below the support with its consequent retest.
From a price action perspective, it is a strong signal to sell .
I got a strong feeling that some kind of manipulation is going on here, so I decided to check Silver charts of other brokers.
Only the broker that I used for market analysis on TradingView provided a bullish signal, while other brokers had very bearish charts on Silver.
It looked very suspicious and felt like OANDA broker was inducing me to buy, knowing that the price is going to drop. So I made a decision not to take a trade.
Look what happened then.
After a retest of a broken support, Silver dropped sharply.
Checking the same trading setup on different brokers' charts can help you to avoid the manipulation.
My simple decision to examine more charts helped to avoid a losing trade.
I strictly recommend you doing the same thing before you place a trade.
IF you see a strong deviation of your charts from other brokers, stay alert and vigilant. Probably it is not a good idea to open the trade.
❤️Please, support my work with like, thank you!❤️
I am part of Trade Nation's Influencer program and receive a monthly fee for using their TradingView charts in my analysis.

How to Use Stop Losses in TradingViewThis video covers stop loss orders, explaining what they are, why traders use them, and how to set them up in TradingView.
Disclaimer:
There is a substantial risk of loss in futures trading. Past performance is not indicative of future results. Please trade only with risk capital. We are not responsible for any third-party links, comments, or content shared on TradingView. Any opinions, links, or messages posted by users on TradingView do not represent our views or recommendations. Please exercise your own judgment and due diligence when engaging with any external content or user commentary.
The placement of contingent orders by you or broker, or trading advisor, such as a "stop-loss" or "stop-limit" order, will not necessarily limit your losses to the intended amounts, since market conditions may make it impossible to execute such orders.

Trading Gold? Know the Difference Between XAU/USD and Futures🔎 Let’s address a question I get very often:
“Should I trade spot gold (XAU/USD) or Gold futures?”
It might sound like a technical decision, but it’s actually about how you approach the market, your risk profile, and your experience level.
So let’s break it down 👇
________________________________________
🟡 Two ways to trade the same asset
Both spot and futures allow you to speculate on the price of Gold. But they’re two very different beasts when it comes to execution, capital, and strategy.
________________________________________
1️⃣ Spot gold (XAU/USD)
• Traded mostly via Forex brokers or CFD platforms
• No expiration — you can hold the position as long as you want
• Often used by retail traders for day trading or swing setups
• You can open small trades (even 0.01 lots)
• Costs include spread, swap fees if you hold overnight
• Leverage is usually high — up to 1:100 or more
• Margin is required, but typically lower than in futures
💡 Spot is flexible and accessible, but you pay the price through overnight holding costs, wider spreads during volatility, and slippage. On some brokers, especially during high-impact news, your platform might even freeze or delay execution — and that’s a serious risk if you’re not prepared.
________________________________________
2️⃣ Gold futures (GC)
• Traded on major futures exchanges like CME
• Contracts have a fixed size (usually 100 oz)
• They expire monthly, so you need to manage rollovers
• Common among hedge funds and experienced traders
• You pay commissions and exchange fees, but no swaps
• Margin is required here too — but it's much higher
💡 Futures are structured and professional — but they demand more capital, stricter execution discipline, and higher margin requirements. Just like in spot trading, margin is a collateral deposit, not a cost — but with futures, the bar is set higher.
________________________________________
⚖️ So, which one is for you?
If you're using MetaTrader or any platform offered by a Forex/CFD broker, and you're a scalper, intraday, or swing trader working with flexible position sizes...
→ You're probably better off with spot gold (XAU/USD).
If you're trading big volume, managing diversified portfolios, or involved in hedging large exposure...
→ You should consider futures — but expect to level up your game, capital requirements, and discipline.
________________________________________
🧠 Mindset:
Don’t confuse accessibility with simplicity.
Just because spot Gold is easier to open doesn’t mean it’s always the best choice.
Just because futures look “pro-level” doesn’t mean they’re always worth it for a retail trader.
Understand your tools. Pick the one that aligns with your structure. That’s how you stay in the game. 🎯
________________________________________
📚 Hope this cleared it up. If you want me to cover execution setups for each one, let me know in the comments.

Stop Watching Your Trades All Day!How to Break Free from Screen Addiction and Become a More Focused, Profitable Trader
Have you ever found yourself glued to your screens, watching every tick of the market, feeling your stress levels spike with every price fluctuation?
If so, you’re not alone.
Most traders, at some point, fall into this trap.
It feels productive, even necessary, to monitor your trades constantly.
But the reality is that it’s one of the most damaging habits you can develop.
In this article, I’ll show you why this behavior is hurting your trading results and how to break free from it, so you can trade smarter, stress less, and live more.
________________________________________
⚠️ The Cortisol Trap – Why Watching Every Tick is a Psychological Minefield
Every time you check the market and see a fluctuation in your trades, your body releases cortisol, the primary stress hormone.
While cortisol is useful in fight-or-flight situations (like dodging a car on the street), it’s terrible for trading.
Here’s why:
• Cortisol reduces rational thinking – It pushes your brain into reactive mode, not analytical mode.
• It triggers impulsivity – You become more likely to close winning trades too early or move your stop loss in desperation.
• It burns your mental energy – Leaving you drained, unfocused, and emotionally volatile.
Simply put: Too much screen time = too much cortisol = bad trading decisions.
If you want to win consistently, you need to break this cycle.
________________________________________
🎯 Distraction from Higher Priorities – Why Trading Should Be a Part of Life, Not All of It
Trading is meant to give you freedom — not steal it.
Yet, too many traders become slaves to the screen, obsessing over every tick.
But here’s the truth:
You don’t need to be in front of your screen all day to be a great trader.
In fact, doing so can rob you of the mental clarity and emotional balance needed for high-quality trading.
When you step away from the charts:
• You give your strategic mind time to work,
• You focus on other important aspects of life — family, health, personal growth,
• You develop a longer-term perspective on the market, which is crucial for real success.
Balance is the key to sustainable success, both in trading and in life.
________________________________________
✅ 3 Benefits of Breaking Free from Screen Addiction
✅ Benefit #1: Better Decision-Making
When you stop reacting to every tick:
• You make calmer, more rational trading decisions,
• You avoid low-probability setups and revenge trading,
• You focus on quality over quantity.
Instead of jumping on every tiny move, you become a strategic sniper in the market, waiting for high-probability setups.
________________________________________
🧘 Benefit #2: Improved Quality of Life
Life is not just about trading.
Reducing screen time frees you up for other meaningful activities:
• Exercise,
• Hobbies,
• Time with family and friends.
A well-rounded life supports better mental health, which, in turn, improves your trading performance.
Remember, a clear mind is a profitable mind.
________________________________________
⏱️ Benefit #3: Increased Productivity
Believe it or not, less screen time = more productivity.
Why?
Because you’ll:
• Spend less time reacting and more time preparing,
• Conserve your mental energy for important decisions,
• Create time for deep market analysis instead of random impulse trades.
This disciplined approach leads to better trading outcomes over time.
________________________________________
🔔 How to Trade with Less Screen Time – 3 Practical Step s
🔔 Action #1: Use Alerts Wisely
Instead of staring at charts all day, let technology work for you:
• Set alerts at key price levels,
• Use trading apps to get notifications when your levels are hit,
• Let the market come to you — not the other way around.
Example: If you want to buy Gold at 3200 support, set an alert and go for a walk.
You’ll be notified when price approaches, so you can act, not react.
________________________________________
📅 Action #2: Create a Balanced Schedule
Build a daily routine that includes more than just trading:
• Morning exercise,
• Reading or journaling,
• Spending time with loved ones,
• Working on long-term goals.
When you’re mentally balanced, you’ll trade better and more profitably.
________________________________________
📊 Action #3: Review Your Trading Plan Regularly
Spend time reviewing your trades instead of watching them:
• Look at your journal,
• Analyze your stats,
• Identify mistakes and strengths.
This should only take once a week — and it’s far more valuable than hours of pointless screen time.
________________________________________
🧠 Final Words
As the saying goes:
“Sometimes, less is more.”
Stop watching your trades all day.
Lower your stress, regain your focus, and remember why you started trading in the first place — to build wealth and live freely, not to become a slave to the screen.
Trade well.
Build wealth.
Live fully. 🚀
Disclosure: I am part of Trade Nation's Influencer program and receive a monthly fee for using their TradingView charts in my analyses and educational articles.