Big Bank Imbalance Strategy (Go With The Flow) Example on 1 hour EurChf Chart for Friday ( sell trade, but can do on buy trade too)… its Friday: Don't be greedy).
Note the following:
1) Big Banks selling (note large 1 hour candlesticks- on charts)- only people that can do that are big banks and/or institutions (not retail traders).
2) Two areas of sell imbalance (they must be filled with buy either today or in the near future). In all probable's, I would side with today and big banks are just selling to buy back later today - because the big banks do not want many imbalances when Forex is closed (and/or the weekend)
3) Look for a higher bullish LOW and higher CLOSE candlestick for your reason to enter into a long and/or setting up buy trade soon.
4) After the #3 above has happen (wait patiently)- why? because that candle happened at 3:00 a.m. and/or after Tokyo closed and before NY session opened.
London session does three more hours of accumulation 1 hour candles (see large bottom & top wicks- both buying and selling pressure)- so all big banks and institutions are happy with the current price at this moment.
5) When NY session opens, what happens? Big banks and institutions are buying (large candles)- your sign to by was actually the 1hour sell candlestick (red) before the large blue candlestick happened. Why? because the big banks and/or institutions are trying to tell you to sell, but you being smart did not fall for that one, right? You said above price action are two areas of sell imbalance that I except to be fill today, so I will plan to buy when that pa reverses and goes north and/or blue above that last red candlestick.
*On Chart related to its Friday & both scalpers and/or day traders should not be holding over the weekend. Why? because Forex is closed and when Forex starts back up- their could be small or large GAPS which take you out, which you have zero control over. Trading is 100% on you, your decisions only- control as much as you can- do not give your broker and/or big banks or institutions any more control then they already have in the Forex world.
If you are scalping and/or day trading these Big Bank imbalance strategy should be 1:1 or: 1:2 risk reward maximum. You can trade this of course buy or sell on pairs. You need to always use risk management. This trade would have seen you doing a 1:1 RR with 17 pip stop vs 17 pip target. Trading is not about pips that you make, but the risk that you take= PER TRADE.
Trading Plan

How Does Forex Market Work?How does Forex market work?
As a trader, you decide if you would like to buy or sell. The broker finds someone who would like to do the opposite and they introduce the two of you. The broker then takes a small cut (spread) of the transaction price for arranging the connection. Foreign exchange is largest liquid market in world, but what does that mean? Has a daily roll over of 6.6 trillion dollars. It means that the broker can always find "the other side" very easily and quickly. This is good if you want to enter a trade immediately and great if you wan to get out of a trade very quickly.
Best thing about Forex is:
Markets which are not liquid, or have low trading volume, can be difficult to trade. Imagine you were in a losing trade and you wanted to get out of it. If the broker can't find "the other side" then you are stuck! That will not happen when trading FX. There is always someone on the other side- a major benefit.
Forex exchange is essentially for international business. Forex markets include governments, businesses & investors. Forex, also known as foreign exchange or FX trading, is the conversion of one currency into another. It is one of the most actively traded markets in the world, with an average daily trading volume of $6.6 trillion. Forex, or foreign exchange, can be explained as a network of buyers and sellers, who transfer currency between each other at an agreed price. It is the means by which individuals, companies and central banks convert one currency into another – if you have ever travelled abroad, then it is likely you have made a forex transaction. While a lot of foreign exchange is done for practical purposes, vast majority of currency conversion is undertaken with the aim of earning a profit. The amount of currency converted every day can make price movements of some currencies extremely volatile. It is this volatility that can make forex so attractive to traders: bringing about a greater chance of high profits, while also increasing the risk.
Unlike shares or commodities, forex trading does not take place on exchanges but directly between two parties, in an over-the-counter (OTC) market. The forex market is run by a global network of banks, spread across four major forex trading centers in different time zones: London, New York, Sydney and Tokyo. Because there is no central location, you can trade forex 24 hours a day. Most traders speculating on forex prices will not plan to take delivery of the currency itself; instead they make exchange rate predictions to take advantage of price movements in the market.
What moves Forex markets?
The forex market is made up of currencies from all over the world, which can make exchange rate predictions difficult as there are many factors that could contribute to price movements. However, like most financial markets, forex is primarily driven by the forces of supply and demand, and it is important to gain an understanding of the influences that drives price fluctuations here. Central banks, News reports, Market sentiment, Economic data, Credit ratings.

WHY 95% OF TRADERS DO NOT SUCCEED?
The evidence suggests that only a very small proportion of day traders makes money year over year.
There are certain patterns which may separate profitable traders from those who ultimately lose money. And indeed, there is one particular mistake that in our experience gets repeated time and time again. What is the single most important mistake that led to traders losing money?
Here is a hint – it has to do with how we as humans relate to winning and losing.
Our own human psychology makes it difficult to navigate financial markets, which are filled with uncertainty and risk, and as a result the most common mistakes traders make have to do with poor risk management strategies.
Traders are often correct on the direction of a market, but where the problem lies is in how much profit is made when they are right versus how much they lose when wrong.
Bottom line, traders tend to make less on winning trades than they lose on losing trades.
Humans aren’t machines, and working against our natural biases requires effort. Once you have a trading plan that uses a proper reward/risk ratio, the next challenge is to stick to the plan. Remember, it is natural for humans to want to hold on to losses and take profits early, but it makes for bad trading. We must overcome this natural tendency and remove our emotions from trading.
That will help you to be a consistently profitable trader.

WHY THE RICH GET RICHER
The general trend, in a capitalist economy governed by private property, would be for the rich to get richer—for inequality to increase steadily over time. That had been true in the initial stages of industrialization and remains the fact nowadays.
One reason: The wealthiest 1 percent put three-quarters of their savings into investment assets. By contrast, the middle class had 63 percent of their assets tied up in their homes, with home equity accounting for about a third since they have large mortgage debt.
The differences reflect the greater share of high-yield investment assets like stocks in the portfolios of the rich and the greater share of housing in the portfolio of the middle class.
Of course, the rich can afford to lose more—so they can take more risks and make more when times are good. But the lesson is clear: the wealth gap is caused in large part by the investment gap.
Some other psychological reasons should be considered as well, they are nicely reflected on the chart above, so spend some time to examine that.

Stop using bullish/bearish - how markets work - pt.1Stop using the words bullish and bearish in trading, these are emotion-based terms, add these terms to your vocabulary instead:
1. Accumulation
2. Distribution
3. Mark-up
4. Mark-down

10 things to remember about bear markets, volatility, and panicTrading & investing is not easy. If it were, everyone would be rich.
One of the most difficult moments for all traders, and especially investors, is when markets are abnormally bearish, trending downward or in a direction that goes against their positions. Adding to that difficulty is when volatility is rising and when uncertainty is high. These events have occurred throughout market history and should be expected. Every trader or investor should remember a simple truth: markets will go against you at some point. Be prepared.
Learning to trade or invest in bearish and volatile markets requires great skill, experience, and composure. The last 12 months has demonstrated that. Stocks, bonds, forex, crypto, and futures have seen heightened volatility over the last 12 months. So what should we do? What now?
Let's revisit the basics - the skills, traits, and mindset that are required to survive these moments.
1. Plan ahead 🗺
Plan your trade, trade your plan. Every trade, every investment, should have an underlying plan. Write out the basic questions before you buy or sell. For example, what is your desired entry price? What is your desired exit price? What is your stop loss? How much money are you risking? Why are you making this trade or investment in the first place? In times of volatility, these questions matter more than ever. Get back to the basics.
2. Don't rush 🧘♂️
Volatility, and especially market panic, cause people to make quick reactions. The pressure, the fast price action, often forces people to act without a moment to revisit their original plan. Don't do this! Take your time. Stay composed and deal with the hand you have been dealt.
3. Be patient with entries 🎯
Many traders & investors speak of buying dips, but this phrase does explain the steps required. You don't buy dips without a plan. You plan out your strategy, you wait for the perfect entry, and you let the market come to you. When the market is in a downtrend, and volatility is high, it is paramount that you remain patient, waiting for the perfect entry. Use limit orders wisely.
4. Know your timeframe ⏰
Are you trading for one day? One month? Or 5 years? These basic questions will remind you of what you're trying to accomplish and how rushed or patient you should really be. They will also remind you about the chart you should be looking at, whether you should be zoomed in to a 30-minute chart or zoomed out to a weekly chart, showing years of price histort.
5. Have an exit strategy 🚨
An exit strategy means that no matter what happens, you know where your stop loss is and you know where your profit target is. No matter what happens, up or down or sideways, you have an exit plan. Do not leave any entry or exit up to chance. Create your exit strategy before you place the trade and follow it.
6. Tighten position size 💪
Added volatility and uncertainty needs to be factored into your game plan before it begins in the first place. However, many new investors and traders forget to do this. If that's you, it's time to adjust your strategy, your plan, for larger trading ranges, volatility. The year-long trends that defined a previous market are now less valid.
7. Zoom out for historical context 🔎
Zoom out on your charts. Then keep zooming out. And now zoom out some more. Circle the latest candle, line or price movement and let it serve as a reminder about where price is today vs. where it came from. There's a saying: when in doubt, zoom out. Do not to get lost in the moment, looking only at the day or week, but instead go research the entire history of price. Learn about what has happened in the past.
8. Cash is a position 💸
Want to dollar cost average into a trade? Want to buy more? Want to trade more? You need cash to do that. There is comfort in being able to participate in the volatility whenever you want. Cash is a position and guarantees this.
9. Avoid panic, FUD, and FOMO 😳
When emotions are running high, some of the biggest psychological mistakes can occur. FUD stands for fear, uncertainty, and doom. FOMO stands for fear of missing out. These are two common emotions in crashing markets. On one hand, everyone thinks the end is near and then on the other hand every little up move is the next bull run. Do not let these emotions take you.
10. Take a break 😀
Sometimes it helps to step away. Log out, close your apps, get outside and get some exercise. Come back to the markets when you're ready. Your mind will also be well rested now.
We hope you enjoyed this post and we hope it helps you as you navigate the markets.
Please feel free to write any additional tips or pieces of advice in the comments section below!

5 Elements of a Smart Trade Plan
Find out why you should have a trade plan—and the five elements that may help you put it to work successfully.
Element 1: Your time horizon
How long do you plan to hold a position? This will depend on your trading strategy. Generally, traders fit into one of three categories:
Single-session traders are very active and look to gain from small price variations over very short time periods (minutes or hours) throughout the trading day.
Swing traders target trades that can be completed in a few days to a few weeks.
Position traders seek larger gains and recognize that it often takes longer than a few weeks to achieve them.
Element 2: Your entry strategy
Look for entry signals—for instance, divergences from trend lines and support levels—to help you place your trades. The signals you employ and the orders you use to make good on them hinge on your trading style and preferences.
Element 3: Your exit plan
When it comes to an exit strategy, plan for two types of trades: those that go in your favor and those that don’t. You might be tempted to let favorable trades run, but don’t ignore opportunities to take some profits.
Element 4: Your position size
Trading is risky. A good trade plan establishes ground rules for how much you’re willing to risk on any single trade. Say, for example, you don’t want to risk losing more than 2%–3% of your account on a single trade. You could consider exercising portion control, or sizing positions, to fit your budget.
Element 5: Your trade performance
Look over your trading history to calculate your theoretical trade expectancy, meaning your average gain (or loss) per trade. You start by determining the percentage of your trades that have been profitable versus those that haven’t. This is known as your win/loss ratio.
Understanding what goes into a smart trade plan is the first step to prepare you for your next trade.

Exit Strategies to Consider on Each Trade: a Complete GuideEnter, monitor, and exit are three vital steps to follow while trading. While most traders focus on how and when they can enter a particular setup, they pay less attention to their exit strategy. Today, we are gonna look into some popular exit strategies that we utilise in our personal trading.
1) Breakeven closure
When the price is moving in our direction and is already a few key zones away from the entry zone, we make the trade risk-free by moving the Stop Loss level to the price of entry.
If the Stop Loss gets hit, we exit the trade with neither a gain nor a loss.
2) Manual Closure
In the process of monitoring, if the price does not play out according to our plan, we tend to make quick decision and exit the trade earlier than planned.
3) Target Profit
We set a Take Profit (TP) order that closes the transaction as soon as it gets triggered.
4) Stop Loss
We set a Stop Loss (SL) order that closes the transaction as soon as it gets triggered.

🌱Weekly quote: We know what we're doing wrong🌱🟢For many of us, our trading accounts are our cluttered homes. What we desperately need is to find our inner quiet; review our trades and trading statistics in detail and truly experience the horror of betraying our potential; and fully appreciate what we do well and embrace it with gratitude. Out of that energized awareness, we can replace the clutter with what is meaningful.
Our great enemy is routine. Many times, we know what we're doing wrong, but we keep making the same mistakes. Indeed, that is the way of life's curriculum. If we fail to learn from the first lesson, we get a second and a third and a fourth: one painful opportunity after another to commit to a different path. Is that failure, or is that something to be grateful for: a curriculum that is trying, trying, trying to teach us the lessons we need to learn to be successful?
🟢We've seen that gratitude is an essential component of psychological well-being. The grateful trader is not self-focused, absorbed in how much money they could/should make. The grateful trader is thankful for the opportunities coming their way. When we look heavenward with thanks for what we've accomplished, there is an essential humility to our perspective. It's not just about us. It's not just about profits and losses.
A great metric in evaluating your trading journal is to count the number of frustrated statements versus the number of grateful ones. A great metric in evaluating other traders is to count the number of self-aggrandizing statements with the number of humble, grateful ones.
🟢If losses are opportunities to learn and improve, we can sustain a grateful mindset even in times of adversity. A humble mindset is one looking to learn. A grateful mindset appreciates every opportunity to grow.
A life perspective that instills and strengthens humility grounds us in the awareness that there is always something more important than me. There is always something more significant than what is simply happening here and now. We cannot succeed in trading--or any life endeavor--if it becomes our end-all and be-all. Once trading and P/L are placed on a pedestal, they control us and our experience. And that is precisely what interferes with profitability!
It's great to correct your mistakes, but it's in your shining successes that you can find your path to fulfillment--and your future in markets. Hidden in your winning trades may be the key to your development as a trader.
🟢 So many developing traders look for one edge after another, one market after another, one trading style after another--all in a frantic search for success. The reality is that our best trading is hiding in plain sight, when we explore what we're trading and how we're trading it when we're most fulfilled and successful.
Brett Steenbarger, Trading Psychology

🟢TRADING HACKS: A MIX OF TRADING ADVICE, ROUTINE, GOOD HABITS🟢When you open your charts in the beginning of the day, don't rush into first trade you see.
Step back for a little while, and check in with your emotions. If you want to trade cause you didn't have a trade in a while, or you're bored, or you want to make your money back, or if you just want to make money and now you "know the market will go up (down)" - these all are signs of emotional imbalance. if you feel like this, it's better just to make a pause. Yes, it can be hard to do it by the way, but you need to make it through your will effort.
So, instead of putting a trade right away, go through your multitimeframe analysis, mark up the zones and set your alerts for zones you really like. more on this here
While you're waiting for alerts to go off, you can do a lot of useful things for your trading.
first of all, go through your checklist or trading plan, or a journal, and remind yourself how your best, high-quality setups look like.
Now go back to previous week or two, and just look in hindsight for your highquality patterns, whatever strategy you use. See how market developed and find entry points which will be in line with your rules. You can even make a step further and journal these hindsight trades in a separate journal (I call it mark ups, or "missed trades"). This simple action will train your pattern recognition skills and also develop a habit of working with a journal. In the future you'll come back to these trades for reference of how your best setups can look like.
Now, if the alert is still not activated, do some backtesting, 5-10 trade would be enough, but also journal these trades.
Doing this, you're already few steps ahead of your competitors become not many people are willing to put such kind of effort in their trading.
Well done, and now it's time to go and check how the market is developing. More on building the routing and good habits you can read in this series of posts

The Evolution of a Trader | 3 Milestones 📈
Hey traders,
In this educational article, we will discuss 3 stages of the evolution of a trader.
Stage 1 - Unprofitable trader 😞
The unprofitable trader has very typical characteristics:
-total absence of trading skills
Most of the time, people open a live account simply after completing some beginners course like on babypips website.
Being sure that the obtained knowledge are completely enough to start trading, they quickly face the tough reality.
-no trading plan
Having just basic knowledge, of course, they do not have a trading plan. Why the hell to have it if everything is so simple?!
All their actions on the market is just gambling. They open the positions randomly most of the time, simply relying on intuition.
-poor risk management
In 99% percent of the time, the unprofitable trader does not even think about risk management. The position sizing, stop placement and target selection are completely neglected.
Trading performance of the unprofitable traders is characterized by small wins and substantial losses and negatively trending equity.
Stage 2 - Boom and bust trader 😶
Usually, traders reach boom and bust stage after 1-2 years of unprofitable trading. At some moment, winning trades start to compensate losing trades, brining non-trending equity.
Such traders have very common traits:
-not polished trading plan
Being unprofitable for so long, traders start to realize the significance of a trading plan.
Sticking to the set of rules, they notice positive changes in their trading performance.
However, trading plan requires to be polished and modified. It takes many years for a trader to identify all its drawbacks before it starts bringing net profits.
-lack of confidence
When one starts following a trading system, confidence plays a substantial role.
The fact is that even the best trading strategy in the world occasionally produces negative results. In order to not give up and keep following such a system, one needs to build trust in that.
The confidence that after a series of losing trades, the strategy will manage to recover.
Such a trust can be built after many years of trading that strategy.
Stage 3 - Profitable trader ☺️
That is the final destination.
After many years of a struggling trading, one finally sees positively-trending equity. Winning trades start to outperform losing ones, leading to consistent account growth.
Profitable trader is characterized by iron discipline, confidence and consistency.
He knows what he is trading, when and why. His trading plan is polished, he fully controls his emotions.
He never stops learning and constantly develops his strategy.
Knowing the 3 stages of the evolution of a trader, one can easily identify at what stage he currently is. That will help to identify the things to be focused on to move to the next stage.
At what stages are you at the moment?
❤️If you have any questions, please, ask me in the comment section.
Please, support my work with like, thank you!❤️

WHAT IS LEVERAGE IN FOREX?
“Leverage” means using a small amount of your own money in order to control a much larger amount of money. Typically, you borrow the remaining amount through your broker.
For example, say you want to control a $50,000 position. Your broker might put aside $500 of your own money and borrow the remainder. You now have control over the $50,000 with just $500 from your own account, so your leverage ratio is 100:1.
Now, let’s say the $50,000 investment rises by $500, so the full position is now worth $50,500. If you were liable for the full $50,000 (representing a 1:1 ratio), this is only a 1% return on your investment. However, since you only put in $500 of your own capital, the $500 increase represents a 100% return on your investment – that’s way more exciting!
Now, it’s important to understand that this cuts both ways. If you lost $500 instead of gaining $500, you would see a -100% return on your investment. Yikes! If you had a 1:1 ratio and put in the full $50,000 you would only see a -1% return.
How Much Can You Leverage in Forex?
Before you open an account with a broker, you’ll want to check the maximum leverage ratio that you’ll be able to use. The higher the ratio, the bigger your potential gains or losses. Brokers will usually offer 50:1, 100:1, 200:1, or 400:1 ratios.
A typical ratio on a standard lot account is 100:1, and a mini lot account will often offer a 200:1 ratio. If you start trading at 400:1, be wary of using small deposits to control large capital, as these can disappear quickly with the volatility of large sums. Lower leverage keeps you safer from mistakes, while higher leverage could bring in higher rewards.
How Leverage Affects Your Trading ✅
As we’ve seen, leverage is a powerful tool that can help you win big in the forex market. You can use less capital to control greater positions, giving you flexibility and amplifying your profits. However, it can just as easily amplify your losses.
At very high levels, leverage starts to damage your odds of success. Transaction costs represent a higher percentage of your margin the greater your position is. This means that transaction costs already put you at a disadvantage with excessively high leverage.

Candlestick Rejection Strategy!
What it is?
Candlestick rejection strategy is a pure price action swing trading strategy. It makes use of the concept of price rejection or candlestick rejection patterns to invalidate counter-trend momentum for a trade continuation.
By applying such candlestick rejection strategy onto swing trading, it allows trades to capture spots at which market prices are at rest during retracements before rejoining back the existing dominant trend.
How to use?
Some trade recommendation for such candlestick rejection strategy is to use it as a candlestick rejection pattern on counter-trend moves. This means that we pick candlestick rejection pattern only for the sake of searching for breakout continuation with the dominant trend at counter trend waves.Entry can be made after the breakout occurs at the high or low of The Mother Bar and stop loss order can be placed at the opposing breakout side's high or low.
Further trade help can also be incorporated to help increase the trade's probability of success. For instance, it can be used together with other technical tools such as dynamic moving averages and Fibonacci retracement tool. Some may even want to consolidate other trading strategies to further increase trade’s probability of success.
Thank you for reading, we hope you enjoyed our educational effort!

Market Structure(Downtrend)This is how I view market structure once it becomes more rigid than smooth.

HOW TO GET RICH?
1. Money mindset is everything
You need to have a positive money mindset when it comes to creating wealth. Everyone carries a money story and it’s your job to understand what yours is and if it’s holding you back. Reframing your story to a millionaire’s mindset is essential for success because rich people think differently. How to get rich can’t be a passing phase in your life; it takes work and commitment.
2. Millionaires still budget
Hard to believe, but it’s true. Even millionaires follow a budget. The biggest secret on how to get rich and stay rich is spending less than you bring in. There will always be wants that exceed budget limits, even for millionaires, because there is not an unlimited supply of money.
3. Money management is key
Good money management is so important to get rich and stay rich. Money management is a behavior and habit. You need to be mindful of where you are investing and spending your money. There is a specific strategy to growing your wealth and maintaining it and you must follow it like you do a workout regime.
4. Invest your money for growth
Investing in assets that will appreciate over time and provide you with a return on your investment such as dividend or interest payments is smart. The goal is to build your asset portfolio and make it so strong that you can live off the passive income in your retirement.
5. Build your business around your personal financial goals
As a business owner you have more control over the money you make versus being an employee with a set salary. If you want more money in your pockets, you can increase your revenue and your profit margins to ensure you are taking home more money. The more profits you have in your business the more you can pay yourself a dividend or bonus, depending on the legal structure of your business.
6. Create multiple income streams
Smart business owners create more than one income streamas it protects them from fluctuations in the market. That means if one source of revenue dries up due to market conditions, other sources of income can protect you from a loss.
7. CONCLUSION:
The bottom line is that knowing how to get rich is something that is learned. There are no guarantees that if you start a business that you will get rich because even the best business ideas fail due to poor execution. But if you educate yourself and get help in making your business a success, you will increase your chances of success.

✍️WEEKLY QUOTE: You don't need to know in order to make money✍️...Having an awareness or an understanding of some principle, insight, or concept doesn't necessarily equate to acceptance and belief. When something has been truly accepted, it isn't in conflict with any other component of our mental environment. When we believe in something, we operate out of that belief as a natural function of who we are, without struggle or extra effort. To whatever degree there is a conflict with any other component of our mental environment, to the same degree there is a lack of acceptance. It isn't difficult, therefore, to understand why so few people make it as traders. They simply don't do the mental work necessary to reconcile the many conflicts that exist between what they've already learned and believe, and how that learning contradicts and acts as a source of resistance to implementing the various principles of successful trading.
The answer is quite simple: The typical trader doesn't predefine his risk, cut his losses, or systematically take profits because the typical trader doesn't believe it's necessary. The only reason why he would believe it isn't necessary is that he believes he already knows what's going to happen next, based on what he perceives is happening in any given "now moment." If he already knows, then there's really no reason to adhere to these principles. Believing, assuming, or thinking that "he knows" will be the cause of virtually every trading error he has the potential to make (with the exception of those errors that are the result of not believing that he deserves the money).
If he believes that anything is possible, then there's nothing for his mind to avoid. Because anything includes everything, this belief will act as an expansive force on his perception of the market that will allow him to perceive information that might otherwise have been invisible to him.
It's the ability to believe in the unpredictability of the game at the micro level and simultaneously believe in the predictability of the game at the macro level that makes the casino and the professional gambler effective and successful at what they do
Their belief in the uniqueness of each hand prevents them from engaging in the pointless endeavor of trying to predict the outcome of each individual hand. They have learned and completely accepted the fact that they don't know what's going to happen next. More important, they don't need to know in order to make money consistently. Because they don't have to know what's going to happen next, they don't place any special significance, emotional or otherwise, on each individual hand, spin of the wheel, or roll of the dice. In other words, they're not encumbered by unrealistic expectations about what is going to happen, nor are their egos involved in a way that makes them have to be right. As a result, it's easier to stay focused on keeping the odds in their favor and executing flawlessly, which in turn makes them less susceptible to making costly mistakes.
From Trading in the Zone by M. Douglas

Trading Flowcharts3.tradingview.com
Hello, dear TradingView members .
This educational idea is a Trading Flowchart.
It starts with simply explaining the main steps to make before trading and opening positions and how to identify our situation to gain better results.
Before we start to trade, we should identify the trend. What is a trend?
A trend is a direction in which an asset's price changes over time.
Financial market traders identify market trends with the help of technical analysis . Technical analysis is a framework that identifies market trends as predictable price trends within a market (when the price reaches a support or resistance level ).
Since future prices are unknown at any given time, a trend can only be determined in hindsight (vs. forward). However, this shortcoming does not stop people from predicting future trends.
The terms "bull market" and "bear market" represent increasing (rising) and decreasing (descending) market trends, respectively.
Peak and bottom:
In the price chart, the bottoms are the points where the demand pressure exceeds the supply, and the prices start to rise after a period of decline. On the contrary, the peaks are the points where the supply pressure exceeds the demand, and the prices start to decrease after an increase.
There are three types of trends in general:
Uptrend (Rising trend)
Sideways trend
Downtrend (Declining trend)
Uptrend (Rising trend):
When the price of a symbol or asset increases generally, the price trend is said to be bullish , bullish , bullish , or bearish . An increasing trend does not mean that the prices always have an upward movement; the price may sometimes go up and sometimes go down, but the result of this fluctuation is the price increase. The rising trend in the price chart can be recognized by looking at rising floors (when the new price floor is higher than the previous floor).
Sideways trend:
A lateral trend line is formed when the market remains stable, i.e., the price does not reach the highest or lowest price point. Many professional traders do not pay much attention to lateral trends. However, lateral trends play an essential role in scalping trades.
Downtrend (Declining trend):
When the price of a symbol or asset declines generally, its price trend is bearish , bearish , bearish , or bearish . A downward trend, like an upward trend, does not mean that the prices will always go down, but it means that the price may sometimes go down and sometimes go up, but the result of this fluctuation is a price reduction. A downward trend in the price chart can be recognized by looking at falling peaks (when the new price peak is lower than the previous peak).
One way an analyst can see a trend line is by plotting trend lines . A trend line is a straight line that connects two or more price points. This line continues on the chart as a support or resistance line.
An uptrend line is a straight line drawn to the right and up, connecting two or more low points. The second low point in drawing the upward trend line must be higher than the starting point. Uptrend lines support and show that even as prices rise, demand is more significant than supply. As long as prices remain above the trendline, the uptrend is considered unchanged. A break below the uptrend line indicates that a change in our trend may occur.
A downtrend line is a straight line drawn to the right and down that connects two or more high points. The height of the second point must be lower than the first point so that the line has a downward slope. Downtrend lines act as resistance and show that supply is greater than demand even as the price declines. As long as prices remain below the trendline, the downtrend is considered intact. A break above the downtrend line indicates that a change in trend may occur.
Familiarity with trend analysis
Trend line analysis is a technique used in technical analysis . Trend analysis seeks to predict the price of a currency in more distant intervals with the help of data obtained by trends. Trend analysis uses historical data like price movement and trading volume to predict long-term trends in market sentiment. Trend analysis tries to predict a trend, such as an uptrend in the market, and follow that trend until the data indicates a trend reversal.
Trend line analysis is essential because trends' movement ultimately leads to investors' profits. Examining a trend with the help of historical data of the desired currency predicts the future price of that currency for traders.
Trading strategies with trend lines
Now that we understand the meaning of trend lines and their types let's look at the strategies many traders use to identify trends and learn when it's the best time to open positions.
To try to make better predictions on how the market will behave, so we can trade safer, we can use indicators.
What are indicators?
In technical analysis , a technical indicator is a mathematical calculator based on price history, volume , or (in the case of a futures contract) options contract information related to the timing of the contracts, which aims to predict financial market trends. Technical indicators are the central part of technical analysis and are usually designed as a chart pattern to predict market trends. Indicators are generally placed on price chart data to show where the price is headed or whether the price is in an oversold or overbought state.
Many technical indicators have been developed, and new types have been invented by traders to obtain better results. New indicators are often simulated on historical price and volume data to see how effective they have been in predicting future events.
Here are a few examples of those indicators:
The Relative Strength Index ( RSI ):
The Relative Strength Index ( RSI ) is a strategy that helps identify currency price movements and buy and sell signals. RSI determines the positive and negative trend of the stock price by observing the average profit and loss in a certain period. The RSI is a percentage ranging from zero to 100 on a scale.
Fibonacci Retracement:
Fibonacci Retracement is a method of using the Fibonacci tool in the chart of a financial asset, which is used to determine the amount of price correction and find possible return points ( support and resistance ) of that asset, starting from the endpoint to the particular initial.
There are many more indicators we can use to get a better understanding of the market. For example, The Waves, Ichimuko Clouds, MACD , and The Bollinger Bands too and astrology and qml and robat smart capital manager
I hope this flowchart gives you a better perspective on how to trade safer.
Have you ever used this flowchart accurately? What do you think the pros and cons are?
Do you think I missed something?
Let us know your ideas.
Good luck.
How To Set Trading Goals!Hey Traders,
Setting trading goals is always a fun discussion and something I actually really enjoy talking about. It is possibly one of the most simple tasks with getting started in investing or day trading, yet it is a task that so many get wrong. It's like starting a Sprint race, only you're starting the race facing the other direction. So, today we're going to dive into how to set goals, what they should look like and how we can start getting you running on that race, or even if you started the race, to give you that little speed boost so you can get back on track be sprinting for that finish line, which is where you want to be.
It is very common, especially with beginners in trading, that when asked what are their trading goals, they're going to leave you with some kind of percentage or dollar amount and what they're trying to achieve per week or per month. It's easy and it's their aspirations is why they are in the game. They want to make X amount of money and they've been able to divide it down to figure out what they need to make each day in order to reach that goal. Now, most people will sit back and judge that goal on whether or not they think it's achievable and then they'll say well done and give the trader a pat on the back. Only what that person is done by telling this trader that it is good feedback is re firmed that there facing the wrong way at the start of the race and telling him to still Sprint that direction.
We trade an unpredictable market. That means no matter who you are or where you are, unless you have some kind of insider information, you have no idea which way a stock, currency or any type of asset is going to move. We base our decisions off of probability. We play on whether or not we have an edge over the market and as long as we win enough we will make profit in the long term and that is how trading works. What that means is we are never sure on how much money we will make or whether or not we will make money. Which means it is unreliable to set money based goals because we have no idea what the market is going to deliver for us. We can have expectations over the long term, but short term. As long as we are trading true to our strategy, it is honestly up to the market whether or not we take home profit or whether we cop losses. Now we understand this because it's trading, right? We got into this market knowing that. So why do we attempt to set money related goals when we know it's just unrealistic and really hard to achieve such consistency when you're looking at short term goals?
Baffling right?
Now, for some of you may just woke up to this fact, "oh yeah, that is very unrealistic." For others, you may have already known this. Either way, what we're going to do is dive into where you should be setting your goals and what should they look like.
My favorite goal to set and to see other people set is consistency within myself. It's to track your own decisions, marking your own movements. When actually trading, if you can become consistent within yourself, you will see consistency in your results, because you'll be able to trade that strategy without having to worry about your own decisions or emotions affecting your decisions. So, what I always did is obviously have a trading plan, have this trading plan and have set guidelines in what you have to do. Post trading as well. When it comes to filling out worksheets, maybe Excel spreadsheets you're trading, log your data, fill it all out.
Get yourself a spare calendar, put it on your wall and every day that you do everything to your plan, win or loss on the charts, everything you were supposed to according your strategy, your plan, and filling out all of your Excel spreadsheets, give yourself star. Then every single trading day you get a little star on that calendar and your goals should be set around that. If you find you're being consistent within yourself and consistent in your decision making, then you will be able to determine whether or not your strategy is good or bad, and you'll be able to achieve consistent results long term. Do not base your goals on dollar figures base your goals off of performance. It is the only thing you can actually control.
Stop playing around with the idea of setting goals outside of the market or outside of your results. Yes, it is fun to set dollar amount goals. Yes, it is fun to Daydream, but you get stuck in that Daydream Cloud and there may be times where you have a perfectly good trading strategy. You're able to trade it perfectly as well, but you're not hitting your goals. And the reason that might be is because your strategy may not be able to hit those dollar value goals even on perfect days. It happens. So set goals on what you can control, not on what you want the market to deliver.
How did you go about setting your goals? How do you do it now? Let me know in the comments. I hope you enjoyed this little post and I'll see you next time.
-Jordon Mellor

One Hour Strategy- Engulfing candle entry to short trade!The 1 hour Forex strategy that most intraday traders use as part of their strategy. The 1-hour trading strategy is a very popular trading strategy, as there are so many ways that you can utilize the one-hour period. Rules: Right pair, Right Price, Right Session & Right Time.
KEY TAKEAWAYS
The 1-hour forex trading strategy is a popular strategy amongst beginners and intraday traders due to the variety of ways a forex pair can be analyzed during this period. The one-hour timeframe captures a lot of market movement and can be a good way to gauge the latest sentiment. Many traders use this strategy in conjunction with technical tools such as RSI, MACD, Bollinger Bands and Moving Averages.
What is the 1 hour forex strategy?
The one-hour trading strategy is simply the timeframe that you conduct your analysis on any forex pair. The intraday strategy is popular due to the number of ways a forex pair can be analyzed during the one-hour timeframe. To take advantage of the 1-hour forex strategy, you need three things:
1: Analysis – Your analysis should form part of every single trade you take. It is crucial that you conduct thorough analysis, which may involve certain technical or fundamental factors. For technical analysis, consider using a range of tools such as MACD, Bollinger Bands, Moving Averages or Price Action. For fundamental analysis, you might consider paying close attention to the release of important financial data such as interest rates, CPI, or Labor numbers.
2: Entry – Getting your entry right can potentially mean the difference between more or less profit, and in some cases, it can mean the difference between a win or a loss. Your entry should be confirmed by your analysis. For instance, if you are a fan of using Price Action, then you might wait for confirmation until a particular candle presents itself – such as the morning star for a potential sell.
3: Exit – Your exit is just as important as your entry, although some might argue that it is more important depending on the circumstances of your trade. Planning your exit correctly can mean locking in profits, but more importantly it could minimize losses. Your exit should again have some sort of alert based on your analysis; this is to lock in profits as well as minimize losses.
RULES: Trade right pair, at the right price, during the right session & during the right session. Was noted RSI below under 50 & yellow line above purple line? Yes. The attached trade had all of the four checked off (which gives you high probabilities of success doing this short trade for up to a 237 pips) of profit on your trade. Only three candlestick setups you ever need to know and use which are Engulfing (two candles), Harami (two candles) and/or Pinbar (three candles)<-- they are the one's I use exclusively in trading forex.

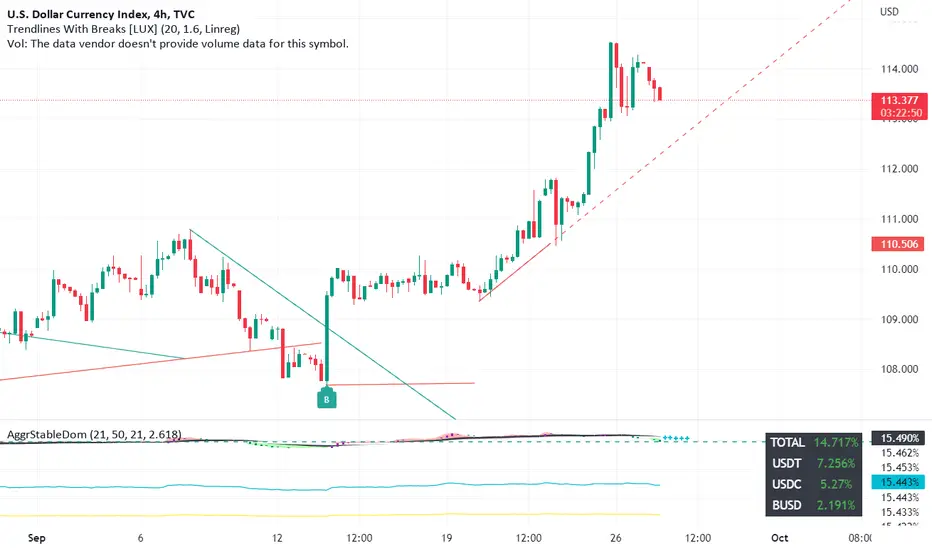
What Is An Imbalance, Fair Value Gap (ICT) or Inefficiency?What Is An Imbalance, Fair Value Gap (ICT on YouTube) and/or inefficiency in price (all the same thing)
An imbalance can be defined as an imbalance between buyers and sellers. A bullish imbalance has more buyers behind it and a bearish imbalance has more sellers behind it. When you see an impulsive move to the upside or downside in the market with no wicks overlapping full-bodied candles, this is where imbalances in the market are formed. They can happen on all time frames, but easier to trade on higher ones, especially after high impact news happen.
When looking for an imbalance in the market, simply look for any candle which has a full body and look for the part of the candle that isn’t overlapped by the previous and next candles’ wicks. This signifies an imbalance in the market because there were few transactions going on between buyers and sellers. (On chart) we can see how sellers completely overpowered buyers. Wicks usually represent price oscillating up and down within the time it takes to print that candle, showing that price is efficient. So when you see a full-bodied candle with no wicks overlapping it, you’ve identified a clear imbalance in price.
Price Imbalance Is An Imbalance Between Buyers & Sellers
The reason we call it an imbalance is not only because it’s an imbalance between buyers and sellers, but because there is literally an imbalance in the market. If we have an impulsive move to the upside it’s because there are no sellers to absorb the buying pressure of the bulls (bid up). This means that there is no resistance from sellers to stop the buyers from pushing the price up extremely rapidly. On the other hand, if we have an impulsive move to the downside it’s because there are no buyers to absorb the selling pressure of the bears (bid down). This means that there is no resistance from buyers to stop the sellers from pushing the price down extremely rapidly.
Imbalances in the market can also be viewed as inefficiency in price, telling us may be banks or financial institutions involved in the aggressive movement of price we’re seeing. Again, if we think about it, most impulsive moves and imbalances in the market happen as a result of there being no liquidity in the form of orders to stop price from being met with resistance and slowing down. In an efficient market, we typically see price trade in a range of fair value for that asset where sellers sell when they perceive the price of the asset is high (premium), and buyers buy when they perceive the price as low (discount).
By doing this, it creates a high momentum move and imbalance in the market that is much like a gap in price. In some cases, this price manipulation may be a part of an institution’s plan to generate liquidity, and therefore we may see price seek to “fill” that imbalance or close that gap before pushing back into the same direction that price impulse from.
Naturally, most imbalances in the market represent inefficiency in price, and therefore there is usually a good chance that price will return to fill that imbalance (in order to make price efficient again). While this isn’t always the case (price can just continue to push away from imbalances that form in the market), we can sometimes see price seek to mitigate the imbalance, or the zone that the imbalance originated from, and therefore look to take a trade in the direction of the imbalance in order to profit off of price moving in that direction to mitigate it! Trade Smarter not Harder.

What Is Leverage (in Forex trading)?Leverage allows you to potentially trade more money than you have in your current account. Your broker gives you a loan of 1:10 up to 1:50 leverage for your trading, in the U.S.A. (see chart attached).
You can change all amounts and % per trade on the chart.
Remember less leverage you put down on a trade, the higher margin (deposit or cash out of your account is needed) to place trades, yes that is how your broker protects you and them from a big huge loss by a forex trader. Also, this how you prevent margin calls from your broker from taking on to much risk.
Forex trading involves several things:
1) You account size
2) Leverage used. Higher leverage means you need less margin (broker deposit) per trade. Smaller trades you can do higher leverage with proper risk control. Higher trades you can do smaller leverage with proper risk control. Then you trade for the long-term, not just for a short period of times.
3) Required cash margin that your broker needs to hold for each trade that you are in. Protection for yourself and broker during your trade.
4) Percentage % used per trade (risk controlled by you)< Always do this on every trade that you do.
5) Lot size (you decide before any trades are done). Standard size: 1= 100,000= $10, Micro lot 1= 10,000= $1 or Mini lot 1= 1,000= 0.01 (on USD pairs)
6) Always use a STOP LOSS when trading (so you can determine, amount of risk per trade and/or lot size proper for each trade you do.)
You always want to use normally less then 5% risk per trade, so that 20 losing trades in a row does not blow your account. Risk management of your account is what will determine if you succeed or fail in forex trading. If you have a 1% or 2% per risk per trade with a 60%, 70% or higher win rate, with yes compound interest, you will see very high profits in the longer term and your forex account grow fast. The secret is leave your account alone and let it grow.
Actually, forex trading involves another ten things, which you can control are: account size, candlestick setups, entry, exit, targets, pair you trade, leverage you use, price you get in, session you trade and time you trade, lot sizes, risk per trade 1% to 5% (less is more).

Took a 2 week break after a good trading period.Came back from a trip today.
Didn't trade for the past 2 weeks. On Monday will most likely start with 0.5% risk to ease into the risk-mode decision making.
On Sunday will prepare for the week ahead and go over my trading plan.
Starting today will keep meditating to recalibrate my mind for calm and poise.
Even though trading is often advertised as an ability to trade anywhere, I personally found that it's much better to not do so. Our bodies get used to certain times of the day and session periods that we are profitable in.
Changing timezones and thus being in a different time during our session is suboptimal. Therefore, it's much better to just separate the two.
Stay tuned for trade descriptions on Monday.
On to the next one.
Lightwork_

Handling losses like a pro!Hey traders,
Ever wondered how some of the professional traders can lose tens of thousands of dollars and still not be phased? Well, today I am going to chat about how and why they have the ability to remain consistent and trust the process, and how you can do the same.
Enjoy!
