BTCUSD Models of continuation. Triangles.BASIC MODELS OF THE CONTINUATION OF THE TREND’S MOVE
Graphic configurations which will be studies in this chapter are called the models of the trends continuation. These models usually mean that the period of the price stagnation indicated on the graph is just a pause in the main trend development and that the direction of the trend will be the same after they end.
The second criterion between the fracture and continuation models is the duration of their formation. The construction of the first ones, which display serious changes on the price dynamics, require more time. The second ones are shorter. It is better to call them short-term and intermediate.
Note how often we use the word “usually”.
This is due to the fact that the interpretation of graphic models is subject, rather, to general patterns than to rigid rules. There are always exceptions in it. Even the elementary classification of price models is sometimes difficult.
There are always exceptions in it. Even the elementary classification of price models is sometimes difficult. Typically, triangles are models of continuation of the trend, but at times they show a fracture of the trend. Although triangles are usually considered intermediate models, they sometimes appear on long-term graphs reflecting the development of the main trend. A variation of the triangle - an inverted triangle - usually means a fracture of the main upward trend. At times, even the "head and shoulders" - the most famous basic model of a fracture - may indicate a phase of consolidation
TRIANGLES
We will begin a discussion of patterns of continuation of the trend with consideration of triangles. There are three types of triangles - symmetrical, ascending and descending (sometimes called the fourth kind, known as the "expanding triangle" or "broadening formation," but it will be considered below). All triangles differ in shape and have different prognostic functions.
SYMMETRICAL TRIANGLE
A symmetrical triangle or "spiral" is, usually, a continuation of the trend. It marks a pause in the already existing trend, after which the latter resumes.
An example of a bullish symmetrical triangle. Note the two converging lines. The model ends when the closing price is fixed on the market outside of any of the two trend lines. The vertical line on the left is the base of the model, and the point on the right where the two lines meet is the vertex.
The minimum requirement for each triangle is the presence of four control points. To hold the trend line, as we remember, two points are always needed. Thus, in order to draw two converging trend lines, each of them must pass through at least two points.
The completion of the triangle model takes some time, which is determined by the point of convergence of the two lines that is the top of the model. Usually, the price breakout should be in the direction of the previous trend, at a distance of half to 3/4 of the width of the triangle horizontally.
The ASCENDING AND DISCENDING TRIANGLE
Ascending and descending triangles are a kind of symmetric but have different prognostic functions. The figure below shows an example of an ascending triangle. Note that the top line of the trend is horizontal, and the bottom line is up. This model means that buyers are more active than sellers. Such a model is considered to be a bullish one and usually ends with a price breakout beyond the upper line.
This model is completed when the closing price goes beyond the upper trend line significantly. A breakthrough must be accompanied by a sharp increase in volume. The upper resistance line turns into a support level with subsequent price drops.
The minimum price benchmark is determined by measuring the height of the triangle (AB) and projecting this distance up from the breakout point C.
The descending triangle model is a mirror reflection of the ascending triangle and is often considered a bearish model. Have a look at the downward upper line and horizontal bottom line on the picture below. This configuration which indicates that the more active the sellers are than the buyers usually ends with the future price drop.
Completion of the model usually occurs with the closing price going beyond the lower trend line crucially and is accompanied by an increase in volume. Sometimes this is followed by a price return which meets resistance on the lower trend line. The measurement procedure for this model is exactly the same as for the ascending triangle. You should measure the height at the bottom on the left side of the model, and then project the distance down from the breakout point.
Triangle

Education post 2/100 - How to trade triangle pattern?Symmetrical Triangle
A symmetrical triangle is a chart formation where the slope of the price’s highs and the slope of the price’s lows converge together to a point where it looks like a triangle.
What’s happening during this formation is that the market is making lower highs and higher lows.
This means that neither the buyers nor the sellers are pushing the price far enough to make a clear trend.
If this were a battle between the buyers and sellers, then this would be a draw.
This is also a type of consolidation.
In the chart above, we can see that neither the buyers nor the sellers could push the price in their direction. When this happens we get lower highs and higher lows.
As these two slopes get closer to each other, it means that a breakout is getting near.
We don’t know what direction the breakout will be, but we do know that the market will most likely break out. Eventually, one side of the market will give in.
So how can we take advantage of this?
Simple.
We can place entry orders above the slope of the lower highs and below the slope of the higher lows. Since we already know that the price is going to break out, we can just hitch a ride in whatever direction the market moves.
In this example, if we placed an entry order above the slope of the lower highs, we would’ve been taken along for a nice ride up.
If you had placed another entry order below the slope of the higher lows, then you would cancel it as soon as the first order was hit.

BTC 2018 Bear Market meme TrianglesThe 2018 BTC Bear Market is littered with these Meme triangles. Despite many CT accounts suggesting they're bullish formations, 75% of them are 'Continuation patterns' See well known educational websites.
The current Triangle we're trading in is arguably a 'Descending Triangle' which is bearish.
Previous formations in this bear market have resolved with a breakdown ~65% of the way to the apex of the Triangle. This would be 24 September 2018.

ANAB - "ANAB-tomy" Of A Winning Long Trade?Sorry for the stuffy nose! Nonetheless, here I talk about qualities of a trade that help determine it as a winner. This is just a short version of what to look for, just to give some of the things to consider in the process. As a general statement, there are 2 things that make up a stock: technical factors (price behavior) & fundamental factors (financial statement info).
Fundamentals are important for longterm investments where company growth & strength are important, since over time, more people will get interested and buy the stock in the future for further price appreciation (5-10+ years for a solid investment). Simple fundamentals just looks at company profits and how much cash the company has access to, but for a detailed fundamental analysis, the company will need to be known and understood on a very high level as if the investor is one of he founders of the company. Before the investment is made, you must know almost everything about how goods/services reach the consumer/customer. For a trader, correct technical analysis is most important (everyone can do technical analysis, but it takes time to do it in a more realistic fashion without dreaming too much or trying too hard to predict a specific future price action). The more factors that favor your objective to buy the stock, whether as a trade or investment, the more likely you will win from the trade. Here is the list from the video:
1. Technical favor
-Price accumulation: price usually builds up slowly before exploding upward in an uptrend, with only few/small price corrections in the trend (it is hard to see this early but it is typically only obvious late AFTER the trend has started)
-Volatility contraction-expansion: I talk about this all the time I'll skip it; it is very important to always look for though
-Price eagerness to increase: when price keeps trying to push upward to newer levels, this tells that at least there are also other people who see the stock going higher and are willing to put their money on the line for it
-Supportive base: the price action should show you that the price has no interest in testing lower levels, which means there are no aggressive sellers, investors or other traders are not selling off and there is a positive sentiment toward the stock
-Industry/Sector performance: this was not included in the video, but it usually gives you a great technical context especially when you are diversifying or trying to pick a home run stock (it's still very difficult to pick one though)
2. Fundamental favor (if considering longterm investing)
-EPS growth past 3-5yrs (should mirror revenue/net income): this tells you the company's plan to grow/expand and make profit in the process is working, and hence the company is still appealing to old and newer investors
-Free cash flow: I didn't explain this well in the video, but I meant to say that a good cash flow means the company has cash on hand aside from other assets to be able to pay off any debt or sudden expenses today if the need arises (this is a very simplified version just to give you an idea)
Let's see what ANAB can do! Looking forward to comments or PM discussions.

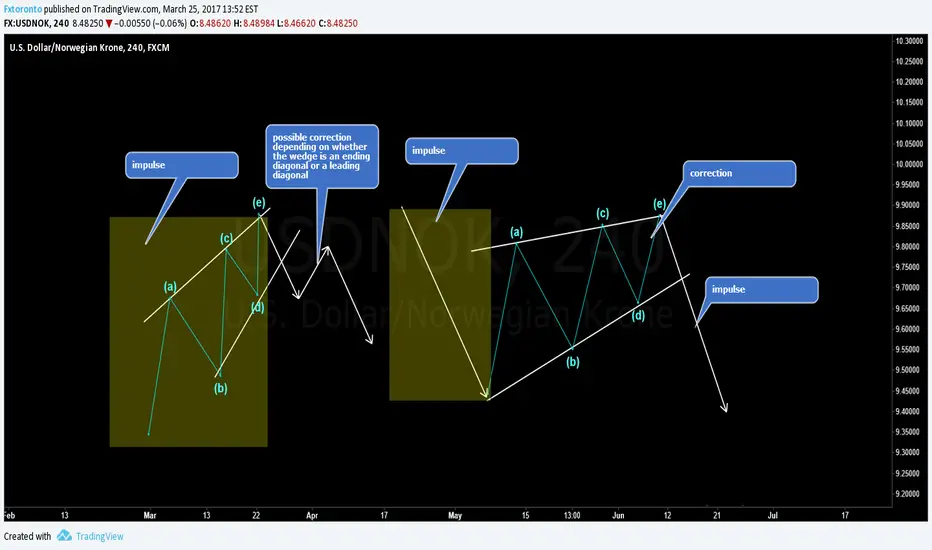
Catch Me If You Can: Breaking Down the Elusive Elliott WaveHere's an explanation why Elliott Waves don't work most of the time, and then sometimes work perfectly.
Lets take a closer look at a single impulse wave up and its correction (I'm using 61.8% retracement and wave 3 = 100% of wave 1). You simply can't trade based on that (red dots), here's why.
If you treat it as 123 up trend forming (green count), you can't confidently:
1. short at the end of 1 to catch wave 2 because it can go higher (have an extension from 100% to 127.2%, 161.8% and 261.8%)
2. long at the end of 2 to catch wave 3 because it can go lower
- from 23.6% to 38.2%, 50% and finally 61.8% and then go up for the up trend 123
- up to 88.6% of wave W in wave X and then go up in Y (if this is X not 2)
- and even lower after that, break the start of wave 1 to reverse the trend down
3. short at the end of wave B (red) after a bounce from wave 2 to catch wave C (red), because it can go higher
- it can go up from 23.6% to 38.2%, 50% and finally 61.8% of prev swing wave A (red) and then bounce down as zigzag or triangle
- it can retrace as wave B (red) in a flat up to 88.6% and then go down still
- or it can even be an expanded flat wave B/X and retrace up to 138.2% of wave A (38.2% above the end of wave 1, Sometimes even 61.8%! and only then drop down)
- or it will go up in wave 3/Y = 100% of wave 1/W
4. long on breakout of the end of wave 1 to catch wave 3 because it can pullback
- it can be wave a of Y or lower degree iii or 3 and immediately pullback in b/iv below wave 1
- it can be an expanded flat wave B/X and retrace from 105% up to 138.2% of wave A (38.2% above the end of wave 1, Sometimes even 61.8%! and then drop down)
- it can be a short Y = 61.8% of W in WXY and then go down
That's why you are only supposed to buy on a retest of wave 1 after the breakout
5. long at the end of wave C (next bounce from the end of B) (red) because it can go lower
- it can become a triangle ABCDE and break the other way
- it can still be wave B and go higher up a bit then down in zigzag/flat (same impulse-correction fractal of a lower degree, same options, see #3)
- it can break the end of wave 2 and continue down as wave C from 61.8% up to 1.618% of wave A, although we mostly have short C = 61.8% of A in Bitcoin
So, on the long side you are left only with 2 not-so-tradable options:
- buy above 138% of wave 1 to ride a very small ~10% (100% - wave B retracement - 38%) chunk of wave 3 = 100% of wave 1.
However, the expanded flat can still go to 161.8% and wave 3 can end early at 61.8% as wave C/Y.
And if not that, this trade probably has a bad R/R and you will pay in fees a lot more that you possibly can gain.
- buy on retest of wave 1/A/W in iv/x after the breakout to ride wave 3/C/Y (100% - wave 2/B/X retracement) up to 38.2% in case of an expanded flat or up to 100% of wave 1 in case of wave 3/C.
And you can only to the 2nd option on the short side, because usually C = 61.8% of A, not 100%, invalidating the first setup.
But guess what, that's called trading breakouts from a range/triangle, and you don't need Elliott Waves for that.
Conclusion:
I just showed you that in most cases Elliott Waves don't really work, they give you a number of possibilities for both bull/bear cases, not trend direction.
You can't trade based only on Elliott Waves and fibs, without using other TA methods.
The trend is basically just a sequence of 2 impulses and then comes a wave 4 which can become the 1st impulse down and reverse the trend or go up in wave 5. Waves 3 and 5 are not guaranteed. The only thing guaranteed is a 2nd impulse following the 1st. But in the current market with unclear 3/5 wave structure, low liquidity, hidden bottoms and traps you can't clearly spot even the 1st impulse, so there might not be a 2nd one.
Continued Below =>


Lesson 6B: Breakout Patterns - Ascending Triangle (Bullish)Hello Friends,
Welcome to the series of Lesson 6. In Lesson 6B, we are going to learn the Ascending Triangle breakout pattern. This is more of a continuation pattern rather than the reversal pattern as oppose to the Falling Wedge pattern that we learned in Lesson 6A.
Lets get straight into the topic. Please be very careful.
We will be referring to the chart above or below to get a better understanding of the topic:
What is Ascending Triangle Pattern?
Ascending Triangle is a bullish continuation pattern, which we quite often see in the crypto world. When a coin is inside the Ascending Triangle, it means it is currently being accumulated, before it breaks out.
Formation:
Lets go back to some Mathematics. We all studied what is a Right Angle Triangle correct? If we look closely at the chart above, we see that it is forming a right angle triangle.
There are two lines to this formation, one is the resistance line, which is horizontal as you can clearly see. The second is the support line which is ascending as you see and it moves up with the price (basically it is inclined moving up as we go from left to right).
The horizontal (resistance) line is formed by 2 or more equal reaction highs touching the horizontal.
The ascending (support) line is formed by 2 or more higher lows touching the ascending support line.
The Rules:
So obviously, you won't just draw an ascending triangle, and think that this is a bullish pattern. There are a few things you need to confirm before making an entry into the coin. Lets look into it.
You must be wondering, how many times the price candle has to touch the resistance line or the support line to consider this pattern valid? Here is the answer:
For the Horizontal (Resistance Line), the price candle has to touch at least TWO or more times to consider a part of this pattern valid. Notice in the chart how the price pull after touching the resistance line FOUR times.
For the Ascending (Support Line), the price candle also has to touch at least TWO or more times to consider this pattern valid. Notice how in the chart the price candle bounces after touching the support line THREE times.
Note (IMPORTANT) :
For the Resistance Line, it is preferred that the candles touching it are equal or doesn't differ in height by too much difference. Usually I only consider the patterns for which the reactions highs are equal for this pattern.
For the Support Line, it is preferred that we have reaction lows as Higher Lows. If we see a reaction low lower than or equal to the previous reaction low, this pattern will be INVALID.
Also note from the chart that there has to be a little distance between the reaction highs, or reaction lows, as you can see in the chart. Just a little is fine.
Since crypto is very volatile, the length of time this pattern occurs doesn't really matter much, but the longer the length the stronger the patter. It's that simple. I stick to 30m or more for this pattern.
I am sure you guys are understanding this really well, as this pattern is very simple to understand or do I make it simple to understand? :P
Lets take a look at the breakout setup.
Continue reading below.....


ETHUSD - Descending Triangle + Bear FlagHi All,
This is just a initial stage of the pattern, the pattern usually change to ascending/descending triangle and sometime to raising/ falling wedge or a channel. Just monitor on the declining of the volume until the breakout volume spike. (to identify the target price).
1. Descending Triangle - This pattern is usually a continuation pattern, but some cases, there is a breakout at the triangle resistant line.
2. Bear Flag.
3. Stoch RSI just returned from overbought
once bear flag pattern is confirmed, it will affect the MACD and form a bearish divergent. (and confirm the descending triangle bearish pattern).
This TA is for Educational purpose and not a financial advice. If you are happy with my charts and would like to follow more in the future, feel free to follow my profiles.

BTCUSD - Symmetrical Triangle BreakoutDear All,
If you follow my previous TA, this is the part of it and a details analysis on the breakout of the Symmetrical Triangle. Since this is Educational TA, let me explain in details;
What is Symmetrical Triangle?
1. Symmetrical Triangle is a continuation Pattern. So you need to look where is the entry. For this case, the entry is from bearish trend. Once the breakout is confirmed, it will continue goes downwards.
2. Volume for Symmetrical is similar with other pattern, where the volume reduced until it reach breaking point. For this case, the selling volume will at high for the continuation to bearish side.
Few info I used in this charts;
1. MACD - This indicator to check on the market momentum, as you can see at the breakout, the 12 EMA is going to cross 26 EMA again and goes downwards to denied bull trend.
2. Stoch RSI – This is one of my favourite indicators after Volume and MACD, it show the market is just returned from overbought market. We are heading to oversold area again for a new correction.
3. I drew a 300 days SMA line from day chart as a big support at the range of $7282.5-7343.9.
4. Previous Support line also identified since we are expecting a bounce anytime from this pattern. The support at $7671.2 and $7430.3 is identified.
5. $7102.2 is the lowest target where that is a technical target based on Symmetrical Triangle pattern. Take note that the target is not 100% achievable and that is the reason why previous support/resistant and also SMA need to identified.
This TA is for Educational purpose and not a financial advice. If you are happy with my charts and would like to follow more in the future, feel free to follow my profiles.

BTCUSD - Symmetrical TriangleHi All,
Previous Bear Flag and Raising Wedge Target is complete and lets see latest pattern.
Since Daily Stoch still bearish, we probably will go another bear pattern. Symmetrical Triangle. Symmetrical is a Continuation Pattern. Since the Entry is from bearish trend, it will continue going downwards. MACD and stoch RSI in 2 hours look bull, but probably denied due to bear trend in day chart. Just monitor on the breakout and spike in volume.
*This TA is for Educational purpose and not a financial advise. If you are happy with my charts and would like to follow more in the future, feel free to follow my profiles.

So You Think that Patterns are Useless? Reevaluate it.Hey, I am back with another, this time educational analysis.
In this educational analysis you can see some obvious patterns in the chart, that helps you decide when to buy or sell.
Simple usage of just three indicators, Volume , RSI , and MACD .
At first I though, sure, how can some pattern show me the price movement.. But I was wrong.
Ok, so in the time of 9 hours, we can see two Pennants , one Ascending Triangle , Head and Shoulders and Small Flag. If u were this time, during the breakout looking at the graph, and you were able to spot all these Patterns you could earn 62,5% in 9 hours!
For Example, The top of head and shoulders, the top was when it did triple top on RSI and MACD showed trend reversal.
Unfortunately, in the 15 min chart, it looks kinda Meh, so please, take a look lower, where is the 1 min chart, that is a lot more clearer.
Tradingview doesnt allow to post less than 15 min charts.
Thanks!

Exactly how I decided to bail before the fall.To clarify an earlier post, I thought I would explain the signs that told me to sell my coins just before the beginning of the recent fall, in the hopes that it might help someone at some point in the future if they see something similar. It also helps me to write my thoughts down.
A dramatic price rise can be seen on the chart as the popularity of cryptocurrencies caught the imagination of the masses. Since supply is relatively limited (new coins only appear through mining and the release of brand new types of coin), then as demand shot up, so did the price. It reached a point of correction (a peak), from where it fell hard until it found/formed a level of support. It bounced up from that, but fell down again, temporarily breaking its support (a spring before an upthrust). The rise of the upthrust found, and established, a level of resistance, then fell back down to the same, previous, level of support. At this point a triangular consolidation is becoming apparent, one with fast falling highs and angles pointing downward.
Then the price bounces off the support of the bottom triangle again, but this time it is different because two things have just happened: The MACD has made it clear that the sellers are NOT exhausted, but that the buyers ARE exhausted. So, this rise is likely to fail because of the weak bulls, then fall hard because of the strong bears (becoming a powerful test of the support).
The consolidation pattern was going to breakout at some point, because as the amplitude of the price range narrows (the highs and lows get closer as we move toward the point of the triangle) pressure builds in the volatility-loving World of cryptocurrency. The signs were that a breakout would be downwards, and made a more likely occurrence by the evidence of the strong bears and weak bulls in the preceding MACD cycle. Though it could have carried trading on within the triangle, or even had a breakout upwards. That time of the bulls buying seemed like a good time to sell and get out.
The fall that followed began a series of consolidation triangles, each pushing the price down further; I am not a fan of shorting, so the rises within these triangles were good to ride (charts can be seen in some of my other posts).
I hope someone finds this useful. Thanks for reading.
Best wishes and good luck to you all.

Example of a Symmetrical Triangle on VNQVNQ formed a symmetrical triangle. It has two trend lines. One uptrend line is acting as support while the downtrend line is acting as resistance.
This triangle contains three highs lower and three lows higher. When these points are connected, the lines converge as they are extended and the symmetrical triangle takes shape.
The symmetrical triangle can be continuation or reversal, so we must wait for which line will break. To confirm the breakout, the price should close above the resistance line or below the support line. In this case broke by support, then we must make a short.
The profit target is the distance away as the back of the triangle.

Example of a Symmetrical Triangle on ETHUSDETHUSD formed a symmetrical triangle. It has two trend lines. One uptrend line is acting as support while the downtrend line is acting as resistance.
Contains three highs lower and two lows higher. When these points are connected, the lines converge as they are extended and the symmetrical triangle takes shape.
The symmetrical triangle can be continuation or reversal, so we must wait for which line will break. To confirm the breakout, the price should close above the resistance line or below the support line. In this case broke by resistance, then we must make a long.
The profit target is the distance away as the back of the triangle.

Example of an Ascending TriangleGBPAUD formed an ascending triangle. We could see a horizontal upper line (that would be a resistance) and a lower uptrend line (that would be a support).
Prices moves with equal highs, and lows higher than previous.
Then after a few attempts, the prices finally break through resistance.
The ascending triangle is a continuation pattern. Prices come from an uptrend then prices bounce inside the triangle before breaking higher.
To confirm the breakout, the price should close above the resistance line, if so, make a long. The profit target is the distance away as the back of the triangle.

Just wanted to share my triangle scalping theory for crude oilThis pattern has brought me great success scalping crude oil.
How to trade it:
Look for an ABCD triangle formation with lower highs and higher lows.
Draw the triangle with extended lines.
Measure the baseline at B and divide it by 2
Add this value to the point of breakout to get a nice padded target to either side
Look out for fakeouts and good luck.
Backtests may occur on the extended lines to the right but moving between them invalidates the triangle and the trade should be closed.

Simple Patterns Tutorial Part 1. Ascending TrianglesHey Traders, I am going to do a short free tutorial on Simple Patterns. This tutorial's purpose is to show you:
-How to Identify Ascending Triangles
-How to measure the move to project price targets
-Examples of how you can create a rules based Strategy around Simple Patterns.
- Psychology behind Ascending Triangles
The Ascending Triangle is a Bullish Pattern and should be traded with the trend! There are a couple things that you should consider if you decide to create a strategy based around these Patterns:
1) I have found that these Patterns are not very successful if you are using them for countertrend trades. I'm sure someone out there has a strategy that consists of these patterns to signal a counter trend trade however it personally did not work for me. I found that these Patterns are extremely accurate when you are trading with the trend and couple them with a pullback or specific candle formation after the breakout has occurred.
2) Volume should increase when price breaks out of the Ascending Triangle formation
3) These Patterns will not always be picture perfect therefore we need to look for the characteristics of the Pattern as opposed to perfect lines. The characteristics being, relatively equal highs creating a near horizontal Resistance line, and higher lows creating a rising (Ascending) Support line.
4) These Patterns tend to complete within 3/4 of the way to the APEX. I have found that these Pattern tend to be invalidated if price trades to far into the APEX.
Psychology behind an Ascending Triangle:
The top line of the Ascending Triangle (Resistance) is a price level where the sellers are able to overcome the buyers and push price down. As this pattern continues to form, you will notice that the sellers are unable to push price as low this time and this is where the Ascending Trend line begins to form. As this pattern continues, again the sellers are unable to push price as low as the most previous low and the buyers are beginning to overpower the sellers. The Psychology aspect is that every time the sellers push price down, the buyers are willing to pay a higher price for there shares (this creates the Ascending Triangle). Eventually, the buyers will pay a high enough price to overcome the sellers and break through the upper Ascending Triangle line (Resistance).
I hope this was helpful! I cannot possibly cover every aspect of every pattern so please feel free to message me or comment below with any questions you may have! I will be happy to help! Thanks Traders, make sure you do your due diligence and back test any strategy or pattern that you are attempting to create. You will also need conditions, criteria, and rules for that strategy. This will save you a lot of money and give you confidence in your trades. I have attached a live example of an Ascending Triangle below and I will periodically be posting more examples like that one as an update to this tutorial.

Educational post - Difference between a wedge and a triangle Hey guys this is a very short educational post on two of the most commonly found chart patterns in the market. These are often mistaken and confused even by experienced traders. Here we have a rising wedge and a bearish triangle both are bearish in nature. However one is a reversal pattern and the other is a trend continuation pattern
Example of a wedge
Example of a bearish trianlge
I hope you guys found this beneficial. Next time we shall talk about bullish variations of these two patterns with examples.
Cheers