Downward Triangle and trend line breaksTrendlines are support/resistance. Here you can see a massive downward triangle from after the 20k rally at the end of 2017. There is also decreasing volume until the breakout downward, where we have a spike of volume. After this, we can see that we entered the bull market after finally breaking the downward trendline in April 2019.
Triangle

📚Trading Lesson. Triangle Types & How to Read Them📚
Triangle is a classic price action pattern that is applied by technical analysts to make predictions trading different financial markets.
Depending on the shape of the triangle, there are three main variations of this pattern.
Its meaning changes dramatically from one to another so it is crucially important for you to know the difference.
👉 The symmetrical triangle is determined by two contracting trend lines.
The pattern is considered to be indecisive meaning that while the market is stuck within, the directional bias is unknown.
Only the breakout of a boundary of a triangle clarifies the future direction.
👉 In contrast, the ascending triangle (also called a bullish accumulation) is a classic example of a bullish biased pattern.
With a horizontal trend line serving as resistance and a rising trend line service as support, the market is accumulating volumes for a bullish breakout.
Once the horizontal resistance is broken, bullish continuation follows.
👉 The descending triangle is a bearish biased pattern. Also called a bearish accumulation, the pattern indicates the preparation of the market participants to set a new low after consolidation and contraction within a triangle.
Once the horizontal support is broken, bearish continuation follows.
🔔Please, support this educational post with a lovely comment and like.
Also, subscribe to our page for more educational posts & signals.🔔

Triangle patterns - All you need to knowToday, we will explain the most important concepts behind triangle patterns.
The first thing you have to know is that triangle patterns are composed of 5 waves which we can define using letters "a,b,c,d,e" This concept was created by Ralph Nelson Elliott, one of the fathers of modern technical analysis and mainly known because of the "Elliott Wave Principle."
Most of the times , we are used to observing corrections with Zig-Zag shapes
These are really easy to spot because C always goes below A, and we can say, "NOW is finished." However, with triangle patterns, we need more patience, its not that easy to say "now is ready" because we never have waves that go above or below the other ones; it's a constant compression. That's the reason it is imperative to wait for 5 clear waves.
Another important concept of triangle patterns is that we can start drawing these two lines that will intersect in the future. These two lines will tend to contain the pattern until the breakout or the cancelation of it.
Ok, let's assume that you had the patience to spot a clear triangle pattern. How should I trade them?
ENTRY LEVEL: ALWAYS above "D" but much better above "B." Why? Because at that level, the price would have broken 2 resistances zones which is a strong sign for the bullish thesis.
STOP LEVEL: ALWAYS below A that was the main support of the structure, so we want to exit our position if the price goes below that level
TAKE PROFIT LEVELS: USE fibo extensions on the previous impulse and pay attention to two levels, 1.27 and 1.68
Important concept: Remember that context IS EVERYTHING. You don't want to trade isolated structures; you want to trade a structure and a macro context aligned with the view you have.
Final idea: Here, we have used a Real example on TSLA. We think that the best way to show these theoretical concepts is by looking for real scenarios and testing them. Here we think that the corrective pattern is not finished, and we want to observe a clear ABDE before setting confirmation areas. It's important to know also that technical analysis is not mathematic; it's closer to soft sciences/disciplines. This means that Technical Analysis is not a fundamental science that explains all the movements of the market; that would be nonsense; technical analysis provides us with statistical guidance that can help us project a probabilistic scenario which can happen or not.
Thanks for reading! Feel free to share your vision and ideas in the comment box.

Symmetrical Triangle GBPJPYSymmetrical Triangle spotted on GBPJPY. Long entry on break of pattern.
You can find these Patterns across all charts. Mark out your areas of interest and monitor Price Action!

📚Today's Profitable trade BankNiftyFor the 1st 4 hours it created volatility in a range of 100 points , which is a small range , so we took the trade when there is a breakout in triangle pattern as well as the 100 point Range...Bought 35600 CE at ₹67 and exited at ₹114

📚Reversal Patterns - How To Identify & Trade Them 📚
Though, there is a wide variety of reversal price action patterns.
Here is the list of the classic ones that you must know if you trade technical analysis.
The head and shoulders pattern is believed to be one of the most reliable trend reversal patterns. It is one of several top patterns that signal, with varying degrees of accuracy, that an upward/downward trend is nearing its end.
The Head and Shoulders pattern has a distinctive appearance which includes a distinct ‘left shoulder’, ‘head’, ‘right shoulder’ and ‘neckline’ formation.
A double top/bottom is an extremely bearish/bullish price action reversal pattern that forms after a price reaches a high/low two consecutive times with a moderate fluctuation between the two highs/lows. It is confirmed once the price falls below/above a neckline level.
Ascending/descending triangle is a classic reversal pattern. It signifies the exhaustion of the market. The price sets a sequence of higher lows / lower high and respects the same highs/lows signifying a highly probable forthcoming trend reverse.
The reversal trigger is a breakout of a horizontal neckline.
Do you find these patterns reliable?
❤️ Please, support this idea with a like and comment! ❤️
⬇️ Subscribe to my social networks! ⬇️

Which crypto to put your money?Choose a chart that trends up when you want to buy or one that trends down when you want to sell. On this chart you will find a few examples. Say that you are looking for a long position, which requires you to buy, then DOGEUSD is possibly breaking out its triangle and making a new high.
Disclaimer: Nothing posted here is investment advice, also as stated in the TradingView house rules .

Ascending Triangle - What's the phycological Truth behind this?We see many trend patterns while trading. One of them is ascending Triangle.You guys may rote that ascending Triangle is always bullish and it will be always bullish. But why it is bullish? Can't it be bearish any time? If not, Why? If yes, when? If you are finding the answers of these questions,this article is for you. Don't escape any line. Please read the full article. You will find your answers and will enjoy this article. Now Let's get into the topic✅✅
1️⃣ You may know Uptrend is always bullish and Downtrend is always bearish. What's uptrend or Down trend? An uptrend is when candlesticks make HH and HL or same High and higher Low. In an ascending Triangle, Candlesticks make same High and Higher Low. So it makes an uptrend into ascending Triangle. As a result it is bullish structure.
2️⃣ You may hear this " The more times candlesticks touches the trend line the weaker it becomes." In aline cending Triangle candlesticks touch the resistance 3 times but touch the support 2 times. As a result the resistance become weaker and get broken.
3️⃣ So a ascending Triangle never becomes bearish? Obviously it does. When the trend touches support line 3 times,it becomes an Head and Shoulder pattern. And it becomes bearish and breaks the support line.
4️⃣ Another bearish form of ascending Triangle is when trend makes a double top pattern into ascending Triangle.
✳️✳️ Now where to take entries?
Long position After the retest of previous resistance as support and short position after the retest of previous support as resistance.
✳️✳️Where to put SL? That's you all know where to put SL. You can put SL according to your bookish knowledge. But I prefer smart SL. I will share How to put smart SL in future.
✳️✳️Now I want your opinion. How's the article? Is it good or bad? I want to know your opinion eagerly. Please comment your opinion below. And A like is always appreciated. Thanks❤️

Symmetrical Triangle Traded On AUDCHF Currency Pair (2021 April)AUDCHF Symmetrical Triangle. Target Price 0.70167.

Symmetrical Triangle Traded On EURCHF Currency Pair (2021APR29)Trading the Symmetrical Triangle on EURCHF Currency Pair using the H4 Chart. Wait for a close below diagonal support level. After the candlestick closed below the level, diagonal support turned resistance. Next, wait for price pull back to the resistance line for the retest. Watch for a pin bar or rejection candle to form. The ideal condition is to have a pin bar form on the retest of the diagonal resistance line. The pin bar will form on the EMA 10, EMA 20, and diagonal resistance line for perfect ideal condition.
Here are the three ways to enter.
Enter at closing price of the pin bar, break of the pin bar nose with a sell stop order, or 50% Fibonacci Retracement of the pin bar with a sell limit order.
Stop Loss is place 5-10 pips above the pin bar tail. Or stop loss is placed above the break out candle.
Take Profit is the first point of the trend line. In this case, the take profit level is 1.09756
Pin Bar is date 29 April 2021 time 16:00.

Pennant Pattern On The H4 Chart (2021 April 28 ; 20:00)Trading the Pennant (Symmetrical Triangle). Wait for a close above/below the diagonal level. In this case, wait for a close below diagonal support resistance level. After the close, diagonal support turned resistance. Next, watch for a pin bar to form at the Resistance Line, EMA 10, EMA 20 in a Pull Back.
Enter at closing price of the pin bar, break of the pin bar nose with a sell stop order, or 50% Fibonacci Retracement of the pin bar with a sell limit order.
Stop Loss is place 5-10 pips above the pin bar tail. Or stop loss is placed above the break out candle.
Take Profit is the first point of the trend line. In this case, the take profit level is 0.94906.
Pin Bar is date 28 April 2021 time 20:00.

Symmetrical Triangle CorrectionHello guys
We have 5 sub-wave correction which form 3-3-3-3-3.
If we expand our view we see that in each symmetrical triangle we have ABCDE.
Follow me for more tutorials.
Cheers :)

👨🏫 Continuing Pattern: ✅ Triangles👀Triangles are among the most reliabiable of the continuation pateerns. There are 3 types of Triangles with forcasting value.
Ascending Triangles
Descendung Triangles
Symmentrical Triangle

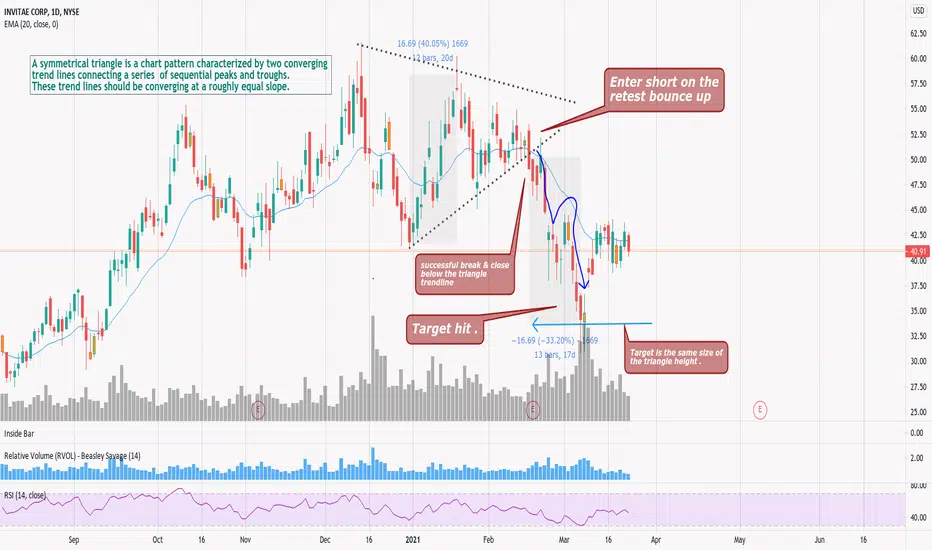
Symmetrical triangle tutorial - live example of a short setup A symmetrical triangle is a chart pattern characterized by two converging trend lines connecting a series of sequential peaks and troughs. These trend lines should be converging at a roughly equal slope.
Guideline of Diagonal with Elliot WavesCan you spot this beautiful pattern from gold recent weeks movement? Follow us and get the latest update about this pattern later in the day!

How to Trade Diagonal Like a ProHere you find some guidelines for entry and initial protective stops for ending diagonal. We will publish more about how to integrate diagonals in Elliot Waves if we get 50 likes!
Hint: Can you spot this pattern in gold now? Check out our ideas if you don't!

My success with GMA +500% by TA.At the end of August 2020, I saw that the GME price touched its historical low (the lower red horizontal line). At the same time, the "Diamond" reversal model was formed.
The breakout of the" Diamond " up on 31/Aug/2020 confirmed the reversal from the downtrend to the uptrend.
Next, I used the old-school tactic of "Measured movement" according to D. Schwager - according to which each new wave of growth is equal to or slightly greater than the previous one. And each new wave of falling is equal to or slightly less than the previous one. And this "Measured Movement" clearly bounced off the support line of the new trend (the purple line).
This allowed me to surf both long and short until mid-January 2021. Then the growth became threatening, I closed GME and took a profit of about +500%.

Bitcoin Triangle Trading: Do they work?One of my followers on Tradingview pointed out that there is an abundance of ideas about the TRIANGLE on Bitcoin. It's great the pass the time drawing pretty pictures but can traders actually make money from them?

$BTCUSD looks bullish. Its weird formation(supposed to be ascending triangle), but looks bullish especially above $12 150. The price could easy reach $20 000 again and extend to $27 000.
This is just my opinion not trading it. Use your research and use SL or hedge.

See the previous post and thiz postThere was clear breakout
For this triangle pattern
Always be a price action trader, it's easily tells the breakout

EDUCATION: Ascending TriangleHello, dear subscribers!
Today we will talk about the most popular chart pattern - the ascending triangle. This is commonly known bullish pattern and its correct recognition will help you to earn money.
How to identify the Ascending Triangle?
First of all we should clearly understand that the price now is in global uptrend. The socond one is the uptrend support line. There are should be at least three attempts to break this line down. The last component of the ascending tringle formation is the horizontal resistance line.
How to trade with the ascending triangle?
If the ascending triangle pattern is formed you should identify the breakout point. It is the most difficult part of the analysis because the ideal triangle pattern is rare. We have to find some confirmation of the uptrend continuation with another indicators.
The last question is how to set the take profit. It is usually used the triangle height for the take profit setup.
