Bitcoin : End of the week, consolidation is in playHappy Saturday all, welcome back with me in this newest update about bitcoin. let's check it out!
If you remember about 2 methods of connecting the trend line, there are wick to wick and the body to body connecting method. Personally, I am more interested in using the body to body connecting method because it will exclude the bull/bear trap region and exclude the possible manipulative region for the crypto asset. But, once again it is still very subjective and a personal judgement that works based on case by case occur.
In this case, which I use the daily time frame to find a possible trend line, I use the body to body connecting method and I find a descending triangle is forming on current price pattern. As we know, the descending triangle usually end up bearish in most of the price pattern. But, in this level and circumstance I really recommend you to wait more for the confirmation to enter any position. There are several example of a failure descending triangle that is bullish, that's why a break out to both side is expected and I will stay neutral on middle term.
In overall, after a huge drop on September 23rd and 24th, the price forms a triangle pattern that usually is a consolidation pattern for the moves. This pattern is still normal and very ideal. Waiting is gold now for bitcoin.
For altcoins, I've seen some candidates to be a hype in crypto universe but, still confirmation is the most crucial thing to wait.
Triangle

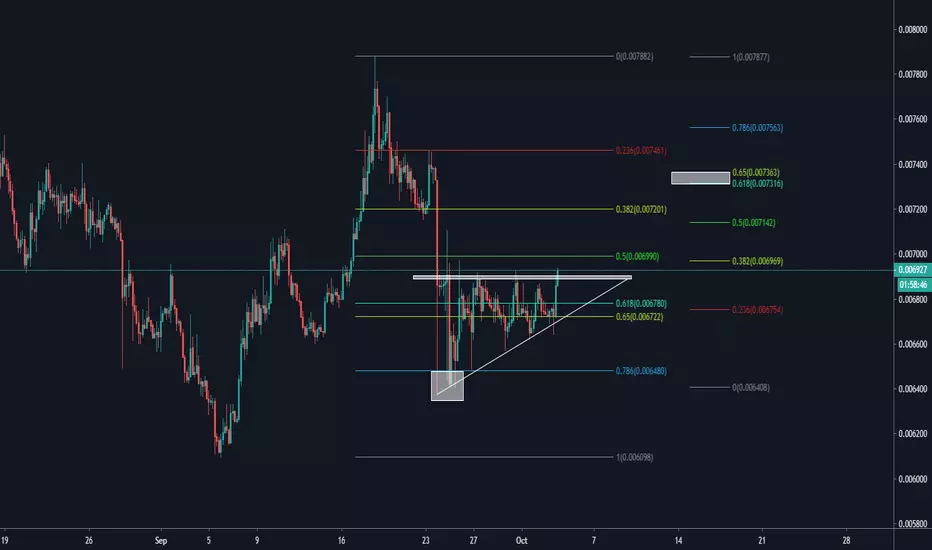
Litecoin bullish patternHey Fellas, feel so interesting with last few days trading result which gives me personally a good gains on some of my coins that I hold. The most profitable coins that I am holding is PPT on Binance and of course for you who have followed my channel, you will realize it as well.
And litecoin here is one of many candidates that I would like to share to you. The first indication that I was very interested is the price bounced as soon as it touched the 78.6 fibonacci retracement area which we know it as a significant levels for some instruments in the last 2 or 3 years. The second indication that I believe you will agree with me and it's very hard to argue in my opinion is the price has formed an ascending type of the triangle which usually end up bullish. Broken out of the horizontal resistance zone will be my entry point for long/buy position.
My nearest target absolutely at the golden pocket zone and then we can target the previous swing high as well.
Short term : Should it be a bounce?Hello Fellas, Let's come to the update of bitcoin.
I want to give a highlight on the green trend line. this is the previous trend line that has already broken up and right now the price is trying to test it again to confirm as support. And if we see a correlation between this trend line and the fibonacci extention 1.1 level, it almost moving align with it. And the cross point between to highlighted region is slightly below the 200 MA which make things more interesting.
If we are talking about the breaking down of the 200 MA, Current daily candle hasn't closed yet. That's why today and tomorrow will be very crucial for the next possible move for bitcoin. However, in lower time frame, I haven't seen any confirmation of bounce just yet, making me to stay idle and just enjoying my yesterday's profit on SKY and LSK.

Key levels of BTCHello fellas, I really think it is very important to keep giving you an update under this crucial circumstances of bitcoin and current crypto market.
Looking at the chart, We can see that currently the price is trending right at the confluence area between 0.5 fib levels and the 200 MA. This is clearly a relatively strong support for bitcoin. But, at current movement on lower time frame, I haven't seen any sign of bounce based on current price action. That's why I deduce on the new theory. Knowing that 200 MA is usually become a significant level to watch on every instrument, I really think that bitcoin should respect this support to at least doing dead cat bounce. But, we have to consider the wick fishing region too as the bear trap region on higher time frame.
We could see this wick fishing on daily candle or even the weekly candle. The anticipated wick fishing region could be around the green rectangle zone as a support zone based on price action on historical data. I do believe that the price will actually retest again the previous broken support around $9000 - $9400 as a resistance to confirm the phase 2 of my break out strategy before another downside movement.
Once I see a reversal pattern, I will try to catch long position on bitcoin. But for now, waiting is the best choice.

Fundamental Analysis: It worksHey, hey, hey! Wassup wassup wassup? Bitcoinnect!!!
You'll be happy to know the $50 I left on my Bitmex account when I defenitively quit crypto are doing very well.
Went short 130 bucks saturday morning at the price of $10090, and that went rather well :D
So as long as this little money survives I'll still look a little bit and make calls and you'll still hear from me.
So as you can see, fundamental, in this case we can maybe call it news, analysis works!
Coupled with TA in the form of that descending triangle, it worked like a charm.
As an individual, being a firm by yourself, knowing 1 market inside out has its rewards, but it is also pretty risky.
1 way to do it I could suggest if you want to go this way would be:
- Have 1 to 3 markets that are your specialty (the more you have the less info you'll have on 1). If you trade very short term probably 1 is max, higher TF 3 is ok you just go for the big moves maybe.
- Have 1-2 strategies you are really good at, and a handful of other markets you don't know great, but well enough to trade if your mains are being slow for a while.
Example: When BTC was flat in August-November 2018 you likely could not have traded it great. Looking somewhere else would be interesting.
Back to BTC.
In December 2017, people that knew a little about future predicted that CME launch would mark the top for Bitcoin.
This is going to be the top for a couple of years at least, maybe forever...
I wonder if the BTC decimated investor community are going to get mad at "wall street" for "killing" Bitcoin with futures?
The first futures in history date back from babylon 1750 BC, they were some kind of agriculture future.
I'm just going to copy it from wikipedia:
Futures are known for "crashing markets" because producers, when futures become available, use them to sell their products early on at a guarenteed price.
I speculate that the price crash is often violent because once futures open alot of producers are going to be interested but there won't be much speculators to absorb their orders.
Or it could just be that the market becomes more efficient and the price finds its more right spot.
In a futures market you need hedgers (producers or even buyers such as the company making corn flakes being corn buyers) and speculators.
Afaik no futures market has ever worked without the 2 being present.
So we can see that it is likely that what happened with CME futures is that all these miners (you must have heard the stories) "I sold my house to buy Bitcoin mining equipement" vastly reduced their risk (their risk of not getting their equipement money back) by purchasing selling contracts, basically "I will sell 5 Bitcoins in the future at a price of $19000", as long as they'll mine those 5 BTC, they have nothing to worry about, they will be able to sell them at that price.
For the other large futures company, the ICE, and their overhyped Bakkt futures, the logic is different.
Here, people were excited and prepared to see large institutions start buying massive amounts of BTC (don't ask me why they thought this would happen).
And day 1 went like this: 65 BTC were traded in total. Day 2: 163 BTC traded.
And of course, no institutions are interested. Once again. But some people thought they would suddenly change their minds and bought BTC in anticipation for this.
So here, today we learned something important.

Perspective on BitcoinThis is my perspective for bitcoin's possible movement, after breaking down of a huge descending triangle , it moves real quick to test the 200 moving average on daily based. This 200 MA is moving align with the 50% fib level which make it as a confluence zone. in my opinion, we will see 1 more waves up to test the previous broken support aroung $9000 - $9500 region.
See my complete analysis in details with the elliot wave count on my youtube channel in one point trading.
Thank you

Something worth waiting for.QLC is looking very juicy right now, we can easily deduce that the white region of this current move is a major support for this altcoins. That's why it is become one of the most stable coins during current indecision of bitcoin's price. When I write this analysis, QLC is one of some coins which has 3% gain comparing the previous days.
Now looking at the 4 hours chart, I draw 2 resistance trend line which has 2 different perspective.
- The first trend line is the white trend line, I use the wick to body connecting method. Based on this current analysis, the price has broken out and now it is retesting again this line which act as a support trend line
- The second trend line is the light blue trend line, I use body to body connecting method on 4 hours chart. Based on this current analysis, the price is moving inside of the descending triangle and hasn't shown any sign od breaking out yet.
Because of current bitcoin's movement which has a huge bearish pressure right now, I choose to wait more confirmation until the price break out of the light blue trend line. green zone is my first target.
For more detail analysis, watch our video analysis on youtube one point trading.

Next Stop $9300?Hello Fellas, finally we come here with an update on the number one largest cryptocurrency in this universe which is BITCOIN! If you've seen my video analysis breakdown on youtube about btc, you will realize that finally btc has got a confirmation of breaking down the yellow area. what's next after this?
Like what I've always said, there are a lot of arguments to draw a support and resistance trend line for bitcoin, that's why a lot of bias has occured lately. I can't blame and judge the people who has made an analysis and serve it with exact long or short. Right or wrong, the bias in this market is always be subjective, there won't be 100% right or wrong. But, with this break down of yellow level, I believe most of good traders will agree that the bearish pressure is getting higher at this rate.
I see a minor support level which is the 78.6 fib level region. This area also known as the flavor of the year region because in this 2019, a lot of instrument has bounced right after the price hitting this level. Currently, the price of bitcoin is trending slightly above this support level and once we see a break down confirmation of this minor support, I believe the short entry to target the white region as a huge support is likely to happen.

Possible 30% gain on this altcoinsHello Fellas, Today is a very interesting day when we see at the market . it is all because I saw a lot of buy signals from altcoins which could lead them into a huge bullish run in the next few days.
First of all, if we look at the 4 hours chart, we can easily find an ascending triangle has been formed which usually could lead the price to go up. Beside that, I've seen a possible 5th wave is going to be formed in near future.
Because I often see a truncated 5th wave which usually lead us to the double top pattern, I will be waiting for the break out confirmation of this 4 hours pattern. and enter long position from here.
My 1st target will be between 19700 - 20000 which act as previous swing high of current pattern. My highest target for mid term is around the 25000 which is 30% up from current price. However, between 20000 - 25000, I see a lot of significant resistance is ready to fight the price back, that's why I will give you a breakdown update for those resistance ahead.
Thank you.

Triangle is indecision, Manipulation is increasingly smelledHello fellas, how are you doing today? I hope you are doing well in this choppy market. In current podcast, I will share my idea about the psychological behind the triangle pattern and what can people with thick pocket do to manipulate the market. let's go!
First of all, I want to remind you again and again that bitcoin is moving inside a huge descending triangle. and as you know when the price is coming closer and closer to the edge of the triangle that is called APEX, the volume is slowly diminishing and you will realize the price volatility will get slower and slower. The reason why the volatility is getting lower is because when the price getting close to the APEX, the upper line of the triangle usually moving align to the lower levels and the lower line of the triangle is moving align to the higher levels until those 2 lines meet in one point called the edge. When the price is moving inside the triangle, a lot of traders won't enter any position because they could easily getting killed by the opposite side. That is why the risk number will getting higher when the price is close to the APEX.
**Binance and Manipulation?**
If you've read the news about binance.US launching which will provide the trading platform for the American traders. However, this could be a big deal and a big news when the price is moving indecision especially, some estimators said that more than 30% of global crypto trading is Americans. Just imagine when there is a new platform with no historical data on each coins they've listed and they open an initial exchange listing? I really think that the price will be very choppy, especially for altcoins which most of them are already in their bottom position.
In my conclusion, Anything of Binance does, is worth paying very close attention to, even if you are a US trader or not. That's why I haven't opened any short position although My bias is bearish right now.

BTCUSD dailyBTCUSD daily chart potential descending triangle reversal pattern. wait for breakout to short position.

GBPCHF A Pennant trade (Educational Content)Pennant and triangles are tend to fail close 70% of the vortex which is the peak level.
By paying attention to this detail you can easily determine the strenght of the pattern you found.
If the pattern fails too early or too late, it means that the market is not paying attention to your pattern.
We're looking to long this pair after the breakout.
Thank you for your likes and comments. That's the only thing that motivates us in terms of posting more content.
Good luck.

Roles of confluence zonesIt has been a very interesting move from bitcoin, after a drop to touched the $10095 region, the price was immediately moves back to claim again the support around $10300 region to produce a long shadow on daily candle. This action could be a good representation of the bulls making their best effort to defend the $10000 region as a huge psychological support.
And looking at the chart that I've shared, the green dotted line is the resistance trend line if I want to exclude the bull trap region on previous action (body to body connecting method). And the second thing is the white region, those 2 white regions are the confluence zone between the fibonacci retracement and the fibonacci extention which I believe will act as a huge resistance for swingers. The first resistance zone is around the $10750 - $10800 region which is moving align with the green dotted line as resistance trend line. The second resistance zone is the confluence zone between golden ratio and the 1.1 fib extention.
My bias here is remain the same as before with a push to the down side for the big picture. but, I see a possible push to the first resistance zone with a bull trap region producing until the 2nd resistance zone if the $10300 region can defend the current price from further drop.

FTSEMIB, FTSE MIB Index - Potential Breakout on ParabolaINDEX:FTSEMIB
The parabolic support guides us on a possible breakage of this resistance on the Italian index would make very interesting from the point of view of Risk Reward this potential trade since from that level onwards would meet much less resistance giving confidence to buyers to ride a possible trend.
Set alerts!
Stay Tuned!

Ascending triangle pattern An ascending triangle occurs when the upper side of triangle is flat and price stuck in between the upper side and not breakout , it means the upper side works as a resistant for the price , as long as the pattern is valid
finally we draw the another side of the triangle with the upward trend and try to draw it carefully with the price levels right.
then in the pattern we draw , in the point that the lower side hits the horizontal side,we determine that point as end of the pattern , as you see , in the definition of ascending triangle we must consider the breakout occurs in the 2/3 or 3/4 of the pattern or something in between.
finally , in the chart you will see the nice and clean An ascending triangle pattern , which occurred in this sample , exactly in the 3/4 of 180 length of full pattern width which means the 135th candle.

The Precision, 5th truncated wave and Next possible stopHello all, It has been a very volatile day in the market, A huge moves has occured in today's market and I saw a lot of drama occur. But, once again our yesterday's scenario is going really well with 5th truncated wave at the upper line of the triangle.
Back to the 4 hours chart which is becoming the best benchmark for swing traders. in this specific period, you can see the yellow trend line which become the broken resistance previously and until now, I haven't seen any proper retest toward this resistance again that is now become support. Usually, after a major trend occur to the upside, we will try to find a support for possible place to catch the reversal. I use the fibonacci levels to find supports and in this case, I really don't think that the golden pocket on fibonacci retracement can hold the price considering the fact that bitcoin is moving inside a huge descending triangle.
In my opinion, The price should touch again the major support on around $9400-$9000 region where this horizontal support will find an alignment with the yellow line which now become a support trend line. and if this breaks, you will see a very very nasty drop from bitcoin.
Right now, I want to stay idle and watch the wild volatility that occurs in the market.

Room to grow, support and resistance for bitcoinFor all of you who has opened a long position since my last signal should be in an amazing profit by now. That's why congratulation for all of you my baby. here we come with another view on bitcoin based on daily chart.
First, the last volatility is just amazing and if you have seen my previous analysis about bitcoin, you should have opened long position since $9500 region. Right now, the price is trending inside the huge descending triangle and I clearly see the potential of the price to fill the empty room toward the upper line of the triangle. but, looking at the size of current daily chart, it has a huge possibility for bitcoin to have a spike toward the golden pocket zone or even at the 78.6% fib retracement region before another drop to the downside.
Looking at the MACD indicator right now, the histogram has a significant ticking up to the upside and to the positive side. if this condition can hold until the daily candle close, I firmly believe that the price will fill the empty room toward the upper line of the triangle.
Currently the price has already claimed back the dynamic support on daily chart and this is a pretty good sign for me.
Thank you I will keep on updating about bitcoin's current moves.

Example of Simetric Triangle with CryptocurrenciesUsed Cryptocurrency EOS to draw a Simetric Triangle as example. The simetric triangle can show break up or down


Breaking the symmetrical, the traders survivor guide by hedgehogSo you been trading for a while and got stuck in a symmetrical triangle apocalypse? let me make it easy on you:
____________________________________________________________________________________________________
**** Facts:
1. Triangle: At-least 2 lower highs, 2 higher lows to start the trend.. (in total 4 points)
2. Trend: Usually happens after months of one trend, and appears at the peak of the trend. appears as uncertainty, consolidation and a temporary stop for the trend,
this usually a 'no trade zone' as it's very hard to guess which direction it will break, this is where the sellers and the buyers trying to detainment if the price is valid,
until it forces them to make a decision, which usually explodes and continues for long period of time...
3. Volume: The more the Symmetrical extends, so does the volume diminishes more and more (The quiet before the storm) until decision has made which means it will
force one side to agree to the strong trend.
4. Duration: It can extend for many weeks - months, usually on strong trends it can continue for 3 whole months!!!
5. Break-out timeframe: Usually happens after half or 3/4 of the whole triangle length, if it breaks before that then it is a premature breakout which means we either
going back to that zone or it wasn't a significant stop thus wont be the break.
6. Confirmation: Should be with V big volume rise (sellers/buyers) then, and also should be confirmed only after closing daily candle.. some traders prefer to wait for up
to 3 days to confirm a new trend pattern.
7. Return to Apex: Not a must, but surely the best, if the price returns back to the Apex zones of the break, to use it as support/resist, to push it even harder to
continue the trend.
8. And the most important key note to know is price target: The widest range of the triangle (From where it started, between the highest high and the lowest low) is
the price movement up/down, if lets say the range between the top and the button is 6k$, then we should expect the break to fall/grow towards that same
ammount.
**** Some warnings:
1. It is never know and very hard to know which way a symmetrical triangle will break, but usually on more cases (+/- 75% of times) it will break towards the continues trend, if it started at the peak of bullish then more chances it will break as bullish, BUT! a symmetrical triangle is as I explained an uncertain point between the buyers and the sellers, and it might be a key point where a reversal for the market appears, which means on many cases (+/- 25% of times) it might break against the trend.
2. It's very dangerous and hard to guess where we will break to, thus sometimes it's called a 'no zone trade' which also causes less activity of volume which drops more and more the further we progress towards the end of the triangle, you should work with very tight SLs (Or even avoid trading) as a strong break out push might be so fast that not only it will easily hit your SLs, but it might also ignore them (With gaps) if the exchange SLs are 'market SLs' type, so be careful.
3. It's always best to trade after a break out fully confirmed (Or better to say: invest, as this is usually long term until we reach the price target)..
*********************************************************************************************************************************************************************************
* If you like what I do, please push "follow" and "like".
* Also if you want live time signals and learn with the community then you are welcome to join here: t.me
* If you want to appreciate my work with spare BTCs then you are welcome to send them to: bc1q8kzn0x8j4dmws00ntuhyma8p4c9jwyj0gzxua9
Cheers, love <3
Your favorite vigilante speculator: Hedgehog King!
*********************************************************************************************************************************************************************************

Deja vu on RippleOne of the most interesting altcoins that I am seeing right now is XRP especially for long term hold. Just if you remember about the 2017 phenomenal bull run that occur on crypto market in general, you will see a similar pattern on XRP with current pattern. both of them form a huge descending triangle. And at 2017, the price broke out of the upper line of the triangle and produce a killer 1500% profit only within a month! Will this pattern become the same as of the 2017?
In my opinion, I will be very cautious at this rate, especially the price is still moving inside the triangle and as long as it hasn't break out of the upper line, I won't do any action. So, my entry area is when the price do break out action at current triangle. considering it is now very near the APEX, we will know the answer really soon.

Story of the BitCoin is about to surprise everyoneFriend of mine said "I hope Bitcoin will go a little higher".
I truly believe this is the problem, too many wishes and hopes by inexperienced people trying to make a fortune, gambling / guessing with absolutely no technical analysis.
It goes up so I buy now, sell later. Easy... Shit! It went down!... I hope it will go back up.
Problem is, it might not go back up soon Ladies and Gentlemen.
I'm not saying this is something anyone of us wants to see but keep your eyes and mind open.
Don't live with promises of Bitcoin reaching 20k, 30k, 60k USD.
Early 2001 everyone was saying that CHF is stable and it is unlikely to move up... guess what? June 2001 started 10 years of a bull market! 10 freaking years!!!
Now let's go back to Bitcoin. It doesn't matter that people are calling which direction Bitcoin will go, because if YOU will not do your own research you are not covered.
The same story is for any Crypro, Forex, Stock, Indice, Commoditie and so on.
Trading is not about feelings, hunch and hope.
Stop lying yourselves and start doing your own research, your own analysis. Make a plan for every single trade and stick to it!
Do it for yourself because I honestly don't mind anyone losing their money, but at the same time is would love to everyone successful with their trades.
Even though a trading guru did a perfect analysis, it can still go the other way, this is normal, it happens and that's part of the trading.
The key is to make more profit than loss.
And for love of God, don't trade only cryptocurrencies. They are way harder than any other type of trading in my humble opinion.
Now drop a like and prepare for Monday session.
Disclaimer
I am not a financial advisor. The advice here given is not financial advice even though my excitement might make it look like such.
You trade at your own risk and nobody can guarantee you results. Even if someone could, I don't.

