Triangle


ASC, When will it bottomed? Just a retrospective view on what has happened on this stock, we wait to see the end of it, I like the way the heights were reached a clear double top, and the continuation patterns along the way down. one of these days the turn shall come. I am keeping my eyes open here and my options too.

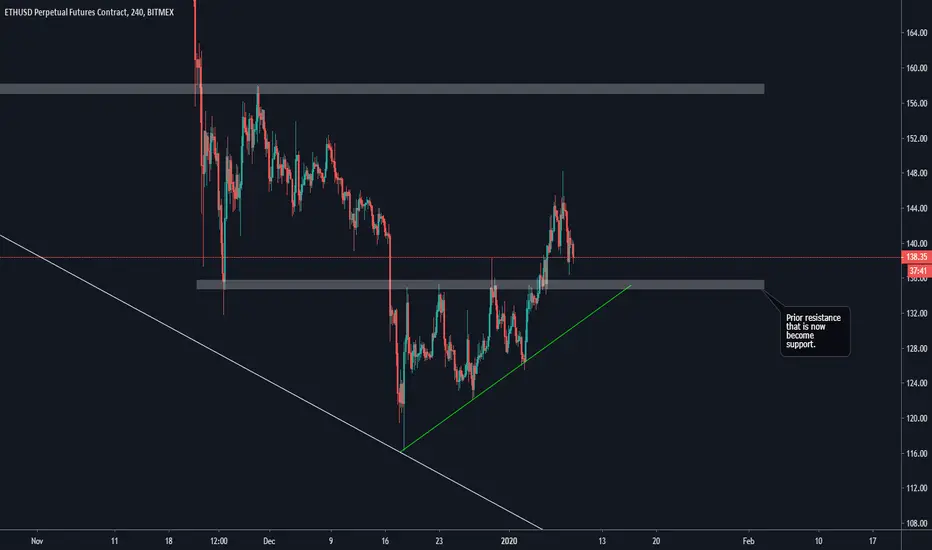
Ethereum : Short term perspectiveHello fellas, here is the ethereum update based on short term perspective.
First of all, I do the analysis on 4 hours trime frame based on bitmex market price. From the chart attached, we can see that the price was forming an ascending type of triangle which has broken out to the upside. and because of this break out, we have seen 10% spike to the upside which is awesome in my opinion.
Now, let us see the action of break out of the prior resistance around $135 region, we know that after this break out, we haven't seen any retest toward the previous resistance that is now become support as well. That's why I will classify the previous up trend as the first phase of break out strategy. And I will expect a 2nd phase of break out strategy to retest the $135 region.
And if this support can hold the price, we might see push higher to the $150 region as the next potential resistance in higher degree. But, if the area can't hold the price from further drop down, we might see a lower low pattern of melting down to the $110 region.
BURL, Burlington Stores Inc. - Stop Loss on Broadening TriangleNYSE:BURL
It is never a question of being right or wrong, but rather of being too early and being thrown out of the market before the asset's actual direction.
What we need is an event that allows us to systematically decide to enter Long or Short, in our case the patterns of technical analysis.
We are trend-followers and we gain from price movement, so we could call ourselves "Price Change Traders".
In this case the price had triggered our Stop Loss.
Stay Tuned!


S&P 500 ETF 1D ASCENDING TRIANGLE LONG BREAKOUTAscending Triangle
An ascending triangle consists of a strong resistance level.
Strong levels are usually pretty obvious.
There will be lots of wicks and bodies that touch a horizontal trendline.
A trendline is not just a line but it is always a zone.
So you can expect the price to push through the level sometimes.
Other times price will just approach the level.
Draw the line with the intent of finding the price where the activity seems to be most prominent.
Draw it so there are no candle bodies above the line so the line can be used as a trigger price.
A close above the line will be a trade trigger.
Just like all ines this line is very subjective.
You won't get it exactly right every single time.
You can adjust this line if a head fake happens and price falls back inside the triangle.
A far less important line but an important indicator of what is happening in this marketis the ascending portion of the triangle.
This shows us that fewer and fewer traders are willing to see the price drop lower.
Everytime the price is pushed down it gets pushed back up more quickly.
Price gets trapped between these two lines and the pressure to break the resistance level gets stronger and stronger until it finallys breaks.
If price pushes below this uptrend line then redraw it as long as the price goes back into the triangle.
Watch that the volume continues to decline also.
Watch that a triangle will break usually when price reaches 2/3 to ¾ of completion.
Price could break sooner.
As a confirmation of the consolidation pattern watch for a decline in volume and ATR/volatility.
This represents boredom on the part of traders.
Fewer traders are willing to participate in the consolidation and are sitting around waiting for it to break.
Use the built-in Trading View volume indicator.
Click on indicators- select built-ins – scroll down until you see volume – click on it.
The volume will appear in the same window pain as the price action.
To seperate it from the price action right-click on the indicator- select “move to” to “ new pane below”.
This will seperate the volume frpom the price action pain.
Select the default volume MA of 20 periods.
Use the volume indicator with a moving average because we need to know what the average volume is. Right click indicator – select style – click volume MA.
20 periods is roughly 4 weeks of data for most markets.
Volatility is trader speak for how much the price is moving around.
For volatility use the average true range (atr) which is the average of the lengths of the last number of candles.
Use the default of 14 periods for the Trading View indicator.
This is a short er time period for the ATR so to bet a little quicker idea of what the volatilityis doing.
14 periods represent roughly 3 weeks of data for most markets.
There are always anomalies, news events and a data release that is messing with these patterns.
A brief hiccup in a pattern does not necessarily negate the pattern if the price falls back into the pattern after these events.
Trade the ascending triangle only with a bullish breakout of the resistance level.
Enter a buy trade on a breakout candle close of the resistance level on your timeframe.
Our upper triangle trendline has no candle closes above it os a close above that level is significant.
What if it is a false breakout or head fake?
Look for volume on the breakout and just go with it. If there is a cnadle close back inside the consolidation triangle then close the trade for a loss and move on the keep the loss small.
How to move on depends on what the chart does for the next few bars.
If price settles back into the original triangle with the exception of the head-fake and the volume & ATR/volatility continue to decline, then redraw the resistance level to above the candle bodies on the head fake and look for another breakout.
Otherwise just call it a blown pattern and look for other opportunities.
Everything also applies to a descending triangle.
Just look for a strong support level and for the break to the downside.

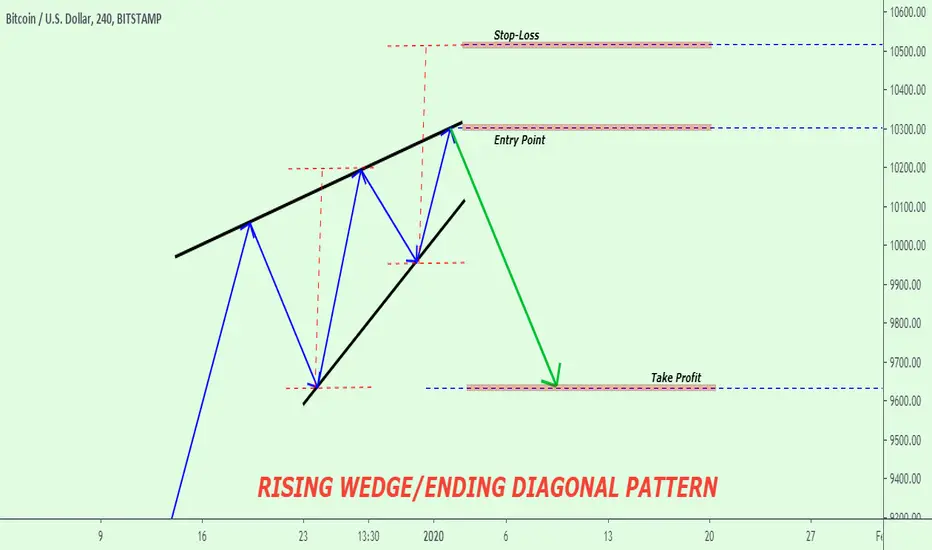
RISING WEDGE/ENDING DIAGONAL PATTERN. How to Trade it...Rising Wedge
A Rising Wedge is a chart pattern within the context of an uptrend composed of two upward sloping and converging trendlines connecting a series of higher swing/pivot highs and higher swing/pivot lows.
Rising wedge (also known as the ascending wedge) pattern is a powerful consolidation price pattern formed when price is bound between two rising trend lines. It is considered a bearish chart formation which can indicate both reversal and continuation patterns – depending on location and trend bias. Regardless of where the rising wedge appears, traders should always maintain the guideline that this pattern is inherently bearish in nature.
HOW TO IDENTIFY A RISING WEDGE PATTERN:
~ Establishing Downtrend.
~ Rising wedge consolidation formation
~ Linking higher highs and lower lows using a trend line assembling towards a narrowing point.
~ Confirm divergence between price and volume may also be used.
~ Look for break below support for short entry.
HOW TO TRADE THE RISING WEDGE PATTERN:
All Details are labelled in the Chart..
BASICS TECHNICAL ANALYSIS - TRENDFOLLOW FORMATIONFORMATION ANALYSIS: PRICE PATTERNS AND CHART FORMATIONS
A trend setting of technical analysis is formation analysis. In doing so, certain combinations of movement and correction are considered.
If such a combination is detected, the trader can try to trade the resolution of the formation.
Basically, a different is made between the trend continuation formations and the trend reversal formations.
They are often caused by resistance and support lines.
Trend continuation pattern:
Confirm the strength of a trend. These are, for example, rising / falling triangles. Even flags and pennants (see picture) are seen as a trend continuation.

Descending TriangleLooks like Ethereum just broke the descending triangle. My personal targets are between 100-110 due to strong support/psychological support, though we may see some bounces as we go down. Fast capitulation of the market would be a more bullish indicator for me as it indicates less manipulation and less attempts at whip-lashing retail traders.


BTC Short term viewHello fellas, welcome back with bitcoin update again and again. Coming to the consolidation zone, we can see a lot of frustation and a lot of uncertainty has came to this crypto space. The only good view is on the altcoin market which is holding its most of the bottom support. A coin like Omisego, Nano, and Stellar (beside the coin burn fundamental) has surged up from its bottom, this will once again become the indication of increasing attraction of free money to this altcoin market.
Coming back to the bitcoin insight which always phenomenal and being unpredictable, I want to analyze it in short term view and in lower time frame. Based on my technical analysis, we can easily see that the $9500 has been a very very huge resistance for bitcoin. In last few days, we have seen a very sideways market. But, slowly the price is forming a higher low structure since October the 26th, 2019. Therefore, it forms like an ascending type of the triangle. Although a lot of bearish pressure has intimidate the bulls for a long time, but the bulls still remain strong and consistent at least at lower time frame. I could change my bias from bearish to bullish short term as if the price can break the $9500 and we can see a push further toward $9700 or even the $10000 region. But, as long as the resistance is remain valid, I am still bearish short term.
Anything can happen in crypto market.

The bearish perspective for bitcoinHello fellas, welcome back with me in this podcast once again in this beautiful day. I will try to cover today's technical analysis with a very detail technical analysis which I believe it could be useful to you. Let's get it started!
So, talking again with the 3 phases of break out strategy that is becoming one of my favorite strategy which I always mention over and over again. Current bitcoin's chart will be a very good example of how the trend line gives a significant effect of the price of an instrument. We can see in this chart that the current action for bitcoin is at the phase 2 of break out strategy. It can be applied to 2 different line and zone. Both areas can be used as well for analyzing this strategy.
The first level is the white support trend line, we can easily deduce a broke down of this trend line has already occured since the September 23rd, 2019. And after that the price kept moving down and had the consolidation action at around $8000 region before a huge manipulation occured at October 25th and 26th. With an 11% rejection toward this resistance at October 26th , it becomes more logic to me that this is just the action of retesting and NOT THE NEXT BULL RALLY.
The 2nd level is the white zone around $9500 - $9400 which has held the price as a horizontal support zone since the parabolic run has over. It was broken down by the price on September 24th. Once again, since the broken down occur, we haven't seen any retesting action toward this region again. And at October 25th and 26th artificial pump, the price surge above this region. But, on daily basis, it only produced a wick to the upside and the next day's candle was super tricky. Right now it is trending just below this resistance zone which for me, making the bitcoin still moving in an absolute bearish momentum.
My conclusion is that bitcoin has a possibility to surge one more time to tap the white resistance trend line, before it will continue its bearish movement to the down side. I personally don't think that bitcoin can break the 2 resistance zone that I've been mentioned in this previous paragraph. So, My view still bearish overall and Be aware of the possible manipulation on the market.

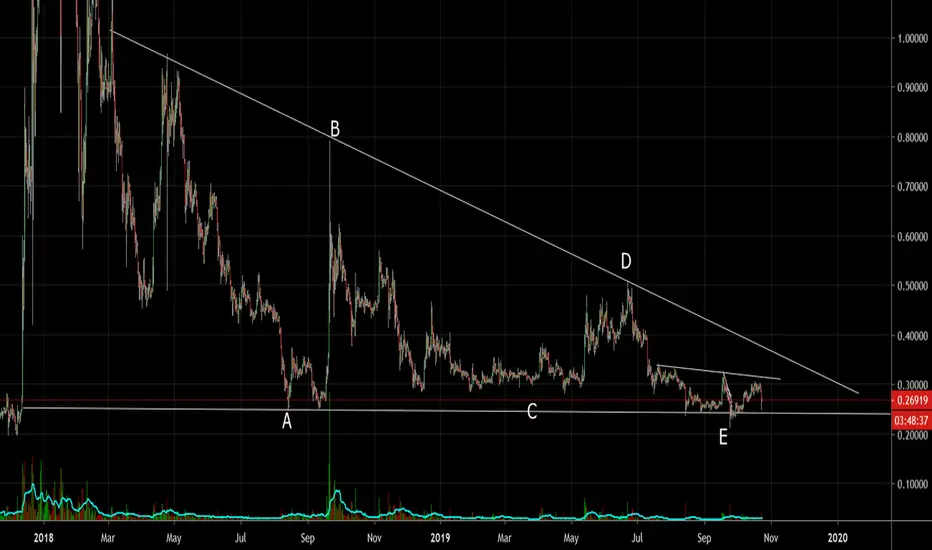
APEX and RippleHello fellas, Here it is I represent to you my view about Ripple.
Based on the technical analysis, I found an important pattern which forms a descending type of the triangle. But, once again I remind you that even the descending triangle which usually indicate a bearish pressure, it has a potential to make it a failure too. However, I only see that currently the price for ripple has already trended in the APEX of this huge triangle on weekly chart. These are the 2 scenarios :
1. Break out of the resistance trend line : will lead the price to $0.47 or even $0.87 in mid term
2. Break down of the support line : will lead the price to form new low in 2019 around $0.14
Thank you


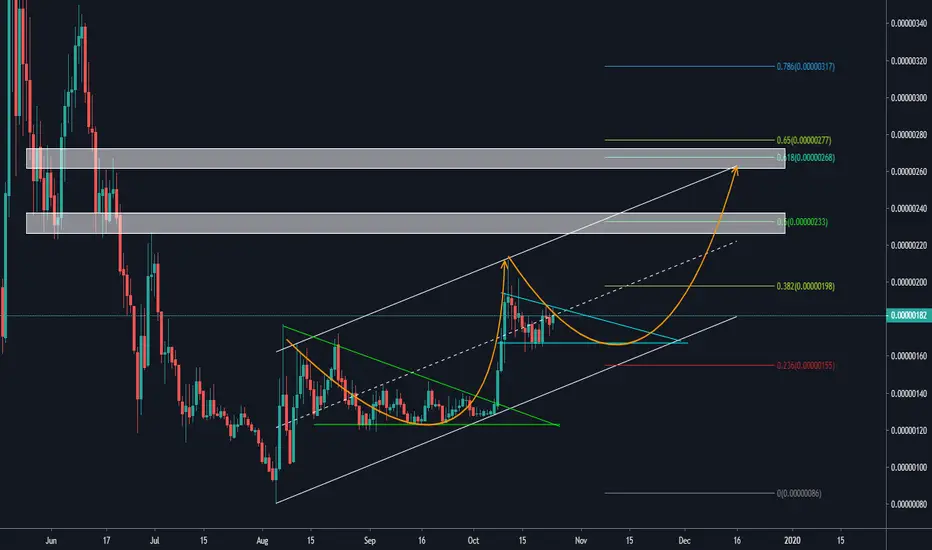
Matic network with possible 50% gain on SWINGThis is a quick update analysis about some of altcoins which have a good potential to grow and produce a possible huge profit in the near future. Let's do the technical analysis.
History is repeating itself is the most suitable quotes on MATIC here. we can see a similar pattern with previous structure in this huge up trend channel. we see a failure descending triangle which it broke to the upside. And in this current move, there is a possibility of it to repeating this previous pattern. A series of higher high and higher low can be a good reason for me to enter this trade.
If the price breaks out of the upper line of the triangle, I will enter the position and targeting the upper line of the huge up trend channel. 2 potential target that have the alignment with the previous price action is at around 230 and 270.
Watch out and let's be rich together.

ALXN - Monthly chart storyNote : Pharma cos can remain bearish/ bullish for extended time frames as a lot of the movement is based on future expectations and trials.
NASDAQ:ALXN has been in the descending triangle and has nicely tested support levels as indicated in the chart. Lovely similar formations on RSI and OBV, both confirming the downward trends
Descending triangles are bearish formations and if you look at the charts closely, most of the monthly, actually nearly all the monthly closes are below the 50 Day (to be read in this case as 50 period) moving average, again no respite as bearish.
The strategy here could be as follows
1. Ideal way would be to wait for breakout and sell when the support is breached
2. In case you want to Sell, then do as at the top of the triangle once it is rejected at the resistance level....
3. In case you had conviction on this pharma company, then Buy near supports when it bounces and retests the support zone and back in the triangle (this can be very dangerous as the formation is bearish)
If you like what you see, please share a thumbs up and your views in the comment section
Cheers

Triangles are awesome: a great exampleHello, I just posted an idea on why I don't like taking breakouts, I mostly do double bottoms on support, but I really loooooove Bit. Connnneeeect. Er I mean triangles.
And as a support and resistance "expert", I know when to buy or not (well sometimes). I got a idea of when they are probably not going to hold much longer, and you see, from one strategy it can open towards another one indirectly. Not good to short at resistance and you got a great pattern right under it? Might as well buy.
If I think shorting at a resistance is a losing strategy, then why not flip it on its head and go the opposite direction?
Looking quickly at some examples, not even S/R or EW, just the pattern, I can eyeball the smelly ones and potentially good:
I probably already made an idea on this, but let's go over it again :)
And guess where it went? Like a fing magnet!!!
Actually this one was really easy to spot, I even remember posting about it.
I don't think I took it and I think it was because I was afraid of being in mid july, I just decided to avoid the mid july to mid august period entirely. Have to take a break at some point anyway.
So unless you are a c**t like me, you have a brain therefore was bullish on gold rather than nonsense like Bitcoin, I really see no reason not to buy this if that's your timeframe and you trade gold (and didn't have other correlated trades going on...).
This is the kind of thing that you have to practice as so to be able to spot more easilly.
I want to look at agri, they're basically what extends most, more than anything else, and they have made so many people rich quick and famous.
This is where people get absolutely massive winners in short periods. Especially when they keep adding to their winner.
Warren Buffet had a massive winner with coca-cola, and people that bought Bitcoin in 2011, but that took a couple of years.
Here we are talking of a few days or weeks to get an absolute insane ripper.
I heard that once a future traded up to limit for 26 days straight, not sure what it was. Lmao I imagine anyone being short there XD RIP.
(trading up to limit means the price goes up the maximum that the CME will allow at which point trading is halted for the day...)
This is ok:
Well anyway, I know there are some nice formations in FX & hard commodities, and also Bitcoin, apart from that I don't really know.
There might be in other markets, but I just stick to what I know.
In any case it is something to look at backtest and if it works add to the list of tools.

Trading the Elliott Wave Principle - Part 5 (4)The gold weekly chart is part of our educational article "Trading the Elliott Wave Principle - Part 5."

Trading the Elliott Wave Principle - Part 5 (3)This chart is part of our educational article "Trading the Elliott Wave Principle - Part 5."

Trading the Elliott Wave Principle - Part 5 (2)The Gold weekly chart is part of our educational article "Trading the Elliott Wave Principle - Part 5
."
