Human vs MachinesChart patterns detection needs an extensive learning process and experience, no matter if you are a human or a machine!
Machine Learning Workflow:
There are five core tasks in the common ML workflow:
1. Get Data
2. Clean, Prepare & Manipulate Data
3. Train Model
4. Test Model
5. Improve
Since the chart patterns, beta version indicator has been released, I started working with it to find out how it works.
In the following examples, you will see the comparison between my pattern (left side) and platform pattern (right side)!
I activate the triangle, pennant, and wedge pattern indicator..!
1- Daily chart: machines did not detect anything:
2- 4 hours chart: machines did not detect anything:
3- 4 hour charts: I changed the regular time to extended hours!
Finally, the machine detects something..!
Educational point:
There are hundreds of thousands of indicators and oscillators out there, some work, some don't!
The question is:
Are you able to use them correctly and increase their performance???
Think about it..!
Best,
Moshkelgosha
DISCLAIMER
I’m not a certified financial planner/advisor, a certified financial analyst, an economist, a CPA, an accountant, or a lawyer. I’m not a finance professional through formal education. The contents on this site are for informational purposes only and do not constitute financial, accounting, or legal advice. I can’t promise that the information shared on my posts is appropriate for you or anyone else. By using this site, you agree to hold me harmless from any ramifications, financial or otherwise, that occur to you as a result of acting on information found on this site.
Triangle

Triangles, Flags, Pennants.Chart patterns, are becoming one of my favorites points of view in the market.
Using this tools i become more aware of where i am in the market, the trend and where i can place correct entry's
Lets consider the difficulty of this structures. First i am not using individual lines in this chart, i am using tool bar channels. That means that the line above has to be the same as the line below, that been said. the patterns showed in this chart are just made for expert traders. Simple and clean.
We can force some structures, but when we use tool bar patterns its very hard to find structures that make sense in the market.
Thanks fo the support traders.
And keep rocking in the free world.

How To Trade The Descending TriangleDraw line touching the lower highs which is the negative slope trend line. Draw horizontal level connecting equal highs. The horizontal level is a zero slope line.
Wait for a convincing close below the horizontal level.
This is a convincing close below the horizontal level. Draw the fib from the previous lower high touching the diagonal trend line. In this case, it is the the third lower high. The result is the 50% Fibonacci Retracement Level overlaps the Horizontal Level a little bit. That overlap is a confluence factor. Now wait for price to pull back to the 50% Retracement Level.
Price pulled back to the 50% Fibonacci Retracement Level, Horizontal Level, EMA 10 Level, and EMA 20 Level.
Set Measured Objective Target Using the Height of the Pattern.
Enter when the bear candles closes near 50% Fibonacci Retracement Level, Horizontal Level, EMA 10 Level, and EMA 20 Level. I would like to see a bearish price action signal at this level like a pin bar, rejection candlestick, or engulfing bar. This candlestick is not a engulfing bar on the 4H time frame, but it is still good enough for me to trade it. Price pulled back to the levels and produced a wick through the horizontal level. Price never closed above the horizontal level. If price closed above the horizontal level, then discard the trade idea.

How To Trade Ascending Triangle Using A Buy Limit Order (CADJPY)Price closed above horizontal support resistance level. Set Buy Limit Order. Set entry at horizontal level.
Note: Trend is up; Horizontal Level has 4 touches. EMA 10 EMA 20 has a positive slope.

How To Trade Yen Pair With Ascending Triangle (CADJPY)Price closed above 90.334. Now, wait for a price action signal at 90.334.
First price action signal is engulfing candlestick. Enter at 90.505.
Second price action signal is engulfing candlestick. Enter at 90.538. Set Take Profit at 91.185. Set Stop Loss at 90.312. The Reward:Risk Ratio is 2.86.
Note: The EMA 10, EMA 20, and Trend Line have a positive slope. The higher low touches the Horizontal Support, EMA 10 Support, EMA 20 Support, and Trend Line Support.

Symmetrical triangle pattern: definition & interpretationWhat is a Symmetrical Triangle?
Triangle patterns are probably the most popular chart patterns studied by traders.
There are three different types of triangles: The ascending triangle, the descending triangle, and the symmetrical triangle.
Symmetrical triangles occur when price is consolidating in a way that generates two converging trend lines with similar slopes. It is called "horizontal" because it forms a holding pattern with around 90 bars in which the price moves sideways.
The symmetrical triangle usually forms during a trend as a continuation pattern. They tend to break in the direction of the initial move before the triangle formed. But it can be a powerful reversal pattern, in the event of failure.
As the market continues to trade in a sideways pattern, the range of trading narrows and the apex of the triangle is formed. The apex of the triangle is a place where supply and demand intersects. The more price approaches the apex, the bigger the chance of a breakout. The pattern will be completed after the breakout (in either direction)
A breakout or failure of a triangle pattern, especially on large volume, can be a strong signal of a resumption, or reversal, of the previous trend.
Interpretation of the Symmetrical Triangle Pattern
Symmetrical triangles, are thought of as continuation patterns developed in markets that are, for the most part, aimless in direction. This Pattern reveals that the market is very unsure about what is going on. Investors do not know what position to take.
The triangle pattern shows losing interest, both from the buy-side as well as the sell-side. During this period of indecision, the highs and the lows seem to come together at the apex of the triangle with virtually no significant volume. The supply and demand seem to be one and the same.
A symmetrical triangle pattern is the result of the contraction of volatility in the market. In other words, volatility is constantly decreasing.
In essence, the symmetrical triangle represents a period of consolidation where traders find a chance to take a breath before the price is forced to break out.
Construction of the Pattern
• Support Trendline
In technical analysis, support is defined as the price floor where a downtrend can be expected to pause. A trendline that connects a series of lows over a period of time is defined as a support trendline. Think of the lower trendline, as the demand line, which represents support on the chart. At this point, the buyers outpace the sellers, and the price begins to rise.
• Resistance Trendline
A resistance trendline is a downtrend line that connects a series of highs together.
• Triangle’s Height
The height is the distance between the initial high and low of the triangle pattern. This parameter is commonly used as a breakout target for the symmetrical triangle pattern.
• Apex of the Triangle
The apex of a triangle is the intersection point of the support and resistance trendline.
Pros & Cons of Trading Symmetrical Triangle Pattern
• Pros
▹Symmetrical triangles can form in any time frame.
▹These patterns are a sign of an impending breakout. Once the pattern is completed, we will probably have an explosive price movement.
▹A symmetrical triangle is a reliable continuation pattern, so the direction of the breakout can be guessed, based on the prior trend direction.
• Cons
▹False breaks are common with symmetrical triangle patterns and can lead to significant losses.
▹Compared to other chart patterns, triangles take longer to develop and become identifiable.
The Bottom Line
The triangle pattern is one of the most common and popular chart patterns in technical analysis. A better understanding of this pattern and the reasons why it appears on the chart can help us better understand market behavior and identify trading opportunities.

How To Trade The Ascending TriangleTrade The Ascending Triangle
Engulfing Candle at Diagonal Trend Line Support, EMA 10 Support, and EMA 20 Support. Price Action Signal is Engulfing Candlestick. (First Entry At 128.231)
Pin Bar at Diagonal Trend Line Support, EMA 10 Support, EMA 20 Support and Horizontal Line Support. Price Action Signal is Pin Bar. (Second Entry At 128.310)

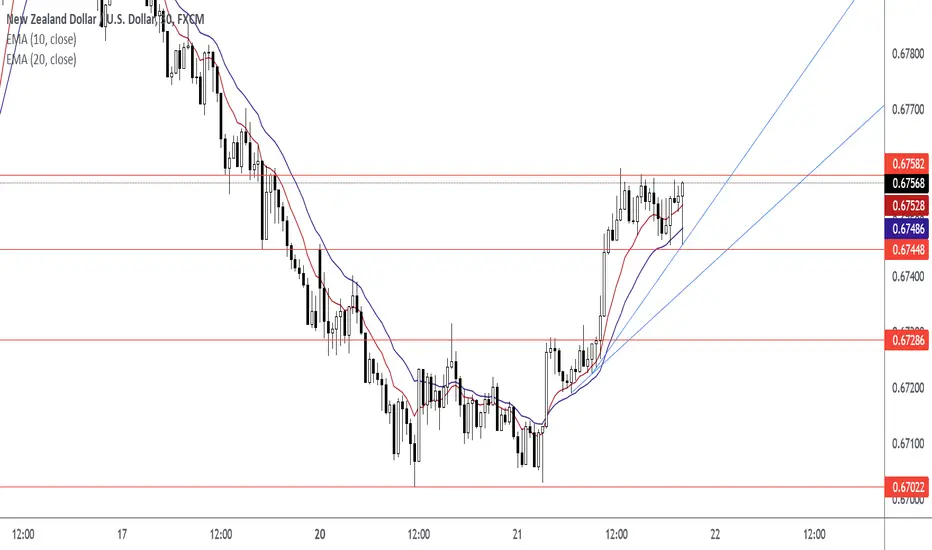
How To Trade The Ascending TriangleThe Breakout (note: the emas are too far away from current price for an entry; watch for a price action signal at the emas; watch for a pull back to the emas)
First Entry At 0.67540
Second Entry At 0.67568
How To Trade The Ascending Triangle Before The BreakoutHow I Trade The Ascending Triangle
Engulfing Candle (Price Action Signal)
First Entry at 0.71194
Candlestick Closed Above Level
Second Entry at 0.71273
Retest Candlestick and Rejection Candlestick at 0.71295
Third Entry
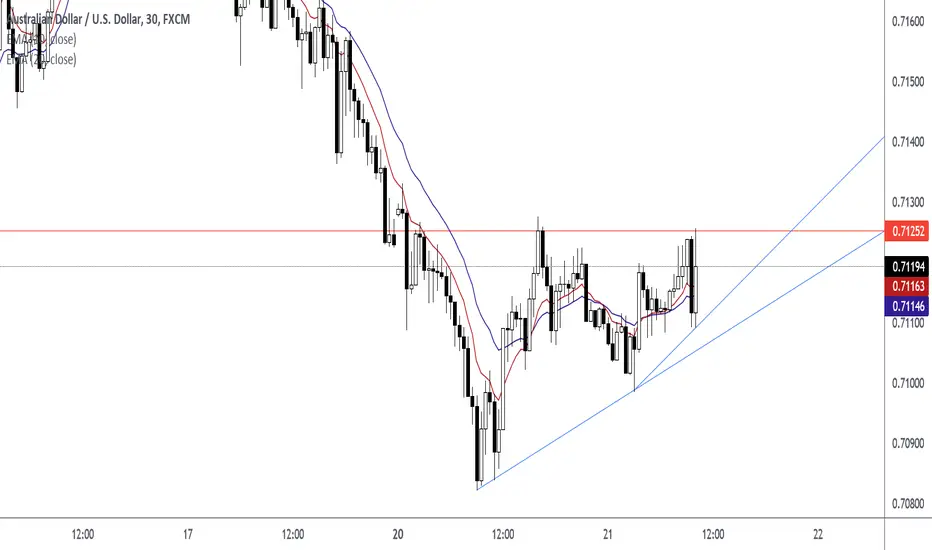
Chart Patterns | Triangles & ChannelsChart Patterns | Triangles & Channels
1- Ascending Triangle :-
An ascending triangle is a type of triangle chart pattern that occurs when there is a resistance level and a slope of higher lows.
2- Descending Triangle :-
In descending triangle chart pattern, there is a string of lower highs that forms the upper line. The lower line is a support level in which the price cannot seem to break.
3- Symmetrical Triangle :-
A symmetrical triangle is a chart formation where the slope of the price’s highs and the slope of the price’s lows converge together to a point where it looks like a triangle.
4- Parallel Channel :-
A Parallel Channel is a chart pattern formed when the price is bounded by parallel support and resistance levels.
5- Ascending Channel :-
An ascending channel is a chart pattern formed from two upward trend lines drawn above and below a price representing resistance and support levels.
6- Descending Channel :-
A descending channel is a chart pattern formed from two downward trendlines drawn above and below a price representing resistance and support levels.
Please like the idea for Support & Subscribe for More ideas like this and share your ideas and charts in Comments Section..!!
Thanks for Your Love & Support..!!

PRICE ACTION PATTERNS | Descending Triangle 🔰
Hey traders,
In this video, you will learn a classic price action pattern "Descending Triangle".
Main topics covered:
Structure of the pattern
Bias of the pattern
Triggers
Stop placement
Target selection
Real market example
Let me know in a comment section what pattern do you want to learn in the next video!
❤️Please, support this video with like and comment!❤️

How To Trade The Symmetrical Triangle (Higher Lows, Lower Highs)Lower Highs are represented by the diagonal trend line. These lower highs are the resistance line.
Higher Lows are represented by the diagonal trend line. These higher lows are the support line.
Breakout Candlestick
Retest Candlestick
How To Trade The Triangle Chart Pattern
First, Look For An Up Trend
Second, Draw Diagonal Support Line and then draw Diagonal Resistance Line. These lines are your levels.
Third, Wait For The Breakout Candle. Enter after the candle closes.
Fourth, Wait For A Candlestick To Retest Diagonal Trend Line. Enter after the retest candlestick closes.
Fifth, Set Target Using Height of Pattern

My Strategy Works On All Markets and All Time FramesPrice closed above EMA 20, EMA 10, Horizontal Support Resistance, and Trend Line. A pin bar formed on the retest and the pin bar candlestick wick protruded through the support levels. The support levels are EMA 20, EMA 10, Horizontal Support Resistance, and Trend Line.
In this example, there are three higher lows moving into a diagonal resistance level and a horizontal resistance level. Price broke through those two levels and retested those levels with a pin bar. After the break and close above the horizontal and diagonal level; those levels became support.
Entry is the closing price of the pin bar. Target price is the previous swing high.

HOW-TO: Automatic Pattern Detection in TradingViewChart patterns are a part of the foundation of technical analysis and are one of the most popular methodologies used by traders to predict future price variations.
Chart patterns are governed by precise identification guidelines and it is important to effectively recognize the presence of a specific pattern. Since this recognition process can be subjective, we designed a robust and efficient algorithm for the detection of traditional chart patterns, saving users valuable time.
In this post, we describe how to effectively use the Automatic Pattern Detection inside our main toolkit, Lux Algo Premium .
Using The Pattern Detection Feature
The Automatic Pattern Detection can be enabled within the Lux Algo Premium toolkit directly from SR Mode.
When enabled, a new cell on the dashboard will appear showing the current detected pattern. When no patterns are detected the dashboard will indicate the absence of a pattern and dashed lines will be displayed that can be used as support and resistance.
The Pattern Detection feature at the time of this publication can detect the most commonly traded chart patterns, including:
Rising/Falling Wedges
Ascending/Descending/Symmetrical Triangles
Head And Shoulders
Inverse Head And Shoulders
Double Tops/Bottom
Note that the Pattern Detection algorithm depends on the current SR significance selected. Higher SR significance aims to return longer-term pattern structures.
Examples
Below are some examples of detected chart patterns using the Automatic Pattern Detection.
Rising Wedge
Falling Wedge
Ascending Triangle
Descending Triangle
Symmetrical Triangle
Head & Shoulders
Inverted Head & Shoulders
Double Top
Double Bottom
Tips
Once you have noticed a promising detected pattern, it is important to look at various other factors to gain confidence on its validity, as well as having a good plan in order to trade it.
You can see if an ongoing pattern requires your attention by looking at indicators or possible patterns on lower/higher timeframes and checking if this information lines up with the ongoing pattern as well.
Certain patterns require certain volume trends in order to asses their validity. Some require down-trending volume, others require up-trending volume, and some require significant volume during a breakout.
It is possible to set take profits and stop losses when trading chart patterns using measure rules. Measure rules have been described by Bulkowski for several patterns.
We have an ongoing series about classical and more exotic patterns that you can read in order to understand them at a deeper level with education on identification rules, measure rule, and causes:

price action patterns you need to know ( part 1 ) Hi friends
i'll share with you some price action
patterns you should know .
I don't like posting a picture with 100 patterns .
I would like to post this in steps so that you can understand more and make things clear .
1- ascending triangle generally happens in an uptrend and is a bullish pattern , you can set your order after the breakout of the horizontal line with a good volume candle .
- descending Triangle Pattern is the exact opposite of the ascending triangle pattern. It is a bearish continuation pattern indicating that the prior downtrend will continue and you set your order after the brakout of horizontal line with a good volume candle .
please support me with like and follow me for more ideas and tell me what do you think about that

Triangle Patterns - Advanced AnalysisChart patterns describe distinct structures in financial time series. Their occurrence helps technical analysts predict future price variations.
Triangle patterns form a part of the most studied patterns by technical analysts and have been well documented over the years, with some even applied to climate time-series data (1). In this post, we perform an analysis of ascending, descending, and symmetrical triangles patterns.
We provide a description of each pattern and its implications, as well as a model of the price variation within each described pattern. We also review the literature in order to find their deterministic cause.
To knowledgeable investors, chart patterns are not squiggles on a
price chart; they are the footprints of the smart money.
- Bulkowski (2)
1. Ascending Triangles
Ascending triangles are characterized by a series of rising local minima (higher lows) and a series of local maxima staying at a relatively fixed level. A line is drawn from the rising minima, forming an upward sloping support line. Another line is drawn from the maxima, forming a horizontal resistance line. The apex represents the point where both lines intersect.
Ascending Triangles have a bullish bias. Once the price breaks the resistance line we can expect a rapid increase of the price. This breakout is often accompanied by an increase in volume, while the volume prior to the breakout was declining. Note that this is not a pre-requisite.
Example of ascending triangle on CALX daily.
2. Descending Triangles
Descending triangles are characterized by a series of declining local maxima (lower highs) and a series of local minima staying at a relatively fixed level. A line is drawn from the declining maxima, forming a downward sloping resistance line. Another line is drawn from the minimal, forming a horizontal support line.
Descending Triangles have a bearish bias. Once the price breaks the support line we can expect a rapid decrease of the price. Like ascending triangles, this breakout is often accompanied by an increase in volume, while the volume prior to the breakout was declining.
Example of descending triangle on CORN daily.
3. Symmetrical Triangles
Symmetrical triangles are characterized by a series of declining local maxima (lower highs) and a series of increasing local minima (higher lows). A line is drawn from the declining maxima, forming a downward sloping resistance line. Another line is drawn from the minima, forming an upward sloping support line. Both support and resistance lines should have an approximately equal slope.
Symmetrical triangles do not have a particular bullish or bearish bias, and are sometimes used to indicate market uncertainty. The expected outcomes depend on where a breakout is occurs. If the price breaks the resistance, we can expect an increase of the price, while a breakout of the support can be followed by a decrease of the price.
Example of symmetrical triangle on PFO daily.
4. Pattern Modelling
Describing price variations within patterns with a general mathematical formulation can help us describe more complex occurrences of the patterns.
Consider the price within a valid triangle as y'(t) , with support S(t) and resistance R(t) . We can describe y'(t) as follows:
y' = S + A × (R - S ) + e
with A(t) approximately periodic and in an approximate range (0,1) and e(t) as noisy component.
We can see that A(t) is subject to linear damping (the amplitude of price variations within the triangle tend to reduce linearly over time).
This model is very general and can be further developed, but it can be used as the basis for assessing the validity of triangle patterns in the next section.
5. Pattern Validity
The validity of a triangle pattern can depend on a wide variety of factors and can change from analyst to analyst.
The price concentration around the support/resistance should be relatively even, that is price should fill the triangle (as described by Bulkowski).
Bulkowski strongly suggests at least two minor highs and two minor lows should be inside the triangle formation. An additional filter is introduced by Bulkowski, the 5% failure , suggesting that a breakout should have a relative distance superior to 5% from the broken line in order to avoid reversals.
Our previous model can be used to determine the validity of a potential triangle pattern. The apex angle is directly related to the magnitude of A(t) and e(t) , with lower angle values returning a lower signal to noise ratio. This is bad since A(t) is an essential component for the structure of the triangle. If A(t) ≈ e(t) then we cannot validate the presence of a triangle pattern, since it is more likely to have been the result of noise.
6. Measure Rule
The measure rule allows anticipating the magnitude of a breakout. This allows the trader to easily set take profit/stop losses, which enables a higher control over the risk a trader would be taking trading a triangle pattern.
For ascending triangles the predicted magnitude of a breakout is equal to the value of the resistance minus the first local minima inside the triangle.
For descending triangles the predicted magnitude of a breakout is equal to the value of the first local maxima inside the triangle minus the support value.
For symmetrical triangles, the predicted magnitude of a breakout is equal to the highest local maxima inside the triangle minus the lowest local minima inside the triangle.
We can see that for ascending and descending triangles, a breakout of the non-horizontal line would imply a weaker breakout the closer the price is to the apex. In fact, the breakout magnitude would decay linearly. This is also true for symmetrical triangles. This is mentioned by Fisher (3):
- The more the price moves to the very end of a triangle, the weaker will be the breakout in either direction.
7. Theoretical Explanation Of The Occurrence Of Triangle Patterns
Explaining the presence of patterns in financial time series is a challenging task. Under a purely efficient market the presence of patterns would simply be the realization of random fluctuations.
A more challenging question would be: "how could market participants cause triangle patterns?"
If we assume that market participants cause the patterns, we know from the pattern descriptions that a mechanism inducing damped oscillatory variations exists. This oscillation is explained by Caginalp and Balenovich by two groups having asymmetric information/opinions (4).
Certain analysts describe triangle patterns as a temporary control switch between sellers and buyers, with scenarios being determined by the amount of energy exhausted by buyers and sellers.
8. Conclusion
In this post, we provided a description of triangle patterns. We highlighted the link between the signal-to-noise ratio and the apex angle of a triangle in order to determine its validity, as well as the measure rule for predicting the magnitude of a breakout.
We finally briefly mentioned the theoretical explanation behind the occurrence of triangles patterns in the market. This subject is complex and lacks further research, we highly recommend reading Caginalp & Balevonich on the subject.
Bulkowski offers an extensive number of statistics regarding triangles in his encyclopedia of chart patterns.
9. References
(1) Kaiser, J. (2016). Chart Pattern in Climate Time Series Data . Urban & Regional Resilience eJournal.
(2) Bulkowski, T. N. (2021). Encyclopedia of chart patterns . John Wiley & Sons.
(3) Fischer, R., & Fischer, J. (2003). Candlesticks, Fibonacci, and chart pattern trading tools: a synergistic strategy to enhance profits and reduce risk (Vol. 209). John Wiley & Sons.
(4) Caginalp, G., & Balevonich, D. (2003). A Theoretical Foundation for Technical Analysis . Capital Markets: Market Microstructure eJournal.

What is Ascending Triangle Pattern?What is an Ascending Triangle Pattern?
Ascending Triangle Pattern is a continuation pattern that means when it plays out it will continue the preceding trend. It is created by price moves that allow for an upper horizontal line to be drawn along the swing highs, and a lower rising trendline to be drawn along the swing lows. These two lines form an ascending triangle. Traders here usually watch for breakouts from upper resistance in ascending triangle patterns.
How does the Ascending Triangle Pattern work?
After the prior uptrend when investors try to book profits it creates a resistance that leads to a high supply zone. But due to the prior uptrend investors are still interested in the asset which leads to picking up in demand slowly, resulting in a rising trendline. Time in this phase is also a crucial element. The longer this pattern consolidates, the more chances it has to give a possible breakout to continue the uptrend.
Why is the Ascending Triangle Pattern Unique?
Ascending triangle patterns usually have a higher breakout success rate than symmetrical triangle patterns. In an ascending triangle, higher lows are constantly being built, which shows there is a strong demand for the asset.
Role of Volume:
Volume plays a major role in the completion of all major patterns. The horizontal trendline which acts as resistance can give spikes in volume. We will call it a breakout when a candle closes above horizontal resistance level with a great volume spike or rise in average volume.
Above Chart Explanation:
This is the 4H chart of FTTUSDT with a clear preceding upward trend. After the uptrend, we enter the second phase where the upper horizontal line becomes resistance 4 times in a row and the lower rising trendline becomes support 3 times in a row. As we have observed here FTTUSDT consolidated for nearly 1 month in an ascending triangle pattern, which finally led to a super bullish breakout.
Two Possible Entries:
Entry 1: On rising support, when the price touches the rising support trendline and if there is rising average volume, it makes a good entry with a stop loss placed below the previous higher low point.
Entry 2: On resistance breakout, we should wait for the 4H candle to close above the resistance to confirm the breakout’s validity. Once the breakout is valid, a potential opportunity would be to enter at the close of the 4H candle with a stop loss placed a little below the breakout level. Usually, we should target the height of the triangle after the breakout.
Comment down your thoughts on Ascending Triangle Pattern in the comment section.
Disclaimer:
This is just an educational post. Never trade just any pattern. And please do your research before making any trades.
Happy Trading!

Triangular Wave PatternsThis is an educational idea that represents the types of corrections that the triangular marking makes, either bearish or bullish depending on the trend. This can go a long way in various markets so that you can identify where the market is likely to go.

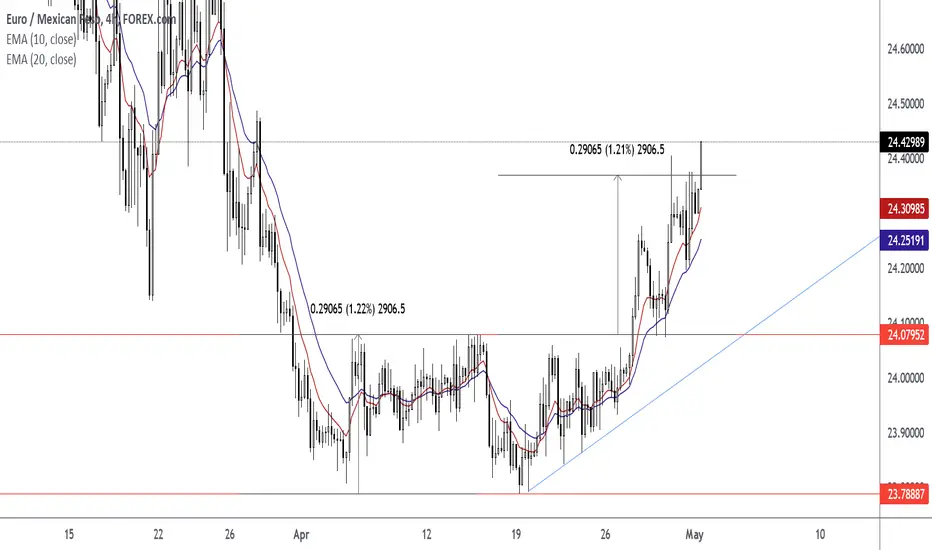
How To Trade The Ascending Triangle + Double Bottom ComboWait For The Close Above the Neckline at Horizontal Level 24.07952. After the close above level; resistance level turned support.
Wait For The Retest Of The Neckline At 24.07952. Watch For A Pin Bar or Rejection Candlestick to form at the horizontal neckline.
Enter Trade At The Closing Price Of Pin Bar or Rejection Candlestick.
Set Target Price Using Measured Objective Of Pattern. Measured Objective Is 24.37017. Measured Move Is 2906.5. Height Is 2906.5.
Exit Trade At Target Price.
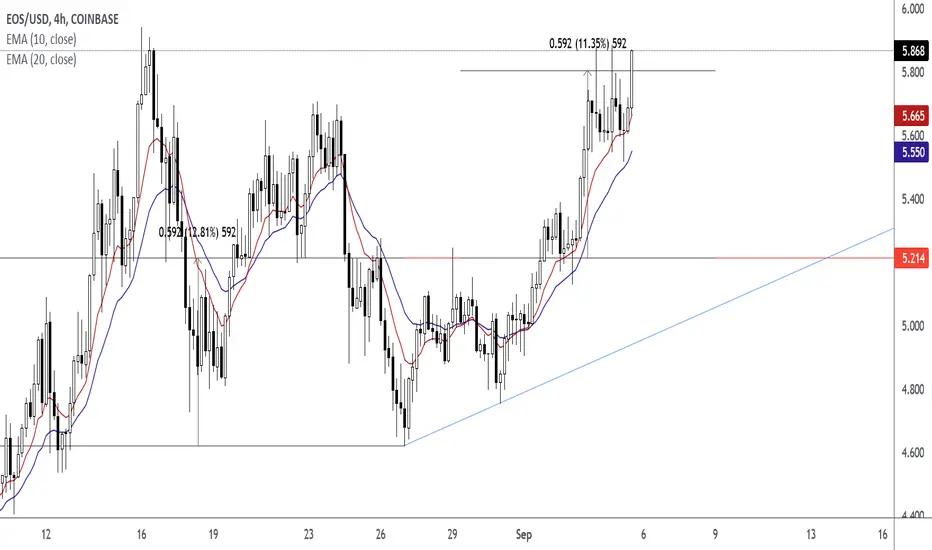
How To Trade The Ascending Triangle Trading The Ascending Triangle
Wait For The Close Above The Horizontal Level
Wait For The Retest in the form of a pin bar or rejection candlestick.
Enter At The Close Price of Pin Bar or Rejection Candlestick
Exit At The Measured Objective of Pattern. The Height of Pattern is 592.
Triangles PatternsWe have 3 different main types of triangle patterns.
Symmetrical
Ascending
Decending

Descending Triangle Patternhe descending triangle pattern is one of the top continuation patterns that appear in the middle of a trend. Traders anticipate the market to continue in the direction of the bigger trend and accordingly develop trading setups.

What is Symmetrical Triangle Pattern?What is a Symmetrical Triangle Pattern?
The Symmetrical Triangle is usually a continuation pattern. It represents a pause in the existing uptrend after which the original uptrend gets resumes. A breakout from the upper trend line marks the continuation of an uptrend while a breakdown from the lower trend line marks the start of a new bearish trend. This pattern is also known as a wedge chart pattern.
How does Symmetrical Triangle Pattern Work?
Phase 1: Existing Uptrend
When there is an extreme demand in prices there is an uptrend. It continued as the demand increases.
Phase 2: Pause
When demand is equal to supply the there is a pause in an uptrend and investors start to book profits here. As prices consolidate it forms converging trend lines. As there is equal demand and supply investors buy on the lower trend line and sell on the upper trend line. Which results in forming a Symmetrical Triangle Pattern.
Phase 3: Uptrend Continuation
After demand matching the supplies when there is when buyers are again interested to buy demand increases. Which results in breakout! And the continuation of the uptrend.
Role of Volume:
Volume plays a major role in a symmetrical triangle pattern. When in an uptrend the volume is quite higher. In the second phase, the volume starts to diminish due to equal demand and supply. And again on the breakout, the volume surges. Volume with Breakout gives a good indication of a successful uptrend.
Above Chart Explanation:
This is a 4H chart of AXSUSDT we can see it's in an uptrend previously with good volumes. Now after successful uptrend prices consolidate with diminishing volumes. And after it, there is a breakout with above-average volumes. And then the uptrend continues.
Conclusion:
Symmetrical Triangle Pattern is a continuation pattern. Which on upper trend line breakout can give a potential bull move and when on lower trend line breakout gives a possible bear move.
Comment your thoughts on Symmetrical Triangle Pattern down below.
Disclaimer:
This is just an educational post never trade just any pattern. And please do your research before making any trades.
Happy Trading!
