Opening Candle Indicator FinalAll previous versions were subject to bugs after review, so this final version has been released with the same features as previous versions and is error-free.
Note for those trading outside the Saudi and US markets: You can track any market with a specific trading session start and end time by selecting "Custom" from the settings menu and then setting the start and end times for the trading session.
جميع الاصدارات الماضية كانت بعد الفحص تصدر بعض الأخطاء البرمجية لذلك تم إصدار هذا الاصدار النهائي بنفس المميزات للإصدارات الماضية ولا يوجد بها أخطاء.
ملاحظة لكل من يتدوال خارج السوق السعودي والأمريكي : يمكن متابعة أي سوق له وقت بداية ونهاية جلسة تدوال وذلك عن طريق إختيار مخصص من قائمة الاعدادت ثم وضع وقت بداية ونهاية جلسة التدوال
Candlestick analysis

PH, PD High/LowWhen applied, this script draws the previous day's high and low lines. It also plots the open price of the current 1-hour and 4-hour candles. Additionally, it displays the high and low of the previous 1-hour and 4-hour candles. Please note that 4-hour lines are shown only on the 15-minute and 4-hour charts, while 1-hour lines are shown only on the 5-minute and 1-hour charts.

Order Blocks v2Order Blocks v2 – Smart OB Detection with Time & FVG Filters
Order Blocks v2 is an advanced tool designed to identify potential institutional footprints in the market by dynamically plotting bullish and bearish order blocks.
This indicator refines classic OB logic by combining:
Fractal-based break conditions
Time-level filtering (Power of 3)
Optional Fair Value Gap (FVG) confirmation
Real-time plotting and auto-invalidation
Perfect for traders using ICT, Smart Money, or algorithmic timing models like Hopplipka.
🧠 What the indicator does
Detects order blocks after break of bullish/bearish fractals
Supports 3-bar or 5-bar fractal structures
Allows OB detection based on close breaks or high/low breaks
Optionally confirms OBs only if followed by a Fair Value Gap within N candles
Filters OBs based on specific time levels (3, 7, 11, 14) — core anchors in many algorithmic models
Automatically deletes invalidated OBs once price closes through the zone
⚙️ How it works
The indicator:
Tracks local fractal highs/lows
Once a fractal is broken by price, it backtracks to identify the best OB candle (highest bullish or lowest bearish)
Validates the level by checking:
OB type logic (close or HL break)
Time stamp match with algorithmic time anchors (e.g. 3, 7, 11, 14 – known from the Power of 3 concept)
Optional FVG confirmation after OB
Plots OB zones as lines (body or wick-based) and removes them if invalidated by a candle close
This ensures traders see only valid, active levels — removing noise from broken or out-of-context zones.
🔧 Customization
Choose 3-bar or 5-bar fractals
OB detection type: close break or HL break
Enable/disable OBs only on times 3, 7, 11, 14 (Hopplipka style)
Optional: require nearby FVG for validation
Line style: solid, dashed, or dotted
Adjust OB length, width, color, and use body or wick for OB height
🚀 How to use it
Add the script to your chart
Choose your preferred OB detection mode and filters
Use plotted OB zones to:
Anticipate price rejections and reversals
Validate Smart Money or ICT-based entry zones
Align setups with algorithmic time sequences (3, 7, 11, 14)
Filter out invalid OBs automatically, keeping your chart clean
The tool is useful on any timeframe but performs best when combined with a liquidity-based or time-anchored trading model.
💡 What makes it original
Combines fractal logic with OB confirmation and time anchors
Implements time-based filtering inspired by Hopplipka’s interpretation of the "Power of 3"
Allows OB validation via optional FVG follow-up — rarely available in public indicators
Auto-cleans invalidated OBs to reduce clutter
Designed to reflect market structure logic used by institutions and algorithms
💬 Why it’s worth using
Order Blocks v2 simplifies one of the most nuanced parts of SMC: identifying clean and high-probability OBs.
It removes subjectivity, adds clear timing logic, and integrates optional confluence tools — like FVG.
For traders serious about algorithmic-level structure and clean setups, this tool delivers both logic and clarity.
⚠️ Important
This indicator:
Is not a signal generator or financial advice tool
Is intended for experienced traders using OB/SMC/time-based logic
Does not predict market direction — it provides visual structural levels only

Structure Break + Confirmation (First Signal Only)Swing Detection:
A Swing High is detected when the high of the central candle (based on a lookback period) is greater than the highs of the candles before and after.
A Swing Low is detected when the low of the central candle is lower than the lows of the candles before and after.
Break of Structure (BOS):
A BOS Up is confirmed when a candle closes above the most recent swing high (with a body close).
A BOS Down is confirmed when a candle closes below the most recent swing low.
Confirmation (CONF):
A CONF Up is triggered when price makes a new high after a BOS Up.
A CONF Down is triggered when price makes a new low after a BOS Down.
Only the first confirmation after a BOS is plotted.
Visuals:
Cross marks (×) are plotted at swing points.
BOS signals are shown with green (up) and red (down) labels.
CONF signals are shown with lime (up) and orange (down) triangle markers.
Dotted lines are drawn at the levels of broken swing highs/lows.


Volume Exhaustion RSI Reversal StrategyKey Features:
Volume Logic:
1. Identifies two consecutive red bars (down periods) or green bars (up periods)
2. First down or up bars has the highest volume of the three
3. Volume decreases on the second down or up bars
4. Current (third) bar is green for up Reversal or red for down Reversal with higher volume than second bar
RSI Logic:
Uses standard 14-period RSI
Detects "V" shape pattern (decline, trough, rise)
Requires trough value <= 30 (oversold condition) or <= 70 (overbought condition)
Current bar shows RSI rising from trough
Execution:
Enters long/Short position when both volume and RSI conditions are met
Plots green "BUY/SELL" labels below the trigger candle
Visualization:
Green "BUY/SELL" labels appear below qualifying candles
Strategy positions shown in the strategy tester
How To Use:
Apply to any timeframe (works best on 5M-15M charts)
Combine with price action confirmation for example when candle 3 closes above candle 2 for "BUY" Or when Closes below for "SELL"
Ideal for oversold reversals in downtrends
Works best with volume-based assets
Note: The strategy enters at the close of the trigger candle. Always backtest before live trading and consider adding stop-loss protection.

MaxEvolved v2 - UT BotA powerful aggregate of indicators. Uses UT Bot, EMA, RSI, MACD & Hull MA to determine a potential position.
Drawing X means UT Bot and RSI crossing conditions are met.
Drawing big BUY or SELL signal means all conditions are met.
Un puissant agrégat d'indicateurs. Utilise UT Bot, EMA, RSI, MACD& Hull MA pour déterminer une position potentielle.

No Supply / No Demand Candle with AlertsScript triggers alerts based on specific candle behavior that matches the No Supply (NS) or No Demand (ND) logic, which combines price action, volume, and candle body size.

FS JIMENEZ)FS JIMENEZ is a tactical breakout-retest strategy optimized for volatile price action and disciplined entries. It features:
• Swing structure validation
• Smart cooldown and price spacing logic
• SL compression after 3 bars
• Dynamic TP targeting based on candle strength and ATR
• Optional trailing SL via buffer multiplier
Built for traders seeking precision and controlled exposure across volati

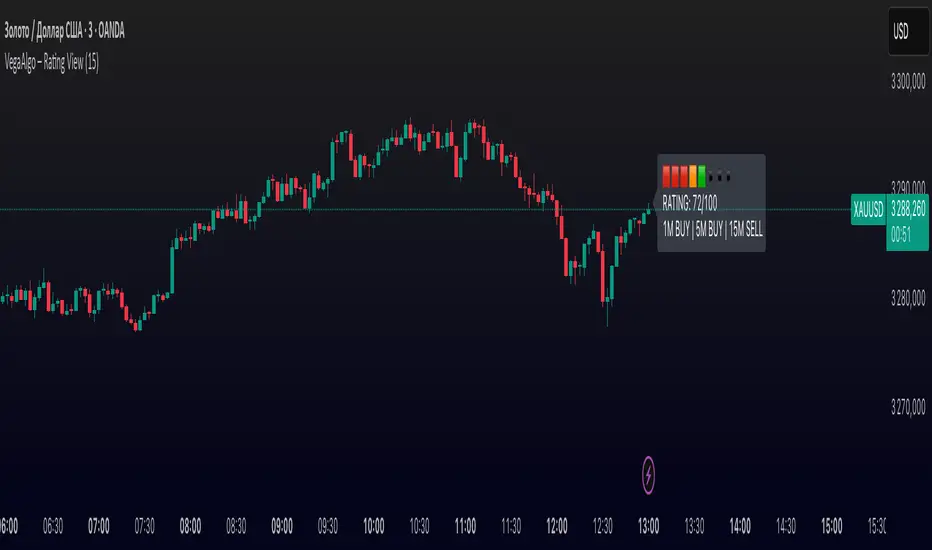
VegaAlgo – Rating ViewVegaAlgo – Rating View is a market condition analysis tool designed to evaluate the current price structure.
The indicator calculates a RATING (from 0 to 100) that reflects how clean, directional, and structured the recent price movement is. The rating is based on the number of price direction changes (from bullish to bearish candles and vice versa) within a selected period. Fewer direction changes indicate a clearer trend and result in a higher rating, while a choppy or highly volatile market leads to a lower score.
Additionally, the indicator provides directional signals on three key timeframes — 1M, 5M, and 15M, using a comparison of fast and slow moving averages. This allows traders to quickly assess the dominant trend both locally and across higher timeframes.
This script is intended for visual market analysis only and should not be considered financial advice.
Breakout Retest Visualizer (with Confluence)Breakout Retest Visualizer (Smart Money Edition)
This indicator is designed for day traders who rely on price action, breakout structure, and smart confluence filters to identify high-quality trade opportunities during the New York session.
🚀 What It Does:
Plots Yesterday's High & Low as static reference levels.
Tracks the New York open price with a horizontal line.
Detects breakouts above Yesterday’s High or breakdowns below Yesterday’s Low.
Confirms valid breakouts only when 4 key confluences align:
✅ EMA 9 & EMA 21 trend alignment
✅ RSI momentum confirmation (RSI > 55 or < 45)
✅ Volume spike (volume > 20-bar average)
✅ Within New York session hours (9:30am – 4:00pm EST)
Marks Breakout Retests and highlights strong continuation signals with “Runner” labels.
📈 Visual Markers:
🟢 Green "Runner" = Bullish continuation after retest
🔻 Purple Triangle = Bullish breakout retest zone
🔴 Red "Runner" = Bearish continuation
🔺 Yellow Triangle = Bearish breakdown retest
🎯 Who It’s For:
Ideal for intraday scalpers and momentum traders who want:
Clean breakout structure
Smart money-style retests
High-confidence entries backed by volume, trend, and RSI confluence
🧠 Tips for Use:
Use the retest markers to plan precise entries after structure breaks.
Combine this with order blocks or FVG zones for deeper confluence.
Avoid trading during pre-market or low-volume hours.

高级超买超卖 & 变盘信号Very interesting indicator, normalised with four overbought and oversold algorithms, plus a change alert. It's very practical.

BK AK-SILENCER🚨 Introducing BK AK-SILENCER — Volume Footprint Warfare, Right on the Price Bars 🚨
This isn’t a traditional indicator.
This is a tactical weapon — engineered to expose institutional behavior directly in the bar data, using volume logic, CVD divergence, and spike detection to pinpoint who’s really in control of the tape.
No panels. No clutter.
Just silent execution — built directly into price itself.
🔥 Why "SILENCER"?
Because real power moves in silence.
Institutions don’t chase — they build positions quietly, in size, beneath the surface.
BK AK-SILENCER gives you a real-time edge by visually revealing their footprints through color-coded bar behavior, divergence signals, and volume spike alerts — all directly on your chart.
🔹 “AK” honors my mentor A.K., whose training forged my trading discipline.
🔹 “SILENCER” represents the institutional mindset — high impact, low visibility. This tool lets you trade like them: without noise, without hesitation, with deadly clarity.
🧠 What Is BK AK-SILENCER?
A bar-level institutional detection tool, purpose-built to:
✅ Color-code bars based on volume aggression and close-location inside range
✅ Detect real-time bullish and bearish divergences between price and volume delta
✅ Tag volume spikes with a $ symbol to expose potential traps or silent position builds
✅ Overlay VWAP for real-time mean-reversion biasing
No extra windows.
No indicators talking over each other.
Just pure volume-logic weaponry embedded into price.
⚙️ What This Weapon Deploys
🔸 Bar Coloring Logic (Volume Footprint)
🟢 Power Buy = Strong close near highs on elevated volume
🟩 Accumulation = Weak close but still heavy volume
🔴 Power Sell = Strong close near lows on heavy selling
🟥 Distribution / Weakness = Low close without commitment
❗ Extreme Volume Spikes marked with $ — using standard deviation to highlight institutional bursts
🔸 CVD Divergence Detection
→ Tracks cumulative volume delta and compares it to price pivot behavior
Bullish Divergence = Price makes lower lows, CVD makes higher lows → hidden accumulation
Bearish Divergence = Price makes higher highs, CVD makes lower highs → hidden distribution
All plotted directly on bars with triangle markers.
🔸 VWAP Overlay (Optional)
→ Anchored VWAP gives immediate context for intraday bias — above VWAP = demand, below = supply
🎯 How to Use BK AK-SILENCER
🔹 Silent Reversal Detection
Bullish divergence + Power Buy bar + VWAP reclaim = sniper entry
Bearish divergence + Power Sell bar + VWAP rejection = trap confirmation
🔹 Volume-Based Entry Triggers
Look for Power Buy + $ spike after a pullback → watch for quiet reversal
Accumulation colors clustering? Institutions are likely loading silently
🔹 Institutional Trap Warnings
$ spike + red distribution bar at highs = time to exit or flip
Weakness bar below VWAP? Don’t chase the long.
🛡️ Why It Matters
✅ Clean — it integrates into price action, no separate panels
✅ Silent — tracks institutions who build without alerts or indicators
✅ Tactical — no fluff, no lag, just real-time behavior recognition
This tool is ideal for:
🔸 Scalpers reading bar-by-bar
🔸 Intraday swing traders using VWAP and structure
🔸 Professionals who need volume behavior decoded in real-time
🔸 Anyone who wants signal without clutter
🙏 Final Thoughts
This tool isn’t just about trading — it’s about tactical awareness.
🔹 Dedicated to my mentor A.K., whose wisdom runs deep in every logic tree.
🔹 Above all, I give thanks to Gd, the source of clarity, courage, and conviction.
Without Him, even the sharpest system is blind.
With Him, we execute with structure, purpose, and divine alignment.
⚡ No noise. No clutter. No delay. Just raw, silent execution.
🔥 BK AK-SILENCER — Bar-Level Volume Footprint Precision 🔥
Gd bless every step you take in this market.
Trade with clarity, move with intention. 🙏

Monday's Range by Fortis80This TradingView indicator displays the Monday’s high and low range clearly across all timeframes, making it easy for traders to identify weekly key levels.
Exclusive for Fortis80 Members.

MaxEvolved Japanese CloseShow the closing price of the Japanese candle. Usefull with Heiken Ashi.
Afficher le prix de fermeture de la chandelle japonaise. Utile pour Heiken Ashi.

Turtle Strategy Pullback EntryThis strategy, titled “Turtle Strategy Pullback Entry”, is a trend-following system designed to capture breakouts more efficiently by entering after a slight pullback. Instead of buying immediately when the price breaks the 20-day high, the strategy waits for the price to pull back by 1% below that high, offering a better entry point and reducing the chances of false breakouts. Once the pullback level is reached, a long position is initiated. The trade is then managed using three exit conditions: it will close if the price drops 1.4% below the entry (acting as a stop loss), if the price rises 1.8% above the entry (taking profit), or if the price closes below the 20-day low, which serves as a trend invalidation signal. The position size is based on 100% of the equity by default, and the chart visually shows the 20-day high, low, and pullback level along with a green background when a position is active. This approach helps traders ride strong trends while avoiding premature entries, making it suitable for swing or position trading across stocks, forex, or crypto markets.

Hidden Bullish Divergence [1H]Detects hidden bullish divergence on the 1-hour timeframe using RSI. It will plot a label when conditions are met. Watch for the green label under a candle — this indicates hidden bullish divergence.

JAN - OCT [old] Engulfing Pattern Strategyold engulfing that is bad and shouldnt be used and if you do use it, then proceed at your own pearl. and i have to keep making this description longer other it wont publish which is annoying so this is just words to make the description longer so i can publish

Multi-TF S/R Lines by Pivots - 15min Chart//@version=5
indicator('Multi-TF S/R Lines by Pivots - 15min Chart', overlay=true, max_lines_count=32)
// تنظیمات کاربری
pivot_lookback = input.int(5, 'تعداد کندل دو طرف پیوت')
search_bars = input.int(200, 'تعداد کندل چکشونده در هر تایمفریم')
line_expire = input.int(40, 'حداکثر کندل بیتست تا پنهان کردن سطح')
h4_color = color.new(color.teal, 0)
h1_color = color.new(color.green, 0)
d1_color = color.new(color.blue, 0)
w1_color = color.new(color.red, 0)
plot_labels = input.bool(true, 'نمایش لیبل')
label_size = input.string('tiny', 'سایز لیبل', )
var float w1_pivothighs = array.new_float(0)
var float w1_pivotlows = array.new_float(0)
var float d1_pivothighs = array.new_float(0)
var float d1_pivotlows = array.new_float(0)
var float h4_pivothighs = array.new_float(0)
var float h4_pivotlows = array.new_float(0)
var float h1_pivothighs = array.new_float(0)
var float h1_pivotlows = array.new_float(0)
//----------------------
// تابع پیوتی (true اگر کندل مرکزی، پیوت سقف/کف باشد)
pivot(cF, length, dir) =>
// dir = 'high' یا 'low'
var bool isP = true
for i = 1 to length
if dir == 'high'
isP := isP and cF > cF and cF > cF
if dir == 'low'
isP := isP and cF < cF and cF < cF
isP
// جمعآوری پیوتها در تایمفریم انتخابی
get_pivots(tf, bars_limit, look, dir) =>
var float pivs = array.new_float(0)
pivs := array.new_float(0) // reset each call: همیشه آخرین ۲۰۰ کندل
h = request.security(tf, 'high', high)
l = request.security(tf, 'low', low)
arr = dir == 'high' ? h : l
// فقط کندلهای وسط برگردد (نه اول و آخر)
for i=look to (bars_limit - look)
if pivot(arr, look, dir)
array.unshift(pivs, arr )
pivs
// بروزرسانی آرایه پیوتها (آخرین سطوح)
if barstate.islastconfirmedhistory
w1_pivothighs := get_pivots('W', search_bars, pivot_lookback, 'high')
w1_pivotlows := get_pivots('W', search_bars, pivot_lookback, 'low')
d1_pivothighs := get_pivots('D', search_bars, pivot_lookback, 'high')
d1_pivotlows := get_pivots('D', search_bars, pivot_lookback, 'low')
h4_pivothighs := get_pivots('240', search_bars, pivot_lookback, 'high')
h4_pivotlows := get_pivots('240', search_bars, pivot_lookback, 'low')
h1_pivothighs := get_pivots('60', search_bars, pivot_lookback, 'high')
h1_pivotlows := get_pivots('60', search_bars, pivot_lookback, 'low')
//--------------
// تابع رسم سطح
draw_lines(pivArr, line_color, label_txt, expiry) =>
int count = math.min(array.size(pivArr), 8)
for i=0 to (count-1)
y = array.get(pivArr, i)
// بررسی در 40 کندل اخیر برخورد بوده یا نه؟
touched = false
for c=0 to (expiry-1)
touched := touched or (low <= y and high >= y)
if touched
l = line.new(bar_index-expiry, y, bar_index, y, color=line_color, width=2, extend=extend.right)
if plot_labels
label.new(bar_index, y, label_txt, color=line_color, style=label.style_label_right, textcolor=color.white, size=label_size)
// اگر طی پیشفرض expiry کندل برخورد نشده بود، خط و لیبل رسم نشود (مخفی شود)
// رسم همه خطوط
draw_lines(w1_pivothighs, w1_color, 'W1', line_expire)
draw_lines(w1_pivotlows, w1_color, 'W1', line_expire)
draw_lines(d1_pivothighs, d1_color, 'D1', line_expire)
draw_lines(d1_pivotlows, d1_color, 'D1', line_expire)
draw_lines(h4_pivothighs, h4_color, 'H4', line_expire)
draw_lines(h4_pivotlows, h4_color, 'H4', line_expire)
draw_lines(h1_pivothighs, h1_color, 'H1', line_expire)
draw_lines(h1_pivotlows, h1_color, 'H1', line_expire)

Enhanced Smoothed Heiken Ashi CandlesSmooth Heikin Ashi is a modified version of the traditional Heikin Ashi candlestick charting technique that applies additional smoothing to reduce noise and provide clearer trend signals.
Traditional Heikin Ashi Basics
Heikin Ashi (Japanese for "average bar") transforms regular candlesticks using these formulas:
Close = (Open + High + Low + Close) / 4
Open = (Previous HA Open + Previous HA Close) / 2
High = Maximum of (High, HA Open, HA Close)
Low = Minimum of (Low, HA Open, HA Close)
Smooth Heikin Ashi Enhancement
The smooth version applies moving averages to the Heikin Ashi values, typically using:
Simple Moving Average (SMA)
Exponential Moving Average (EMA)
Weighted Moving Average (WMA)
Common smoothing periods range from 5 to 21, with 14 being popular.
Key Benefits
Noise Reduction: Further filters out market noise compared to standard Heikin Ashi, making trends more apparent.
Clearer Signals: Produces smoother transitions between bullish and bearish phases, reducing false signals.
Trend Identification: Makes it easier to identify the dominant trend direction and potential reversals.
Trading Applications
Trend Following: Green/white candles indicate uptrends, red/black indicate downtrends
Entry/Exit Points: Color changes can signal potential trade entries or exits
Support/Resistance: Smoother price action helps identify key levels
Multiple Timeframe Analysis: Works well across different timeframes
The main tradeoff is that increased smoothing creates more lag, so signals may come later than with traditional Heikin Ashi or regular candlesticks.

EMA 50/75/120 Golden & Death Cross Strategyuy: When all EMAs are aligned in golden cross order.
Sell: When all EMAs are aligned in death cross order.
Color Coding:
Green: All EMAs rising
Red: All EMAs falling
Gray: Mixed movement

Az's EMA Scalper with Trend Confirmation (Fast TF)Az's EMA Scalper with Trend Confirmation combines fast-moving average signals with multi-timeframe trend analysis for precision intraday trading. The strategy uses a customizable moving average (7 types including EMA, HMA, ALMA) applied to Heikin-Ashi or regular candles on user-defined timeframes.
Core Mechanics:
Trend Identification:
Calculates MA values for open/close/high/low prices
Determines trend direction Bullish (green) and bearish (red)
Entry Signals:
Long entries when MA_close crosses above MA_open
Short entries when MA_close crosses below MA_open
Trade filters: LONG/SHORT/BOTH/NONE
Risk Management:
Fixed stop loss (points)
Fixed take profit (points)
Auto-position closing for directional modes
Visual Features:
Colored trend cloud (bullish/bearish)
Optional MA plots for close/high/low
Customizable colors and transparency
Optimized For:
Fast timeframes (1-15min charts)
Configurable trend confirmation (any higher timeframe)
Backtesting window control
The strategy simplifies price action into clear visual trends while maintaining flexibility through 15+ input parameters. Trades align with the dominant trend direction shown by the colored MA cloud, with exits triggered by profit targets, stop losses, or counter-trend MA crosses.

RSI Overbought ScannerRSI Overbought Scanner
Description
The RSI Overbought Scanner is a Pine Script indicator designed to identify potential overbought conditions across multiple timeframes (1-minute, 5-minute, and 15-minute) using the Relative Strength Index (RSI). This tool is ideal for traders looking to spot stocks or assets that may be overextended to the upside, potentially signaling a reversal or pullback opportunity.
Key Features
Multi-Timeframe Analysis: Evaluates RSI on 1m, 5m, and 15m timeframes to confirm overbought conditions (RSI > 70).
Visual Output: Plots a binary result (1 for overbought, 0 otherwise) for easy integration with TradingView's screener.
Debugging Table: Displays a table in the top-right corner showing RSI values and overbought status for each timeframe, with color-coded indicators (red for overbought, green for not overbought).
Alert Integration: Includes an alert condition that triggers when all three timeframes are overbought, providing a customizable message with the ticker symbol.
How It Works
RSI Calculation: Computes RSI with a default length of 14 for the 1m timeframe and retrieves RSI values for 5m and 15m timeframes using request.security.
Overbought Condition: Checks if RSI exceeds 70 on all three timeframes.
Output: Plots a value of 1 when all conditions are met, otherwise 0. A table updates on the last confirmed bar to show RSI values and overbought status.
Alerts: Triggers an alert when all timeframes are overbought, notifying users of potential trading opportunities.
Usage
Add the indicator to your chart and use it with TradingView's screener to filter assets meeting the overbought criteria.
Customize the RSI length or overbought level (default 70) in the indicator settings to suit your trading strategy.
Set up alerts to receive notifications when the overbought condition is met across all timeframes.
Notes
This script is written in Pine Script v6.
Best used in conjunction with other technical analysis tools to confirm signals.
The table is for debugging and visual confirmation, updating only on the last confirmed bar to avoid performance issues.
