Candle Height & Trend Probability DashboardDescription and Guide
Description:
This Pine Script for TradingView displays a dashboard that calculates the probability of price increases or decreases based on past price movements. It analyzes the last 30 candles (by default) and shows the probabilities for different timeframes (from 1 minute to 1 week). Additionally, it checks volatility using the ATR indicator.
Script Features:
Calculates probabilities of an upward (Up %) or downward (Down %) price move based on past candles.
Displays a dashboard showing probabilities for multiple timeframes.
Color-coded probability display:
Green if the upward probability exceeds a set threshold.
Red if the downward probability exceeds the threshold.
Yellow if neither threshold is exceeded.
Considers volatility using the ATR indicator.
Triggers alerts when probabilities exceed specific values.
How to Use:
Insert the script into TradingView: Copy and paste the script into the Pine Script editor.
Adjust parameters:
lookback: Number of past candles used for calculation (default: 30).
alertThresholdUp & alertThresholdDown: Thresholds for probabilities (default: 51%).
volatilityLength & volatilityThreshold: ATR volatility settings.
dashboardPosition: Choose where the dashboard appears on the chart.
Enable visualization: The dashboard will be displayed over the chart.
Set alerts: The script triggers notifications when probabilities exceed set thresholds.
Candlestick analysis

ICT Order Blocks v2 (Debug)Josh has a very large PP xD
Understanding Order Blocks (OBs) - The ICT Perspective
This document delves into the concept of Order Blocks (OBs) from the perspective of the ICT methodology. It outlines what OBs are, their significance in trading, and how the "ICT Order Blocks v2 (Refined)" indicator functions to identify and visualize these critical price levels. By understanding OBs, traders can better navigate market movements and make informed decisions based on institutional trading behavior.
What is an Order Block (OB)?
Within ICT methodology, an Order Block represents a specific price candle where significant buying or selling interest from institutions (Smart Money) is believed to have occurred. They are potential areas where price might return and react.
Bullish Order Block: Typically the last down-closing candle before a strong, impulsive upward move (displacement). It suggests institutions may have absorbed selling pressure and initiated long positions here.
Bearish Order Block: Typically the last up-closing candle before a strong, impulsive downward move (displacement). It suggests institutions may have distributed long positions or initiated short positions here.
Why are OBs Significant (ICT View)?
Institutional Footprint: They mark potential zones of large order execution.
Support/Resistance: Unmitigated OBs can act as sensitive price levels where reactions are expected. Bullish OBs may provide support; Bearish OBs may provide resistance.
Origin of Moves: They often mark the origin point of significant price swings.
Liquidity Engineering: Institutions might drive price back to OBs to mitigate earlier positions or to engineer liquidity before continuing a move.
Common Refinements
ICT often emphasizes higher probability OBs that are associated with:
Displacement: The move away from the OB is sharp and decisive.
Fair Value Gaps (FVGs): An FVG forming immediately after the OB strengthens its validity.
OB Mitigation: This refers to price returning to the level of the Order Block after its formation. Price might react at the edge (proximal line) or the 50% level (mean threshold) of the OB. An OB is often considered fully mitigated or invalidated if price trades decisively through its entire range, especially with a candle body closing beyond it.
How the "ICT Order Blocks v2 (Refined)" Indicator Works
This indicator automates the detection and visualization of the most recent unmitigated Order Block of each type (Bullish/Bearish), incorporating optional filters.
Detection:
It looks at the relationship between the candle two bars ago ( ), the previous candle ( ), and potentially the current candle ( ).
Bullish OB: Identifies if candle was a down-close (close < open ) AND candle broke above the high of candle (high > high ).
Bearish OB: Identifies if candle was an up-close (close > open ) AND candle broke below the low of candle (low < low ).
Accuracy Filters (Optional Inputs):
These filters help identify potentially higher-probability OBs:
Require Fair Value Gap (FVG)?: If enabled, the indicator checks if an FVG formed immediately after the OB candle ( ). Specifically, it looks for a gap between candle and candle (low > high for Bullish OB confirmation, high < low for Bearish).
Require Strong Close Breakout?: If enabled, it requires the breakout candle ( ) to close beyond the range of the OB candle ( ). (close > high for Bullish, close < low for Bearish). This suggests stronger confirmation.
Storing the Most Recent OB:
When an OB is detected and passes any enabled filters, its details (high, low, formation bar index) are stored. Crucially, this indicator only tracks the single most recent valid unmitigated OB of each type (one Bullish, one Bearish) using var variables. If a newer valid OB forms, it replaces the previously stored one.
Drawing Boxes:
If a valid Bullish OB is being tracked (and Show Bullish OBs is enabled), it draws a box (box.new) using the high and low of the identified OB candle ( ). The same process applies to Bearish OBs (Show Bearish OBs enabled). The boxes automatically extend to the right (extend.right) and their right edge is updated on each new bar (box.set_right) until they are mitigated. Labels ("Bull OB" / "Bear OB") are displayed inside the boxes.
Mitigation & Box Deletion:
The indicator checks if the current closing price (close ) has moved entirely beyond the range of the tracked OB.
Mitigation Rule Used: A Bullish OB is considered mitigated if close < bull_ob_low. A Bearish OB is considered mitigated if close > bear_ob_high. Once an OB is marked as mitigated, the indicator stops tracking it and its corresponding box is automatically deleted (box.delete) from the chart.
This indicator provides a dynamic visualization of the most recent, potentially significant Order Blocks that meet the specified criteria, helping traders identify key areas of interest based on ICT principles.

VVV AB+The VVV AB+ is an indicator that displays information on the chart based on higher time frame candles and their characteristics. The indicator performs the following functions:
Candle Analysis: The indicator calculates the direction and colors (bullish or bearish) of the selected time frame candles and draws a box around the candle body, depending on whether the closing price is higher or lower than the previous candle’s opening price.
Lines: The indicator calculates and displays the median value of the selected candles (the average of the high and low), as well as a simple moving average (SMA), providing additional technical information to the user.
This indicator can be useful for those who focus on analyzing higher time frame candles while visually displaying the candle's direction and other key information, such as the previous day's high/low.
A VVV AB+ egy olyan indikátor, amely a magasabb időkeretű gyertyák és azok jellemzői alapján jelenít meg információkat a grafikonon. Az indikátor az alábbi funkciókat valósítja meg:
Gyertya elemzés: Az indikátor kiszámítja a választható idősíkú gyertyák testének irányát és a színeket (bullish vagy bearish), majd a megfelelő színű dobozt rajzol a gyertya teste köré, attól függően, hogy a záróár magasabb vagy alacsonyabb volt, mint az előző gyertya nyitóára.
Vonalak: Az indikátor kiszámítja és megjeleníti a kiválasztott gyertyák medián értékét (a magas és alacsony átlagát), illetve egy egyszerű mozgóátlagot (SMA), hogy további technikai információkat nyújtson a felhasználónak.
Ez az indikátor hasznos lehet azok számára, akik a magasabb időkeretű gyertyák elemzésére építenek, miközben vizuálisan is megjelenítik a gyertya irányát és más kulcsfontosságú információkat, mint PL előző napi High/Low.

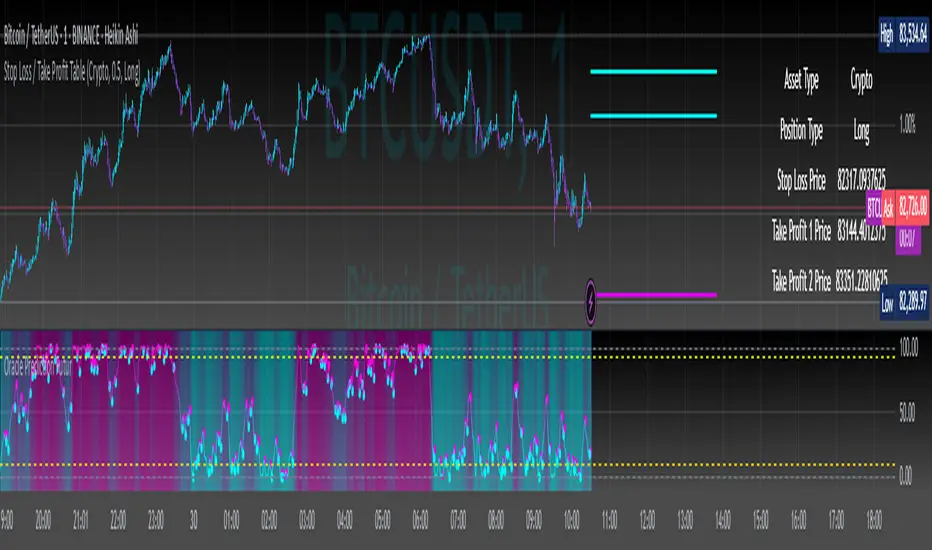
Stop Loss / Take Profit Table// (\_/)
// ( •.•)
// (")_(")
📈 Introducing the Stop Loss / Take Profit Table Indicator! 📈
Enhance your trading strategy with our powerful Stop Loss / Take Profit Table indicator, designed for traders in the Crypto, Stock, and Forex markets. This easy-to-use tool helps you manage risk and maximize profits by clearly displaying your Stop Loss and Take Profit levels based on your trading position.
Key Features:
Custom Asset Types: Choose between Crypto, Stock, or Forex to tailor the indicator to your specific trading style.
Dynamic Stop Loss & Take Profit Calculation: Set your desired Stop Loss percentage, and the indicator will automatically calculate your Stop Loss and two Take Profit levels based on different timeframes (1 min to 240 min).
Position Type Flexibility: Whether you're trading Long or Short, the indicator adjusts the calculations accordingly, providing you with precise price levels for effective risk management.
Visual Representation: Stop Loss and Take Profit levels are marked directly on the chart with distinctive horizontal lines in vibrant colors for easy reference.
Informative Table Display: A dedicated table displayed on the chart shows your asset type, position type, and calculated prices for Stop Loss and Take Profit levels, ensuring you have all critical data at a glance.
Alert Notifications: Stay informed with optional alerts that signal when your Stop Loss or Take Profit levels are hit, allowing you to react swiftly in fast-moving markets.
Why Use This Indicator?
Managing your trades is critical for success in the financial markets. With our Stop Loss / Take Profit Table, you can easily set your parameters and visually track your risk and reward levels, making it a practical addition to any trader's toolkit.
Get started today and take control of your trading strategy! ✨
Happy trading! 📊🚀
Scalping Strategy Signal v2 by [INFINITYTRADER]Overview
This Pine Script (v6) implements a scalping strategy that uses higher timeframe data (default: 4H) to generate entry and exit signals, originally designed for the 15-minute timeframe with an option for 30-minute charts. The "Scalping Strategy Signal v2 by " integrates moving averages, RSI, volume, ATR, and candlestick patterns to identify trading opportunities. It features adjustable risk management with ATR-based stop-loss, take-profit, and trailing stops, plus dynamic position sizing based on user-set capital. Trades trigger only on the higher timeframe candle close (e.g., 4H) to limit activity within the same period. This closed-source script offers a structured scalping approach, blending multiple entry methods and risk controls for adaptability across market conditions.
What Makes It Unique
Unlike typical scalping scripts relying on single-indicator triggers (e.g., RSI alone or basic MA crossovers), this strategy combines four distinct entry methods—standard MA crossovers, RSI-based momentum shifts, trend-following shorts, and candlestick pattern logic—evaluated on a 4H timeframe for confirmation. This multi-layered design, paired with re-entry logic after losses and a mix of manual, ATR-based, and trailing exits, aims to balance trade frequency and reliability. The higher timeframe filter adds precision not commonly found in simpler scalping tools, while the 30-minute option enhances consistency by reducing noise.
How It Works
Timeframe Logic
Runs on a base timeframe (designed for 15-minute charts, with a 30-minute option) while pulling data from a user-chosen higher timeframe (default: 4H) for signal accuracy.
Limits entries to the close of each 4H candle, ensuring one trade per period to avoid over-trading in volatile conditions.
Indicators and Data
Moving Averages : Employs 21-period and 50-period simple moving averages on the higher timeframe to detect trends and signal entries/exits.
Volume : Requires volume to exceed 70% of its 20-period average on the higher timeframe for momentum confirmation.
RSI : Uses a 14-period RSI for overbought/oversold filtering and a 6-period RSI for precise entry timing.
ATR : Applies a 14-period Average True Range on the higher timeframe to set adaptive stop-loss and take-profit levels.
Candlestick Patterns : Analyzes consecutive green or red 4H bars for trend continuation signals.
Why These Indicators
The blend of moving averages, RSI, volume, ATR, and candlestick patterns forms a robust scalping framework. Moving averages establish trend context, RSI filters momentum and avoids extremes, volume confirms market activity, ATR adjusts risk to volatility, and candlestick patterns enhance entry timing with price action insights. Together, they target small, frequent moves in flat or trending markets, with the 4H filter reducing false signals common in lower-timeframe scalping.
Entry Conditions
Four entry methods are evaluated at the 4H candle close:
Standard Long Entry: Price crosses above the 21-period moving average, volume exceeds 70% of its 20-period average, and the 1H 14-period RSI is below 70—confirms uptrend momentum.
Special Long Entry: The 6-period RSI crosses above 23, price is more than 1.5 times the ATR from the 21-period moving average, and price exceeds its prior close—targets oversold bounces with a stop-loss at the 4H candle’s low.
Short Entries:
- RSI-Based: The 6-period RSI crosses below 68 with volume support—catches overbought pullbacks.
- Trend-Based: Price crosses below the 21-period moving average, volume is above 70% of its average, and the 1H 14-period RSI is above 30—confirms downtrends.
Red/Green Bar Logic: Two consecutive green 4H bars for longs or red 4H bars for shorts—uses candlestick patterns for continuation, with a tight stop-loss from the base timeframe candle.
Re-Entry Logic
Long : After a losing special long, triggers when the 6-period RSI crosses 27 and price crosses the 21-period moving average.
Short : After a losing short, triggers when the 6-period RSI crosses 50 and price crosses below the 21-period moving average.
Purpose: Offers recovery opportunities with stricter conditions.
Exit Conditions
Manual Exits: Longs close if the 21-period MA crosses below the 50-period MA or the 1H 14-period RSI exceeds 68; shorts close if the 21-period MA crosses above the 50-period MA or RSI drops below 25.
ATR-Based TP/SL: Stop-loss is entry price ± ATR × 1.5 (default); take-profit is ± ATR × 4 (default), checked at 4H close.
Trailing Stop: Adjusts ±6x ATR from peak/trough, closing if price retraces within 1x ATR.
Special/Tight SL: Special longs exit if price opens below the 4H candle’s low; 4th method entries use the base timeframe candle’s low/high, checked every bar.
Position Sizing
Bases trade value on user-set capital (default: 100 USDT), dividing by the higher timeframe close price for dynamic sizing.
Visualization
Displays a table at the bottom-right with current/previous signals, TP/SL levels, equity, trading pair, and trade size—color-coded for clarity (green for buy, red for sell).
Inputs
Initial Capital (USDT): Sets trade value (default: 100, min: 1).
ATR Stop-Loss Multiplier: Adjusts SL distance (default: 1.5, min: 1).
ATR Take-Profit Multiplier: Adjusts TP distance (default: 4, min: 1).
Higher Timeframe: Selects analysis timeframe (options: 1m, 5m, 15m, 30m, 1H, 4H, D, W; default: 4H).
Usage Notes
Intended Timeframe: Designed for 15-minute charts with 4H confirmation for precision and frequency; 30-minute charts improve consistency by reducing noise.
Backtesting: Adjust ATR multipliers and capital to match your asset’s volatility and risk tolerance.
Risk Management: Combines manual, ATR, and trailing exits—monitor to avoid overexposure.
Limitations: 4H candle-close dependency may delay entries in fast markets; RSI/volume filters can reduce trades in low-momentum periods.
Backtest Observations
Tested on BTC/USDT (4H higher timeframe, default settings: Initial Capital: 100 USDT, ATR SL: 1.5x, ATR TP: 4x) across market conditions, comparing 15-minute and 30-minute charts:
Bull Market (Jul 2023 - Dec 2023):
15-Minute: 277 long, 219 short; Win Rate: 42.74%; P&L: 108%; Drawdown: 1.99%; Profit Factor: 3.074.
30-Minute: 257 long, 215 short; Win Rate: 49.58%; P&L: 116.85%; Drawdown: 2.34%; Profit Factor: 3.14.
Notes: Moving average crossovers and green bar patterns suited this bullish phase; 30-minute improved win rate and P&L by filtering weaker signals.
Bear Market (Jan 2022 - Jun 2022):
15-Minute: 262 long, 211 short; Win Rate: 44.4%; P&L: 239.80%; Drawdown: 3.74%; Profit Factor: 3.419.
30-Minute: 250 long, 200 short; Win Rate: 52.22%; P&L: 258.77%; Drawdown: 5.34%; Profit Factor: 3.461.
Notes: Red bar patterns and RSI shorts thrived in the downtrend; 30-minute cut choppy reversals for better consistency.
Flat Market (Jan 2021 - Jun 2021):
15-Minute: 280 long, 208 short; Win Rate: 51.84%; P&L: 340.33%; Drawdown: 9.59%; Profit Factor: 2.924.
30-Minute: 270 long, 209 short; Win Rate: 55.11%; P&L: 315.42%; Drawdown: 7.21%; Profit Factor: 2.598.
Notes: High trade frequency and P&L showed strength in ranges; 30-minute lowered drawdown for better risk control.
Results reflect historical performance on BTC/USDT with default settings—users should test on their assets and timeframes. Past performance does not guarantee future results and is shared only to illustrate the strategy’s behavior.
Why It Works Well in Flat Markets
A "flat market" lacks strong directional trends, with price oscillating around moving averages, as in Jan 2021 - Jun 2021 for BTC/USDT. This strategy excels here because its crossover-based entries trigger frequently in tight ranges. In trending markets, an exit might not be followed by a new entry without a pullback, but flat markets produce multiple crossovers, enabling more trades. ATR-based TP/SL and trailing stops capture these small swings, while RSI and volume filters ensure momentum, driving high P&L and win rates.
Technical Details
Built in Pine Script v6 for TradingView compatibility.
Prevents overlapping trades with long/short checks.
Handles edge cases like zero division and auto-detects the trading pair’s base currency (e.g., BTC from BTCUSDT).
This strategy suits scalpers seeking structured entries and risk management. Test on 15-minute or 30-minute charts to match your style and market conditions.

ICT FVG & Swing Detector Basic by Trader RiazICT FVG & Swing Detector Basic by Trader Riaz
Unlock Precision Trading with the Ultimate Fair Value Gap (FVG) and Swing Detection Tool!
Developed by Trader Riaz , the ICT FVG and Swing Detector Basic is a powerful Pine Script indicator designed to help traders identify key market structures with ease. Whether you're a day trader, swing trader, or scalper, this indicator provides actionable insights by detecting Bullish and Bearish Fair Value Gaps (FVGs) and Swing Highs/Lows on any timeframe. Perfect for trading forex, stocks, crypto, and more on TradingView!
Key Features:
1: Bullish and Bearish FVG Detection
- Automatically identifies Bullish FVGs (highlighted in green) and Bearish FVGs (highlighted in red) to spot potential reversal or continuation zones.
- Displays FVGs as shaded boxes with a dashed midline at 70% opacity, making it easy to see the midpoint of the gap for precise entries and exits.
- Labels are placed inside the FVG boxes at the extreme right for clear visibility.
2: Customizable FVG Display
- Control the number of Bullish and Bearish FVGs displayed on the chart with user-defined inputs (fvg_bull_count and fvg_bear_count).
- Toggle the visibility of Bullish and Bearish FVGs with simple checkboxes (show_bull_fvg and show_bear_fvg) to declutter your chart.
3: Swing High and Swing Low Detection
- Detects Swing Highs (blue lines) and Swing Lows (red lines) to identify key market turning points.
- Labels are positioned at the extreme right edge of the lines for better readability and alignment.
- Customize the number of Swing Highs and Lows displayed (swing_high_count and swing_low_count) to focus on the most recent market structures.
4: Fully Customizable Display
- Toggle visibility for Swing Highs and Lows (show_swing_high and show_swing_low) to suit your trading style.
- Adjust the colors of Swing High and Low lines (swing_high_color and swing_low_color) to match your chart preferences.
5: Clean and Efficient Design
- Built with Pine Script v6 for optimal performance on TradingView.
- Automatically removes older FVGs and Swing points when the user-defined count is exceeded, keeping your chart clean and focused.
- Labels are strategically placed to avoid clutter while providing clear information.
Why Use This Indicator?
Precision Trading: Identify high-probability setups with FVGs and Swing points, commonly used in Smart Money Concepts (SMC) and Institutional Trading strategies.
User-Friendly: Easy-to-use inputs allow traders of all levels to customize the indicator to their needs.
Versatile: Works on any market (Forex, Stocks, Crypto, Commodities) and timeframe (1M, 5M, 1H, 4H, Daily, etc.).
Developed by Trader Riaz: Backed by the expertise of Trader Riaz, a seasoned trader dedicated to creating tools that empower the TradingView community.
How to Use:
- Add the Custom FVG and Swing Detector to your chart on TradingView.
- Adjust the input settings to control the number of FVGs and Swing points displayed.
- Toggle visibility for Bullish/Bearish FVGs and Swing Highs/Lows as needed.
- Use the identified FVGs and Swing points to plan your trades, set stop-losses, and target key levels.
Ideal For:
- Traders using Smart Money Concepts (SMC), Price Action, or Market Structure strategies.
- Those looking to identify liquidity grabs, imbalances, and trend reversals.
- Beginners and advanced traders seeking a reliable tool to enhance their technical analysis.
Happy trading!

malama's volume spikeThe "malama's volume spike" indicator identifies and highlights bars where the trading volume significantly exceeds the average, signaling potential market interest or activity. It calculates a Simple Moving Average (SMA) of the volume over a user-defined period and compares the current volume against this average multiplied by a specified threshold factor. Bars where the volume surpasses this threshold are colored yellow on the chart, providing a visual cue for traders to identify potential trading opportunities.
How It Works:
Volume Moving Average (SMA): The indicator computes the SMA of the volume over a period defined by the user (default is 20 bars).
Threshold Calculation: It multiplies the SMA by a user-defined factor (default is 2.0) to set the volume spike threshold.
Volume Spike Detection: If the current volume exceeds this threshold, the corresponding bar is highlighted in yellow.
Usage:
Volume MA Length: Adjust this parameter to set the period over which the volume SMA is calculated. A shorter length responds more quickly to recent volume changes, while a longer length smooths out short-term fluctuations.
Volume Threshold Factor: Modify this factor to set the sensitivity of the volume spike detection. A lower value will highlight more bars, while a higher value will highlight fewer, more significant spikes.

PowerZone Trading StrategyExplanation of the PowerZone Trading Strategy for Your Users
The PowerZone Trading Strategy is an automated trading strategy that detects strong price movements (called "PowerZones") and generates signals to enter a long (buy) or short (sell) position, complete with predefined take profit and stop loss levels. Here’s how it works, step by step:
1. What is a PowerZone?
A "PowerZone" (PZ) is a zone on the chart where the price has shown a significant and consistent movement over a specific number of candles (bars). There are two types:
Bullish PowerZone (Bullish PZ): Occurs when the price rises consistently over several candles after an initial bearish candle.
Bearish PowerZone (Bearish PZ): Occurs when the price falls consistently over several candles after an initial bullish candle.
The code analyzes:
A set number of candles (e.g., 5, adjustable via "Periods").
A minimum percentage move (adjustable via "Min % Move for PowerZone") to qualify as a strong zone.
Whether to use the full candle range (highs and lows) or just open/close prices (toggle with "Use Full Range ").
2. How Does It Detect PowerZones?
Bullish PowerZone:
Looks for an initial bearish candle (close below open).
Checks that the next candles (e.g., 5) are all bullish (close above open).
Ensures the total price movement exceeds the minimum percentage set.
Defines a range: from the high (or open) to the low of the initial candle.
Bearish PowerZone:
Looks for an initial bullish candle (close above open).
Checks that the next candles are all bearish (close below open).
Ensures the total price movement exceeds the minimum percentage.
Defines a range: from the high to the low (or close) of the initial candle.
These zones are drawn on the chart with lines: green or white for bullish, red or blue for bearish, depending on the color scheme ("DARK" or "BRIGHT").
3. When Does It Enter a Trade?
The strategy waits for a breakout from the PowerZone range to enter a trade:
Buy (Long): When the price breaks above the high of a Bullish PowerZone.
Sell (Short): When the price breaks below the low of a Bearish PowerZone.
The position size is set to 100% of available equity (adjustable in the code).
4. Take Profit and Stop Loss
Take Profit (TP): Calculated as a multiple (adjustable via "Take Profit Factor," default 1.5) of the PowerZone height. For example:
For a buy, TP = Entry price + (PZ height × 1.5).
For a sell, TP = Entry price - (PZ height × 1.5).
Stop Loss (SL): Calculated as a multiple (adjustable via "Stop Loss Factor," default 1.0) of the PZ height, placed below the range for buys or above for sells.
5. Visualization on the Chart
PowerZones are displayed with lines on the chart (you can hide them with "Show Bullish Channel" or "Show Bearish Channel").
An optional info panel ("Show Info Panel") displays key levels: PZ high and low, TP, and SL.
You can also enable brief documentation on the chart ("Show Documentation") explaining the basic rules.
6. Alerts
The code generates automatic alerts in TradingView:
For a bullish breakout: "Bullish PowerZone Breakout - LONG!"
For a bearish breakdown: "Bearish PowerZone Breakdown - SHORT!"
7. Customization
You can tweak:
The number of candles to detect a PZ ("Periods").
The minimum percentage move ("Min % Move").
Whether to use highs/lows or just open/close ("Use Full Range").
The TP and SL factors.
The color scheme and what elements to display on the chart.
Practical Example
Imagine you set "Periods = 5" and "Min % Move = 2%":
An initial bearish candle appears, followed by 5 consecutive bullish candles.
The total move exceeds 2%.
A Bullish PowerZone is drawn with a high and low.
If the price breaks above the high, you enter a long position with a TP 1.5 times the PZ height and an SL equal to the height below.
The system executes the trade and exits automatically at TP or SL.
Conclusion
This strategy is great for capturing strong price movements after consolidation or momentum zones. It’s automated, visual, and customizable, making it useful for both beginner and advanced traders. Try it out and adjust it to fit your trading style!

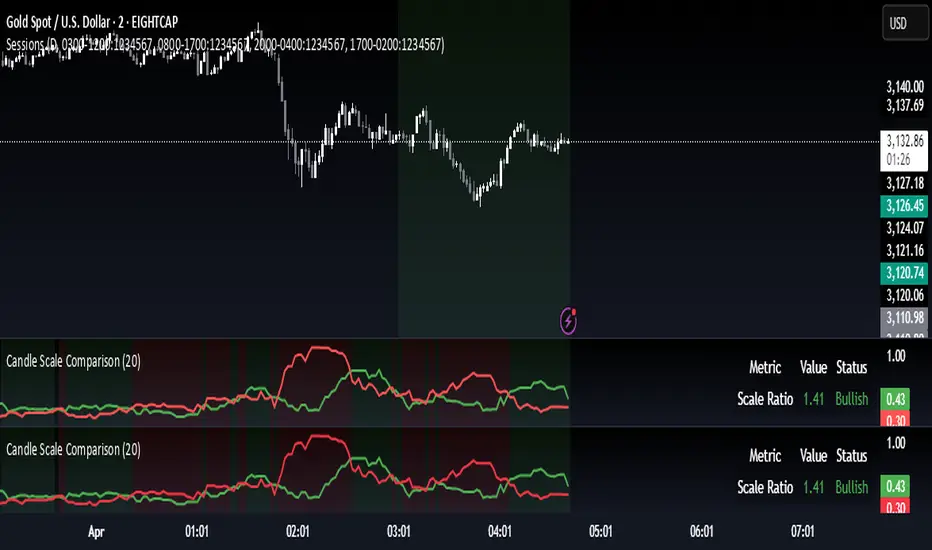
Candle Scale ComparisonCompares the scale of bullish and bearish candles and shows which side is currently dominant. Works in any symbol.
1. Input Parameters:
- LookbackPeriod: Allows you to set how many bars to look back for calculating averages (default: 20)
- showLabels: Toggle to show/hide dominance labels on the chart
2. Calculations:
- Calculates the scale of bullish candles (close - open)
Calculates the scale of bearish candles (open - close)
- Computes moving averages for both scales using the specified lookback period
- Determines which type of candles are dominating based on the averages
3. Visual Elements:
- Plots two lines showing the average scales:
- Green line for bullish candle scales
- Red line for bearish candle scales
- Adds a background color that changes based on dominance:
- Light green when bullish candles dominate
- Light red when bearish candles dominate
- Shows labels above the chart indicating current dominance
- Displays a table in the top-right corner showing:
- The current scale ratio (bullish/bearish)
- The current dominance status
4. Features:
- The indicator is plotted in a separate pane below the main chart
- Uses color coding for easy visual interpretation
- Provides both visual and numerical representation of the dominance
- Updates in real-time as new candles form
TriplePower55%🔴 Bearish Candle (Losing Candle)
🔹 Definition:
A candle that closes below the opening price.
Important condition: the body of the candle must be ≥ 55% of the entire candle's range.
It is automatically colored red on the platform.
🔹 Significance:
Used to identify resistance levels or initiate the Triple Power analysis.
The last valid bearish candle (with a body and that broke a bullish candle) is selected to draw Fibonacci levels.
🔹 How it's handled:
When the price closes above the high of the bearish candle, an upward wave begins.
The indicator draws a blue line at its high and a red line at its low, with the timeframe labeled (e.g., TF: M).
🟢 Bullish Candle (Winning Candle)
🔹 Definition:
A candle that closes above the opening price.
Its body must be ≥ 55% of the total candle's range.
It is automatically colored green on the platform.
🔹 Significance:
Used to identify support levels, or as a reference in extensions or pauses.
The last closed bullish candle is used to draw extension targets if there’s no valid bearish candle.
🔹 How it's handled:
If the price closes below the low of the monthly bullish candle, it signals the start of a strong downward trend.
If the low is not broken, the movement is considered a temporary pause.
The stop level is placed at the low of the last closed bullish candle.

Engulfing 3x PatternDescription:
The "Engulfing 3x Pattern" indicator identifies bullish and bearish engulfing candlestick patterns where the engulfing candle's body is at least three times larger than the body of the previous candle. This highlights significant momentum shifts in the market, focusing solely on body size (open to close), ignoring wicks.
Bullish Engulfing: A bearish candle (close below open) is followed by a larger bullish candle (close above open) that fully engulfs the prior candle’s body and has a body at least 3x larger. Marked with a green triangle below the bar.
Bearish Engulfing: A bullish candle (close above open) is followed by a larger bearish candle (close below open) that engulfs the prior candle’s body and has a body at least 3x larger. Marked with a red triangle above the bar.
How It Works:
This indicator scans for engulfing patterns and applies a size filter to ensure the engulfing candle demonstrates strong conviction. It’s useful for traders looking for potential reversals or continuation signals backed by significant price movement. The 3x multiplier can be adjusted in the code (e.g., to 2x or 5x) for customization.
Usage Tips:
Best used with confirmation from support/resistance levels, trends, or other indicators.
More reliable on higher timeframes (e.g., daily, 4-hour).
Signals are purely price-based; consider volume or momentum indicators for additional context.

Time Compression ZonesTime Compression Zones is an experimental indicator based on the idea that markets often "go silent" before making a strong move. During these moments, volatility drops, price action slows down, and energy accumulates beneath the surface — often followed by an explosive breakout.
The indicator identifies "time compression zones" — periods where the current volatility drops below a specific threshold relative to its moving average. These areas are highlighted on the chart and may serve as early signals of upcoming market expansion.
Time Compression Zones — это экспериментальный индикатор, основанный на идее, что рынок перед сильным движением часто "замирает". В такие моменты волатильность падает, движение становится вялым, но внутри копится энергия, которая вскоре может "взорваться" в виде импульса вверх или вниз.
This is not a directional indicator — it highlights pre-breakout conditions
Best used on 1H to 4H timeframes
Ideal for cryptocurrencies, gold, and futures
//RU
Индикатор определяет зоны "временного сжатия" — участки, где текущая волатильность падает ниже определённого порога относительно своей средней величины. Эти участки визуально выделяются на графике и могут указывать на приближающийся выход из "зоны накопления".
Индикатор не даёт направленного сигнала — он показывает периоды ожидания.
Лучше всего работает на 1H–4H таймфреймах
Подходит для криптовалют, фьючерсов, золота

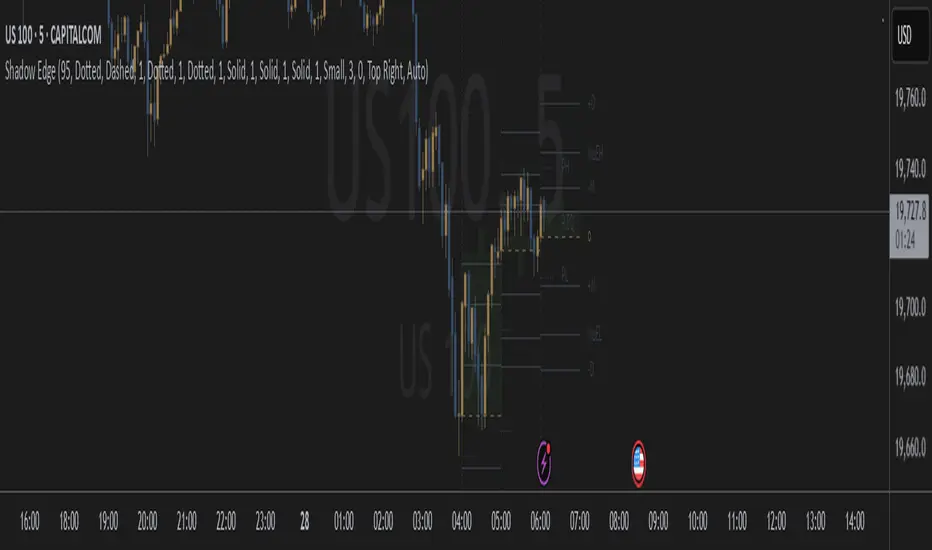
Shadow EdgeShadow Edge Indicator
Overview
Shadow Edge is an advanced technical analysis tool that visualizes key price levels and statistical patterns based on multiple timeframe analysis. It helps traders identify potential support, resistance, and expansion zones by tracking historical price behavior at specific hours of the trading day.
This indicator offers unique statistical insights by calculating average expansion levels and tracking market behavior patterns on an hourly basis. Unlike standard technical indicators, Shadow Edge combines historical price analysis with proprietary statistical calculations to identify high-probability zones for market reactions.
Key Features
• Previous High/Low Visualization : Displays previous session high and low levels with configurable line styles
• Mean Expansion Levels : Calculates and displays average price expansion levels (MuEH/MuEL) based on historical data
• Manipulation/Distribution Levels : Shows potential manipulation and distribution zones calculated from price action patterns
• Sweep Detection : Alerts when price sweeps previous high or low levels with customizable offset
• Multi-timeframe Analysis : Analyzes higher timeframe data and projects it onto your current chart
• Statistical Tracking : Maintains a database of price behavior by hour to identify recurring patterns
• Fully Customizable Visuals : Adjust colors, line styles, and transparency to match your chart setup
Settings
• Customize appearance of all elements including candles, lines, and labels
• Toggle visibility of different price levels
• Set alert conditions for level tests and sweeps
• Configure historical bar lookback period
• Optional stats display showing reliability percentages by hour
Use Cases
• Identify potential reversal zones at previous highs/lows
• Anticipate likely price expansion based on statistical averages
• Recognize manipulation and distribution patterns in price action
• Set precise alerts for sweep events at key levels
• Enhance your trading strategy with multi-timeframe analysis
How to Use It
1. Initial Setup : Apply the indicator to your chart and configure the higher timeframe setting (default is 60 min) to match your trading style.
2. Level Identification :
• Previous High (PH) and Previous Low (PL) levels show where price previously found support/resistance
• Mean Expansion High (MuEH) and Low (MuEL) levels indicate statistically likely price boundaries
• The Previous EQ level represents the equilibrium point between previous high and low
3. Trading Strategy Applications :
• Look for price reactions when testing previous high/low levels
• Use expansion levels (MuEH/MuEL) as potential take-profit targets
• Monitor manipulation (-M, +M) and distribution (-D, +D) levels for potential reversal zones
• Set alerts for sweeps of previous high/low levels to identify potential stop hunts
4. Statistical Analysis :
• The optional stats table shows reliability percentages for different hours
• Higher percentages indicate historically stronger adherence to the projected levels
• Use this data to adjust your trade timing and risk management
5. Visual Customization :
• Adjust colors and line styles to create a clean, easy-to-read chart
• Toggle different elements on/off based on your specific trading approach
• Reduce transparency settings if you prefer a more subtle visual overlay
Important Notes
• This indicator uses statistical calculations to identify price levels; past performance does not guarantee future results
• For best results, use on liquid markets during their primary trading sessions
• While the indicator provides statistical projections, always combine these signals with your own analysis and risk management strategy
• The code containing the proprietary algorithms is protected as closed source to maintain its integrity
Limitations
• The indicator requires sufficient historical data to calculate accurate statistical levels
• Performance may vary depending on market volatility and trading conditions
• Level projections work best on standard chart types (not Heikin Ashi, Renko, etc.)
• Sweep detections should be confirmed with price action before taking action
Note : Contact me for a version of this indicator that can work on any Higher Timeframe.
FVG ST/RE Detector(v1.0.73)FVG ST/RE Detector
The FVG ST/RE Detector is a powerful technical analysis tool designed to identify market structure and potential trading opportunities through Fair Value Gaps (FVG), Structure Transitions (ST), and Re-entries (RE).
What This Indicator Does:
This indicator identifies and displays:
Fair Value Gaps (FVG): Areas where price has moved so quickly that it has left an imbalance in the market. These gaps represent potential areas where price may return to in the future.
Structure Transitions (ST): Points where the market structure changes from bearish to bullish or vice versa, signaling a potential trend change.
Re-entries (RE): Opportunities to enter the market in the direction of the prevailing trend after a pullback.
Leg Lines: Horizontal lines representing key structural movements in the market, helping traders visualize the market structure more easily.
How It Works:
The indicator detects FVGs when price moves rapidly, creating gaps in market value.
ST points are identified when the direction of FVGs changes from bearish to bullish or vice versa.
RE points are identified when a new FVG forms in the same direction after a pullback.
The indicator tracks and displays the number of consecutive leg lines in the current trend direction.
Key Features:
Customizable colors for bullish and bearish patterns
Optional display of ST and RE labels
Adjustable leg lines with multiple style options
Statistics panel showing the number of legs in the current direction
Alert system for new leg formations
Mitigation tracking to identify when FVGs have been filled
How to Use This Indicator:
Look for ST points to identify potential trend changes
Use RE points to find potential entries in the direction of the prevailing trend
Monitor the number of legs to gauge trend strength
Use FVGs as potential support and resistance areas
Set alerts to be notified of new leg formations
This indicator is suitable for all timeframes and markets, and can be used as part of a comprehensive trading strategy.
本指标的功能:
该指标识别并显示:
公平价值缺口 (FVG):价格快速移动以至于在市场中留下不平衡区域的区间。这些缺口代表价格未来可能回归的潜在区域。
结构转换 (ST):市场结构从看跌转变为看涨或相反的点位,预示潜在的趋势变化。
重新进入 (RE):在回调后沿着主导趋势方向进入市场的机会。
趋势腿线:代表市场中关键结构移动的水平线,帮助交易者更容易地可视化市场结构。

Shaved Candle IdentifierThis script is different because it actually highlights the candle and is not just an icon. It will identify bars that have no wick. Each color represents a different type of candle.
Shaved candles represent major liquidity zones, and tend to get swept in the future.
Shaved candles are useful for spotting reversals and as price targets.
Green is when open = low
Red is when open = high
Blue is when close = high
Orange is when close = low
There is 0 tolerance for any deviation, if the price is 0.001 off, it will not be identified. Only absolutely shaved candles will be identified.

The Alchemist's Codex | Divergences of Multi Length RSI This Pine Script 5 indicator, titled "The Alchemist's Codex - Project La Grande Finale | Slope Loop Based Divergences of Multi Length RSI," is designed to identify potential bullish and bearish divergences between price and a custom-calculated Relative Strength Index (RSI). It aims to provide traders with signals based on the momentum and rate of change of price and RSI.
Here's a breakdown of its functionality:
1. Custom RSI Calculation:
The script begins by calculating a unique RSI variant. It iterates through various lookback periods (from 1 to a user-defined maximum), computing the RSI for each.
It incorporates a dual weighting mechanism, considering both the rate of change and the time elapsed since significant RSI changes. This aims to provide a more nuanced representation of momentum.
The script calculates averages incorporating both slope and time factors.
The calculated RSI values are then again averaged over the defined lookback range to produce a final, smoothed RSI output.
2. Slope Calculation and Divergence Detection:
The script calculates the average slopes of both the price and the custom RSI over a range of lengths (from a minimum to a maximum defined by the user).
It ranks calculations to determine the relative strength of the price and RSI slopes.
It then identifies potential bullish and bearish divergences by comparing the percent ranks of the price and RSI slopes, along with comparing the current price and RSI values to previous values over a short and long lookback.
Bullish divergences occur when the price makes lower lows while the RSI makes higher lows, and when the price slope is very low, and the RSI slope is very high. Additionally it checks that the current price slope is higher than the previous price slope.
Bearish divergences occur when the price makes higher highs while the RSI makes lower highs, and when the price slope is very high, and the RSI slope is very low. Additionally it checks that the current price slope is lower than the previous price slope.
3. Visualizations:
The script plots labels on the chart to indicate bullish and bearish divergences.
It also plots the average price and RSI slopes, allowing traders to visually assess the momentum and direction of both.
Key Input Parameters:
length: Base RSI length.
rsiThreshold: Defines a meaningful change in RSI.
price_source: Source of price data.
minLength, maxLength: Range of lengths for slope calculations.
Low_Percentage_rank, High_Percentage_rank: Percent rank thresholds for divergence detection.
x, z: lookback periods for the bullish and bearish divergence conditions.
mult: A multiplier.
In essence, this indicator combines a custom RSI calculation with slope analysis and percent rank evaluation to identify potential divergences, providing traders with signals based on momentum and relative strength.
