Japanese Candlestick PatternsCandlestick Pattern Detector – Your Smart Market Insight Tool
Unlock the hidden language of price action with the Candlestick Pattern Detector, an advanced TradingView indicator meticulously crafted to identify powerful candlestick formations in real time. Whether you are a day trader seeking sharp reversals, a swing trader scouting for trend continuations, or an investor who values precise entry signals, this indicator is your indispensable trading companion.
The Candlestick Pattern Detector continuously scans every bar on your chart and highlights over 30 classic and advanced candlestick patterns, including dojis, engulfing candles, hammers, shooting stars, morning stars, evening stars, haramis, and more. Each detected pattern is labeled directly on the chart, providing crystal-clear visual signals without clutter. Customizable settings allow you to choose which patterns to monitor, fine-tune sensitivity, and adjust label colors and styles to match your personal trading aesthetic.
Beyond merely spotting patterns, this indicator empowers traders to understand the psychological forces driving the market. Bullish and bearish signals help you gauge potential trend reversals, momentum shifts, or periods of consolidation. By integrating these time-tested price action signals into your strategy, you gain a powerful edge in anticipating market moves before they unfold.
Key Features:
Detects 30+ popular candlestick patterns in real time
Clear on-chart labels and color-coded signals
Customizable alerts for immediate trading opportunities
Adjustable sensitivity for noise reduction
Perfect for intraday, swing, or long-term trading
Elevate your trading precision and confidence with the Candlestick Pattern Detector. Let the market’s story reveal itself, candle by candle.
Candlestick analysis


PC UpdatedThis indicator identifies a high-probability breakout setup using a simple but powerful 3-candle formation. It works on lower timeframes (like 5m) and is ideal for scalping or short-term intraday setups.

QMC + QM + AO Divergence Strategy | 1:3 RR | H4-H1📊 QMC + QM Signal Alert
📍 Pair: {{ticker}}
🕐 Timeframe: {{interval}}
📈 Direction: {{strategy.order.action}}
🎯 Strategy: QMC + QM + AO Divergence | 1:3 RR
⚠️ Note: AO divergence and QM pattern confirmed. A potential trade setup is detected!
📩 Join the signal group for real-time updates:
👉 t.me/ErgunFX_SignalGroup


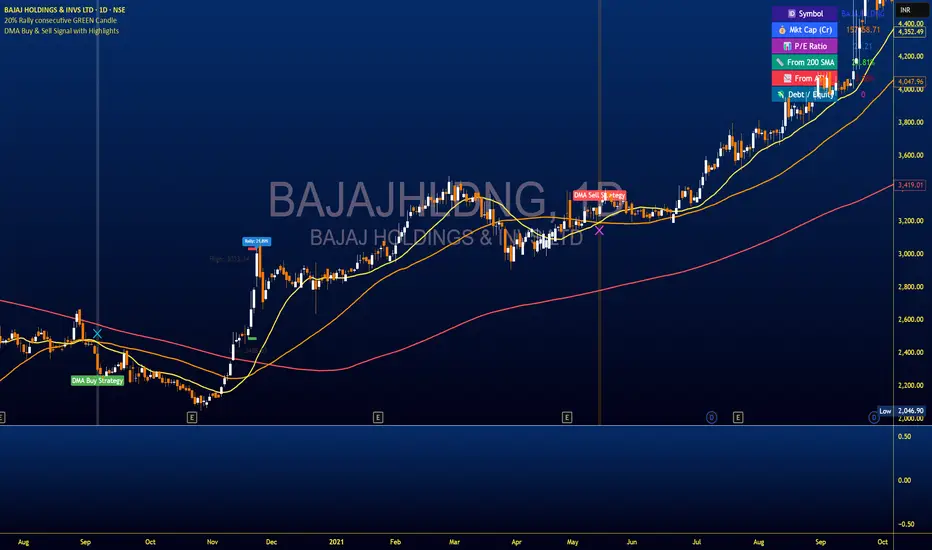
DMA Buy & Sell Signal with AlertsThis script identifies **BUY** signals when the 20 DMA crosses **below** the 50 DMA, with the alignment: `200 DMA > 50 DMA > 20 DMA > Price`.
It also plots **SELL** signals when the 20 DMA crosses **above** the 50 DMA, with the alignment: `Price > 20 DMA > 50 DMA > 200 DMA`.
Each signal is plotted on the chart with green "BUY" and red "SELL" labels.
The script includes alert conditions for both signals.
It uses simple moving averages (SMA) of 20, 50, and 200 periods.
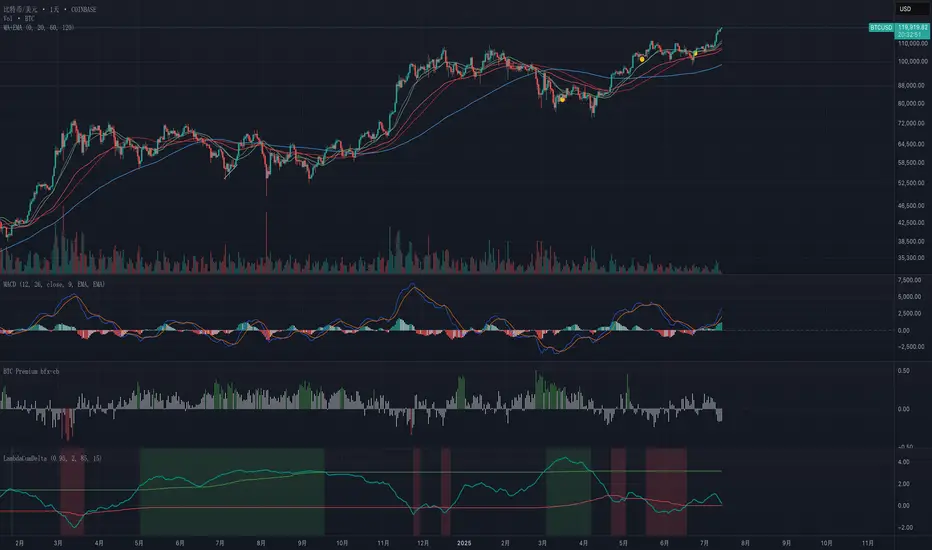
Exponential-Decay Cumulative Spread (Cycle-Tuned)## Indicator Overview
**Exponential-Decay Cumulative Spread (Cycle-Tuned)** – short title **LambdaCumDelta** – tracks the percentage spread between CEXs BTC spot prices.
By clipping outliers, applying an exponential-decay running sum, and comparing that sum to rolling percentile bands, the script flags potential **cycle bottoms** and **cycle tops** whenever the cumulative spread stays beyond extreme thresholds for three consecutive bars.
---
### Core Logic
1. **Price Spread**
`spread_pct = (cexA – cexB) / cexB × 100`.
2. **Outlier Suppression**
* Calculates the **90-day standard deviation σ** of `spread_pct`.
* Uses a **clip coefficient `k_clip`** (0.5–5.0) to cap the spread at `±k_clip × σ`, damping single-day anomalies.
3. **Exponential-Decay Sum**
* Applies a decay factor **λ** (0.50–0.999):
```
CumΔₜ = spread_clipₜ + λ × CumΔₜ₋₁
```
* Larger λ → longer memory half-life.
4. **Rolling Percentile Bands**
* Uses a **365-bar window** to derive dynamic percentile thresholds.
* Upper / Lower bands are set by **perc\_hi** and **perc\_lo** (e.g., 85 % and 15 %).
5. **Signal Definition**
* **Bullish** (cycle bottom): `CumΔ` above the upper band for **3 straight bars**.
* **Bearish** (cycle top): `CumΔ` below the lower band for **3 straight bars**.
---
### Chart Elements
| Plot | Style | Meaning |
| --------------- | ----------------- | ----------------------------------- |
| **CumΔ** | Teal thick line | Exponential-decay cumulative spread |
| Upper Threshold | Green thin line | Rolling upper percentile |
| Lower Threshold | Red thin line | Rolling lower percentile |
| Background | Faded green / red | Bullish / bearish signal zone |
---
### Key Inputs
| Input | Default | Purpose |
| -------------------- | ------- | ------------------------------- |
| **Decay factor λ** | 0.95 | Memory length of CumΔ |
| **Clip coefficient** | 2.0 | Multiple of σ for outlier cap |
| **Upper percentile** | 85 | Cycle-bottom trigger percentile |
| **Lower percentile** | 15 | Cycle-top trigger percentile |
---
### Practical Tips
1. **Timing bias**
* Green background often precedes mean-reversion of the spread – consider scaling into longs or covering shorts.
* Red background suggests stretched positive spread – consider trimming longs or lightening exposure.
2. **Combine with volume, trend filters (MA, MACD, etc.)** to weed out false extremes.
3. Designed for **daily charts**; ensure both exchange feeds are synchronized.
---
### Alerts
Two built-in `alertcondition`s fire when bullish or bearish criteria are met, enabling push / email / webhook notifications.
---
### Disclaimer
This script is for educational and research purposes only and is **not** financial advice. Test thoroughly and trade at your own risk.
GOLD Auto-Alert Strategy [Enhanced+Signals+UT Bot]New Version The Indicator
✅ BUY Signal Triggers Only If:
UT Buy signal flips (from down to up)
ADX > Threshold → market has strength
RSI is outside the 40–60 range
Volume is spiking above 20-bar average × 1.2
EMA Fast > EMA Slow → uptrend confirmed
Close > EMA Fast → price above short-term trend
Bullish Engulfing candle
🔻 SELL Signal Triggers Only If:
UT Sell signal flips (from up to down)
ADX > Threshold → market has strength
RSI is outside the 40–60 range
Volume is spiking above average
EMA Fast < EMA Slow → downtrend confirmed
Close < EMA Fast → bearish structure
Bearish Engulfing candle

Relative Volume Candle Shaderthis indicator is based on the work of M0rty's "candle color by volume z-score"
I've taken M0rty's indicator a few steps further to yield a wider range of outputs, showing both extreme high and extreme lows of volume in 2 gradients.
the brightness of the candle is based on the z-score. brighter candles have unusually high volume, and dimmer candles have unusually low volume.

SuperPerformance_V1.24SuperPerformance V1.24 - Advanced Performance Analysis Indicator
🎯 CORE FEATURES
📊 Performance Analysis
• Stock vs Index comparison across 6 timeframes (1D to 200D)
• Conviction scoring system (Perfect/Solid/Good/Ok/Weak/Poor)
• Real-time outperformance tracking with ✓/✗ indicators
🏢 Sector Analysis
• Top 5 sector ranking with live performance data
• 10 Indian market sectors tracking (PHARMA, TECH, FINANCE, etc.)
• Automatic sector identification for current stock
📈 Technical Tools
• Triple Moving Averages (SMA/EMA/WMA/HMA)
• Distance from MA analysis with percentage/spread calculations
• Enhanced hover tooltips showing distance info
🔔 Smart Alerts
• Dynamic Circuit Breakers (20%/10%/5%/2%) that adapt to volatility
• Extreme distance alerts when price deviates significantly from MA
🎨 Visual Interface
• 4 customizable tables: Stock Performance, Sector Performance, Distance Analysis, Sector Display
• Dark/Light themes with professional styling
• Flexible positioning - place tables anywhere on chart
• Mini mode for compact display
⚡ Advanced Features
• Real-time data from 10+ Indian indices
• Granular controls - show/hide any columns or rows
• Multiple tooltip methods (Labels/Data Window)
• Professional color coding for quick analysis
🎯 PERFECT FOR:
Indian stock traders, sector rotation analysis, performance monitoring, and technical analysis with institutional-grade features.
📌 KEY BENEFITS:
✅ Multi-timeframe performance tracking
✅ Sector rotation insights
✅ Advanced moving average analysis
✅ Professional-grade visualization
✅ Customizable alerts and notifications
✅ Indian market focus with NSE data integration
🔧 TECHNICAL SPECIFICATIONS:
• Pine Script v5 compatible
• Overlay indicator
• Real-time data processing
• Memory optimized
• Multi-security data support
• Professional color schemes

NASDAQ Liquidity Breaker Bot1. Define session time (7:20 PM – 7:40 PM BD time / 9:20–9:40 AM EST)
2. Detect 15M swing high/low zones
3. On 1M chart: Detect strong bullish/bearish break
4. Identify breaker candle zone
5. Trigger entry based on break + retest logic
6. Set SL and TP logic (dynamic if needed)
7. Plot everything visually (entries, exits, zones)

Kalman Moving Average For LoopKey Features of the Indicator:
Flexible Moving Average Calculation (calcMovingAverage):Description: Allows users to select from 10 moving average types (SMA, EMA, DEMA, TEMA, WMA, VWMA, SMMA, HMA, LSMA, ALMA) to process the input price source (pricesource, default: close).
Parameters:
maType: User selects the moving average type (default: HMA).
period: Length of the moving average (default: 14).
almaSigma: Sigma parameter for ALMA (default: 5).
Purpose: Provides versatility in analyzing price trends, with the chosen moving average (maValue) used for comparison with the smoothed Kalman filter output.
Kalman Filter for Price Smoothing:
Description:
Applies a Kalman filter to the price source to produce a filtered price (kalmanFilteredPrice), which is further smoothed using an HMA to create smoothedKalmanPrice.
Parameters:
process_noise: Controls system model noise (default: 0.01).
measurement_noise:
Controls measurement noise (default: 3).
N: Filter order, determining the number of state estimates (default: 3).
smooth_period: HMA period for smoothing kalmanFilteredPrice (default: 9).
Purpose: Reduces noise in price data, providing a smoother trend line for signal generation and plotting.
Historical Analysis with For-Loop:
Description: Uses a for-loop to calculate the average of calcMovingAverage values over a user-defined historical range (from to to_) for historical bars of the price source (pricesource ).
Parameters:
from: Start of the historical range (default: 1).
to_: End of the historical range (default: 25).
Purpose: Computes an average moving average (avgMa) over the specified range to compare with the smoothed Kalman price for signal generation.
Error Handling and Robustness:
Description: Includes checks for na values in the for-loop to ensure only valid calcMovingAverage values contribute to the average (avgMa). Resets signal and plot variables each bar to prevent carryover.
Purpose: Ensures reliable calculations and prevents errors from invalid data.

K_RSI_ATR_ATR%_CMO_MACD_ADXThis indicator is combination of below indicators:
RSI
ATR
ATR%
CMO
MACD
ADX

1分足200MAの傾き %Sure! Here's a clear and natural way to express that in English:
“I’ve calculated the slope of the 1-minute chart as a percentage. It’s intended for use in scalping strategies.”
If you'd like to add more detail or context—such as how the percentage is derived or what threshold indicates momentum—I can help expand it further.
1分足の傾きをパーセントで表しました。スキャルピングでの使用を想定しています。

NY Open ATR System - Tick Range Filter### **New York Open ATR System - Brief Overview**
#### **🎯 Core Purpose**
Identifies **high-potential breakout setups** at the New York open (13:30 UTC) by combining:
1. **Volatility filters** (dual ATR periods)
2. **Tick-based range analysis**
3. **Time-specific triggers**
---
### **⚙️ Key Components**
| **Feature** | **Function** |
|---------------------------|-----------------------------------------------------------------------------|
| **ATR Filters** | Dual volatility checks (short + long periods) at 13:25 UTC |
| **Tick Range Limit** | Highlights candles with range < user-defined ticks (default: 150) |
| **Time Precision** | Focuses exclusively on 13:30 UTC weekday candles |
| **Visual Markers** | Yellow highlight + tick count label (e.g., "147/150 ticks") |
| **Info Panel** | Real-time display of settings and current tick count |
---
### **📊 How It Works**
1. **Pre-Open Check (13:25 UTC)**
- Verifies market volatility using 2 ATR values
- Requires both to exceed user-defined thresholds
2. **Open Analysis (13:30 UTC)**
- Measures exact tick count: `(high - low) / instrument_mintick`
- Compares against your max tick limit (adjustable 1-5000)
3. **Visual Trigger**
- Highlights candle yellow if:
```tick_count < your_set_limit```
- Labels show exact performance vs limit (e.g., "142/150 ticks")
---
### **⚡ Trading Signals**
| **Condition** | **Visual Feedback** |
|----------------------------|---------------------------------------------|
| High volatility + tight range | Yellow candle + tick count label |
| All other scenarios | No marking |
---
### **🛠️ Customization**
```pine
// Key Adjustable Parameters:
maxTicks = input.int(150) // Set 1-5000 ticks
atrPeriod1 = input.int(14) // Short ATR (2-5000)
atrPeriod2 = input.int(161) // Long ATR (2-5000)
candleColor = input.color(color.yellow) // Highlight color
```
---
### **💡 Practical Use Cases**
1. **Breakout Anticipation**
- Tight ranges after volatility spikes often precede strong moves
2. **Session Scalping**
- Identify low-range opens for mean-reversion plays
3. **Volatility Filtering**
- Avoid trading when ATR thresholds aren't met
---
### **📈 Suggested Settings**
| **Market** | **Max Ticks** | **ATR Periods** |
|------------------|--------------|----------------|
| Forex (EUR/USD) | 100-200 | 14/161 |
| Stocks (SPY) | 50-120 | 10/200 |
| Crypto (BTC) | 300-500 | 20/100 |
---
### **✅ Benefits**
- **Precision Timing**: Focused on NY open liquidity surge
- **Quantitative Filtering**: Exact tick measurement + volatility thresholds
- **Clean Visuals**: No chart clutter - only marks qualifying candles
- **Adaptable**: Works across all markets and timeframes
This system helps traders spot high-probability breakout setups by combining volatility anticipation with precise range measurement at the market's most liquid opening window.


Ergun BTC AO Strategy TP-SL Yatay“A manual trading strategy that works with EMA50, liquidity breakouts, and AO momentum divergence, drawing automatic TP-SL levels with a Risk-Reward ratio of 1:2.”

20% Rally - All Green CandlesThis indicator detects rallies where the price rises 20% or more using only consecutive green candles. It marks the rally's start with a green dashed line and "Entry" label, and the end with a red solid line and "Target" label. Ideal for identifying strong bullish momentum on daily charts.

London Reversal + LazyAlgoLondon Reversal Strategy with FS Entry
This script detects trend reversals during the London session, following the Asian session, using technical signals based on moving averages, Asian range breakouts, and multi-timeframe trend filters. It includes a system of visual signals and alerts, with customizable Stop Loss and Take Profit levels.

ZYTX RSI SuperTrendZYTX RSI SuperTrend
ZYTX RSI + SuperTrend Strategy
The definitive integration of RSI and SuperTrend trend-following indicators, delivering exemplary performance in automated trading bots.

Overlay: Candles + EMAs + SignalsOverlay Candles + EMA Signals is a Pine Script v6 indicator featuring:
• Main panel (overlay):
– Candlesticks with EMA(7), EMA(14), EMA(25), and EMA(99)
– Bold green upward arrow + “BUY” label below a candle when a bullish EMA crossover occurs
– Bold orange downward arrow + “SELL” label above a candle when a bearish EMA crossover occurs
• Lower panel (overlay = false):
– MACD histogram (12, 26, 9)
– On-Balance Volume (OBV) with OBV EMA6 and EMA24
BUY/SELL signals are triggered on EMA fast-to-mid vs EMA long crossovers, designed for early detection and clear visualization (to help avoid FOMO).
This script is clean, uncluttered, and optimized for TradingView Premium usage.

First 15 Min H/L Breakout Signal V3 - Session Aware (Adaptive)this script checks the breakout on 1min time frame as compared to previous breakouts happened on 15min and 5min.
