USDTRY - Be wary of Intervention ex-post Rapid MovesTraders layering into TRY potentially got burnt last week as the Turkish Central Bank intervened to halt the local currency's worrying devaluation by raising interest rates by a whopping 3%
Whilst i tend to let the majority of fundamental data pass me by , it often pays to atleast maintain a health awareness of key macro factors that might have a direct impact on any currency pairs you are trading or tracking (this is different to following any random commentator's subjective opinion)
While I do not like setting upside targets , it can pay to trail stops at healthy profit levels during large abnormal moves so as not to give back profits (we saw this in crypto in Dec 17) adn if we miss the big move initially wait for natural pullbacks / consolidations rather than chase an entry. There will ALWAYS be a pullback or another instruments that will offer the next big move. Worst thing to do is chase an entry through FOMO , get burnt and then be paralysed the next time a big opportunity presents itself.
Stay rational, stay calm and nimble
Economic Cycles

How to spot bear market. Live example.Pretty simple.
1- When we lose the important moving average's, it's an indication a bear market is possible, but by itself does not confirm the start of a bear market at all.
2- When the MA50 starts going downwards... you can start betting we're in bear market.
3- When we lost the MA100 and it starts pointing down, bear market is confirmed, but by then we already dropped alot thought.
4- Usually the faster the climb up is, the longer the bear market lasts. The more time we are in bull market, the more violent and quick the drop. Compare 2014 2017 perfect example.
5- Everything comes in wave of 3. 1rst time people don't notice, 2nd time don't really believe, 3rd time everyone with simple minds are thinking "last 2 times they said it wasn't going up/down, last 2 times it did this it keeps repeating itself, clearly I can buy/sell/join that sect/vote for that NAZI that knows how to manipulate minds. Etc. Always.
*- Several factors and indicators have to point out to the same thing. It still needs an educated human eye (or hella good AI?!).
Why anyone can't just use this blindy? Take this for example:
But... I mean... to me it's obvious... we're not about to start a bear market when we just got out of one & people sold hard and there hasn't been any buying yet...Makes no sense.. But yeah every one doesn't see this I guess.
But anyway, this is obviously not for finding signals, just getting an idea of the general trend and putting the odds in your favor.
And you can use the MA's as support/resistance to long or short. when several resistances or support are at the same area it's bonus triple kill!
The moving averages, especially higher numbers) are mostly viewed I believe by these wonderful people, the investors "in it for the long term", these wonderful people give us money everytime we hit one of their support or resistance.
www.youtube.com
This drawing (+ my evil plan ofc) gave me the idea to post this:

BTC Block Reward Halving on ChartPointed BTC halving dates on chart.
Previous halving dates can be seen on en.bitcoin.it

Bitcoin and Retrograde Events for 2018Alright... this was a tad of work. Apologies for it being so messy.
Top of the trend lines, are Direct and leaving Retrograde zone
Bottom of trend line, planet enters retrograde zone and/or retrograde.
Rx = Retrograde
I watched a video on Renko Candles and the presenter listed several systems he uses for TA with one of them being Astro Cycles. This piqued my interest. I found the book and thought retrograde events were worth marking and observing.
Retrograde events have been noted to affect life on Earth. Of particular greater importance are the faster moving planets like Mercury and Venus. ...and the moon.
When a planet goes retrograde, it appears like it's going the opposite direction of Earth. Vice versa when it goes direct.
Briefly talking about a few planets.
-Mercury deals with health, mechanical, electronics, communication... when retrograde, computers crash, health vulnerabilities are more fragile, communication can go awry.
-Venus deals with materialistic and monetary things. So if Venus goes retrograde then monies should be afflicted. maybe... I don't know and am mapping it on the chart to see what happens.
-Jupiter - Expansiveness, if retrograde then deals with contracting.
-Eclipses are not auspicious events.
Again, apologies for not being more descriptive with this. I want to back test this whole thought process with 2017 retrograde events.

How to enter a trade - Part 2 (Lower time frame) CTR/BTCHi everyone.
Here is part 2 of the CTR/BTC entry signals video. It focuses on pinpointing an entry level using a lower time frame.
I'll put out an exit signals video shortly that covers things from that perspective.
As always, let me know if you have any feedback or suggestions for future videos.
Cheers and good luck,
RJR

A Wyckoff Analysis of january 2018 Bitcoin "bubble"In Wyckoff Analysis, four main phases occur during the trading cycle: accumulation, markup, distribution and markdown.
Accumulation phase is when smart money enters on a long position, when general public is not interested.
Markup phase is when parabolic movements start, driving media and public attentions, when entusiasm and FOMO make their victims.
Distribution phase is when smart money start exiting lasting only newbies' money. During distribution, bulls fail to stablish new highs,
a big correction may be seen, driving fear to the market, this correction is followed by a lower high. Usually where traders exit positions
and public think everything is back to normal, this is called bull trap.
The Markdown phase is when ansiety, fear and pain make general public close positions with huge losses.

Bubble inside BubbleHi,
This is not a trading plan but a likely scenario for another giant Bubble for Bitcoin.
BTC is growing bubble after bubble (4th in its history since 2008).
Take off has ended at $20.000 when CME Future Contracts opened.
Investors has shorted heavily via these contracts. Institutionnals are coming slowly into this market where in the same time where governments are trying to find solution for regulation on cryptos (it's needed imho)
The market cap is still ridiculous in comparaison with other assets.
Many people make the comparaison with the Dot Com Bubble in 2001. That's true, i think BTC could lead the same road but maybe at higher level.
The total market cap in Dot Com market, when the bubble burst, was 9.6 Trillions !
At $20.000, the total market cap in Crypto was "only" 800 Billions, almost 10x less than dot com market capitalization in 2001.

For next time: how to spot the reversal, making money as a bear.Fib extensions.
Draw a high from the previous high to the bottom of it's real correction (4h retraces to the 20MA, in BTCUSD's case, work.)
Now, extend to the current peak.
Is it failing to retest the 0.236? Get out, prepare a to buy at the 0.618 if it holds.
0.618 holds? buy but prepare to sell at 0.382.
0.618 fails? try at 1.0
Buy at 1.0 but prepare to sell at 0.618.
0.618 is now resistance?
Congratulations, you have a bearish reversal.
Feel free to keep playing this game of buying and selling at fib levels and moving averages: if it will drop to 1.618, sell again at 1. Drop to 2.618, sell at 2.0, drop to 3.618, sell at .. well, 2.0 again if it will reach it. otherwise 2.618
If there's signs of a reversal, you can draw a new fib retracement from the top to the newly minted bottom and repeat the same game up the stairs
What i'm trying to say is..
Bitcoin isn't done dropping, but that doenst mean there arent any opportunities.

Emotional Market CycleZCL and the emotional market cycle. The resemblance to the classical pattern of boom and bust is uncanny. wallstreetjackass.typepad.com
The boom manifests itself in 5 wave impulse move. Checkout Elliot Wave Theory. www.babypips.com
The bust culminates in a 3 wave correction down to the vicinity of where it all started.
If you can identify these patterns in the markets and learn how to trade them, your future is going to be golden. Never stop learning and most importantly: do not blow up your account! You will makes mistakes along the way, so make sure you can make enough mistakes to master the game. Mistakes are essential, because that is your only way to learn.

trading market cycles with PRO SinewaveFor those who already know or simply heard about Sinewave oscillator created by J.Ehlers out of Hilbert filter formulas... The PRO Sinewave indicator will stun you !
For those who don't, well you might be missing a very interesting market approach and I suggest you to google the two names above to eventually start tipping a toe into the beautiful cyclical world of trading !
Usages can be very wide but I personnaly focussed on creating an algorithm to filter, and signal out of the sinewave oscillator.
It ended up with this PRO Sinewave indicator !
But there's an important thing you might need to know (if not already) is that a proper trading signal can never come out of a single indicator... (holy grail indicator doesn't exist and therefore every indicator will have its own strengths and also weaknesses). To avoid this I also developped the PRO Momentum wich is also a very complex signaling indicator (with patterns coming out of momentum based indications). Momentum and cyclical approaches are very complementary and when you combine the signals from the two indicators you'll obtain a very low risk trading signal. That doesn't mean they'll be 100% winners... Only fools could believe such thing. Everything about the Momentum & Sinewave signaling process is details in this PDF manual (right clic to download)
Anyway I hope I caught your interest on this great topic that is cyclical analysis of the market !

Is it always a good time to buy ICOs?For an ICO to give you a positive ROI, history shows that an average time frame of 6-9 months is needed before the market starts to move into markup phase.
This time frame is shortened as the bull market gets closer to the end, as time frames compress, and price action accelerates. Furthermore, towards the end of the bull market, the returns in % become much lesser.
The best time to buy an ICO is when:
1) BTC price is cheap
2) We still have a foreseeable bull market ahead
However, as the bull market comes to an end, the risk of btc price decreasing, and having the altcoin be slow to market, multiplies the risk (of buying an ICO) exponentially.
With this potentially being the last leg up for BTC and consequently for alts, please thread with caution.

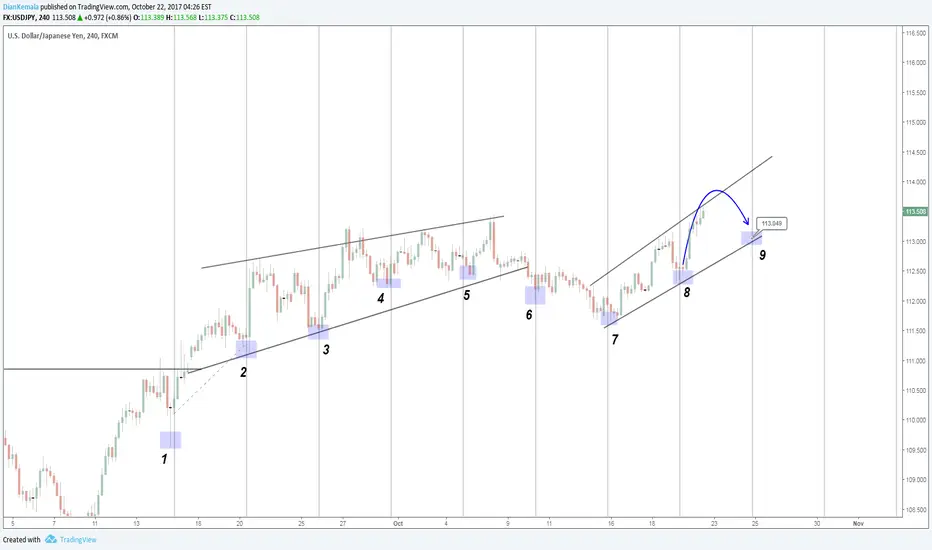
USDJPY Cyclic linesTo analyze a good pattern, there is many requirement.
1. Clarity
2. Initial trend
3. Volume
4. Uniformity
5. Support/resistance strenght
6. Break out strenght
from all that requirement, i will discuss about uniformity.
Uniformity is how wave perform inside pattern, a good uniformity have a good range between wave, and this analysis model use to analyze time factor.
To analyze uniformity we use cyclic lines, one of the best tools in tradingview.
step by step use cyclic :
1. Cyclic lines is 6th toolbox tradingview,
2. to use it we have to find two higer low (in bullish), or two lower low in bearish.
3. draw from low 1 to low 2 to find next low level.
4. everytime price reach cyclic, it will be new low, and this cyclic can perform up to 20 cycle.
In this sample i draw from low 1 to low 2 to find next low. (up to 20 cycle)
As u can see in everytime price reach cyclic lines, it perform support, and touch lowest level price at every cycle.
In this sample,, if USDJPY still perform a good uniformity, we will reach next cyclic 9 support around 113.049 at Oct.24, 21:00.
If you have any question about this anaysis method, feel free to ask.
Thanks, see u at next education post.
Bye
Is Gold in bubble ?hi,
This is not a chart for trading or to get entry/exit levels.
I remember in 2010 when newspapers/ news on television were beginning to focus on gold price (media attention).
From this point, i tried to find if gold have real similitudes before and after with a classic bubble. Obviously, it does.
This is theorical and not a trade plan.
Comments are really welcome but, please, avoid this kind of comments : "do it in log scale, you'll see the difference" or "The system is collapsing and gold can't go back as low as 600$, because gold is THE money" ;)

Late Cycle... or New Cycle? When will it end!Its worth considering what market cycles can tell us about when this run will end. I won't (can't) explain the logic behind cycles, but they appear in every aspect of nature, which includes human behaviour. Seasonality is a well known example.
Using the Dow Jones as a barometer, its clear that there were 7 years between the 2002 and 2009 lows. We can't predict exact business cycle lengths, but it would seem from recent history that the next could have ended somewhere between 20015 to 2016. Because this did not appear to happen, investors now worry that a correction is overdue.
But what if the cycle low did happen? The market did not in fact move for nearly two years - from January 2015 to the elections in 2016. If true then the next mid-cycle, marking a peak, is towards the end of 2018. Interestingly this coincides with US mid-term elections, and in Europe the exit of the UK from the EU. 2018 could also mark the turning point for 'Quantitative Tightening' and monetary policy.
Momentum certainly is driving prices higher for now; reflecting easy financial conditions, low unemployment, and reasonable growth.
Behaviourally, a bull market end when 'bears' throw in the towel, and euphoria reigns. For any market, it creates a simple demand/supply imbalance. This cannot be said of the current state, and so we may look to 2018 for the final phase.

The Stock Market is following the 1982-2000 bull market pattern Simply notice the 'inflation adjusted declines' of 1974 and 1982 and the overall 1970-1982 correction and compare them to the 2002 and 2007 decline from 2000-2009 and see what happened after.
After two massive 50%+ declines, there doesn't "NEED" to be another massive wipeout for a long time. Investors do repeat patterns, so if they continue to repeat this pattern there is some downside risk of 13% and 20% over the near term, but over 150% upside potential which is 11:1 - 7:1 odds. Those are pretty good odds over the long term. For every 1 unit of downside risk you accept the potential for 7-11 units of upside. That's better than bonds by a long shot.
Keep this in mind when making your next investment decision.
All the best,
Tim
12:23AM EST 8/10/2017

BTCUSD - New Paradigm PhaseThis graphic of Classic Bubble Pattern, it happen on :
1. Oil 2008,
2. Nasdaq in 2000,
3. Chinese Shanghai index in 2007,
4. Cotton in 2011,
5. Waiting list
And in every bubble ended the same way: "they all came back down sharply"
Disclaimer :
This analysis not include personal feeling/opinion, and pure base on technical analysis, and historical data
Trading foreign currencies/cryptocurrency can be a challenging and potentially profitable opportunity for investors. However, before deciding to participate in the Forex market, you should carefully consider your investment objectives, level of experience, and risk appetite. Most importantly, do not invest money you cannot afford to lose.

Bitcoin Group SE (Germany) / Psychology of MarketThe idea of full market cycles is important to understand. “Where” you are within the current long-term investing cycle has everything to do with your long-term outcomes. The psychology of a major bubble follows a similar pattern, but having risen to ridiculous levels of leverage, has very much further to fall. Much greater collective psychological extremes are experienced in a rare period of manic optimism, and its inevitable aftermath.

Divergent views on US Economy | Yield Curve CompressionLooks like there are fundamentally different outlooks on the economy.

According to jobless claims, recession is unlikely before 2019Jobless claims indicator has been a reliable indicator of recessions. By examining a historical chart that goes back to 1960s we see a similar pattern in the behavior of claims and recessions.
Every single recession the U.S. encountered in the underlying period was preceded by a rise in jobless claims. The chart above draws the quarterly jobless claims. The shaded areas are the periods of recession.
The quarters that the U.S. officially got into recession in all cases were preceded by multiple quarters of rising jobless claims, and in most cases these rises are consecutive.
For example, ahead of the 2008 great recession, jobless claims increased for three consecutive quarters.
2001 recession was preceded by 5 quarters of rising claims( latest 3 were consecutive)
1990-1991 recession was preceded by 8 quarters of rising claims (latest 3 were consecutive)
the earlier recession have also had the same pattern.
Before any recession, we had a minimum of three quarters of rising jobless claims and in one case we had 8 quarters.
Having that in mind, it is highly unlikely that the U.S. will encounter an official recession soon(before 2019).
Best
Technician

GARTNER HYPE CYLE GARTNER HYPE CYLE
1. Technology Trigger - A potential technology breakthrough kicks things off. Early proof-of-concept stories and media interest trigger significant publicity. Often no usable products exist and commercial viability is unproven.
2. Peak of Inflated Expectations - Early publicity produces a number of success stories—often accompanied by scores of failures. Some companies take action; most don't.
3. Trough of Disillusionment - Interest wanes as experiments and implementations fail to deliver. Producers of the technology shake out or fail. Investment continues only if the surviving providers improve their products to the satisfaction of early adopters.
4. Slope of Enlightenment - More instances of how the technology can benefit the enterprise start to crystallize and become more widely understood. Second- and third-generation products appear from technology providers. More enterprises fund pilots; conservative companies remain cautious.
5. Plateau of Productivity - Mainstream adoption starts to take off. Criteria for assessing provider viability are more clearly defined. The technology's broad market applicability and relevance are clearly paying off.


