Economic Cycles

Buying vs Selling Pt2- Who's really in CONTROL?Part 2 here is all about CONTROL .
As I said in part 1, people tend to equate green candles with buying and red with selling but the default coloring is wrong and does not reflect the actual actions of smart money.
Like color, a common misconception is that if the day is red and way down, people are selling off. The reality is most of the time the market is down because buyers are in control .
Think about the stock market the same way you might think about a housing market for a moment. Have you ever heard "it's a seller's market" or "a buyer's market"? What's going on in those markets? Usually in a sellers market, the homeowner lists their house, gets a ton of bids, and chooses the highest bidder. They may even decide they listed too low or change their mind. In a buyers market they may not be so fortunate to get a lot of bids and the bids that come in may be below their asking price. Depending on their motivation, the homeowner in a buyers market might sell for below their asking because they are in a dire situation where they need the money or are spooked that prices are going to continue to fall.
In a lot of cases, that's not too far from stock markets. Think about the last month or so with the COVID-19 pandemic and look at this chart-
Who's really in control here? You always hear people saying, "Sellers at it again" when we have these -7% trading halts. The reality is closer to this though, who really wants to BUY in a time like this? Sellers have lost control. Through much of the crash you could not sell your shares for yesterday's price because the buyers on the other end of the table said no thanks, I think I can get a better price to buy at later.
Here's an example of the December 2018 correction and some insight as to the balance of control-
Until you understand it better, thinking of control and phases this way seems counter-intuitive. Why is the price RISING if people are SELLING? Or why would price be FALLING if we're supposedly BUYING? I like to look at it in terms of these phases (on main chart)-
Buyers Collect -> Chase -> Sellers Profit -> Panic
Most of us are dumb money, retail traders. Oh, and we're HUMAN. We struggle emotionally with harvesting profits because we get greedy and our heart starts pounding when we see heavy volume and giant red candles.
Combining color and control on a couple intraday examples-

Buying vs Selling Pt1- COLOR, Most have it completely backwardsI'm making a little educational series of tutorials to put some of my trading philosophies into writing for myself but also to help teach anyone interested or provide a fresh perspective to others.
Let's start with COLOR .
From indicator lines, fill regions, background colors, arrows, to barcolors (be it from an indicator or just the basic candle), most traders are looking at a green candle and a red candle in reverse. Novice traders see a big fat candle and think, "Wow, lots of BUYING" then see a huge red candle and think, "Lots of SELLING". I think we inherently associate green with money and like to see lots of green when we have long positions. And then we associate red with emotions of fear and panic, bad things.
Let's have a look at a chart of SPY using the "Ehlers Instantaneous Trend" with ribbon and barcolor to help identify trends and paint them the color we are accustomed to seeing-
Very quickly I'm sure a lot of people think the coloring makes sense and might be looking up the Ehler indicator right now (it is a really cool one so go ahead). What we're seeing is this-
Most of the time the green candles have been when SPY has been rising
Most of the time the red candles have been when SPY has been falling
Seems natural to buy when you see these green candles going up and sell/avoid buying when you see red candles going down.
The problem is that that's what dumb money does! They buy when smart money is SELLING. Those green candles are actually the result of a smart buyer who timed things correctly and bought at the lows and is now 1) holding onto their shares, 2) waiting for sell signals. And when those red candles start showing up, dumb money gets all panicky and starts selling their shares. They might wait for closing cost to fall beneath a moving average or some other indicator, then they start selling and voila- capitulation. The price those sellers get is probably not great and when it's all said and done was not very much above what their entry price was.
But as people are selling, smart money is BUYING. They are fishing for a bottom to start accumulating shares. They look for really 'red' days with lots of volume, a perfect cocktail of emotion that gets weak hands to tremble and chase the price down before capitulating and selling for whatever price they can get. And usually when this is occurring, the bottom forms.
Let's reverse the colors of the bars and start seeing things through the lens of smart money-
Now if you are still associating green with buying and red with selling, the world should make much more sense. When the candles turn green here you're a buyer and when they turn red you're a seller. That doesn't mean buy the first candle and every candle, all the time, every time. It means that is when you are waiting patiently for the most opportune moment to buy. And when these candles are red you aren't freaking out and selling, you tell yourself "I am looking for moments when I can take some profits off the board when we get really crazy moves up, and maybe replace some of those shares with a few new shares I purchase at lows or on some bad days". The point is that this is a selling phase. I will go into depth as to why selling phases go up*, because I know that's a concept that people struggle with psychologically. (* there's two kinds of selling, as well as buying, which we'll get into).
Here are some close-ups on candles and their default colors-
Same chart, colors flipped -

Virus spread/Bacteria poluation/Ponzi scheme lifecycleThis is the most important chart of the next 12 weeks.
It always follows a similar pattern.
Top can happen at any time, but with the temperature spike of this week (right as europe & usa quarantine started) + lockdown + sun, it could be close actually.
One thing is clear: Fear is profitable. Can also lead to huge losses. And at what point does it just become random gambling?
Noobs will chase every move, or not cut their losses, or have a losing strategy, get emotional, either way, will get rekt.
The top can look many ways, like a weak diagonal up, flat, flat on average, sharp V, etc.
Here is the example of a ponzi scheme currently in the stationary phase:
Goldman sachs is calling for a Q2 growth number of -10% or something like this heh :D
The worse could be over, actually I totally expect the stock indices to have bottomed (for now) and go higher. BTC too.
Traders of course secretly wish it gets way worse, and are angry at politicians trying to save lives - allthought their actions do more harm than good and will hurt the economy badly which is good for us.
I won't lie, like I many I have dreamt (literally) of a catastrophy like this a few times. It's not that bad which is a shame, but it is something.
We are not here to look like caring people, we are here to make money at other's expense. What a wonderful period we are going through ^^
Every one is so afraid, terrified, reverting back to full reptilian brain (as opposed as only 99% usually), their primal fears are emerging, they do not make rational decisions, they would sell an obvious bottom at all time low Price to Earnings, allowing non-reptilian brains ("polite" people call it non-emotional) to make big profits.
Also moves are super violent and one sided, barely any retrace. HUGE rewards to risks. Fear panic death and misery is very profitable. And looks like it could get worse and much more people could get sick, lose their job, et caetera. AWESOME!
For the next weeks the driver I guess will be this chart here...
Let's check back on this every few days.

Investors, do not panic, relax, and hang in thereThis might be it.
I've seen a video recently "A Guided Meditation for When the Stock Market Is Dropping"
Loved it. A video to help reassure and relax bagholders.
"The market always goes up over time" I keep hearing this over and over and over.
It is so absurd, so stupid, but every one keeps repeating it.
Complacency much?
All these investors need a harsh lesson.
"Last time they said" "Bears are wrong".
"Just do nothing" "Market drops it is perfectly natural".
Except the stock market has spent more than a century in a range at once in the past, and it is only 500 years old.
Going to be great to see the paradigm of "blindly invest 100 bucks a month since you are young and you will be a millionaire with no effort by 50" crash its face on the ground.
"Zoom out" "Always go up". Hehehe let's see where those people are when the SnP goes 3 digits.
I have had this idea for a while, and was thinking the dow would top 27000 to 33000 then the big crash would happen.
Price to Earnings, Price to GDP, Revenues, What revenues should be, inflation, rational measurements.
They all say it is way time to go down.
Emotional and dreaming people think "price go up forever dis just noise", especially boomers. They have only known a bull market maybe?
Well bubbles have to pop and nothing "goes up magically forever with 0 effort 0 risk not even having the patience to wait for cheap prices"
Does this really make sense? Getting rewarded for absolutely nothing...
Would have been nice if friday the 13 would have had a huge crash but probably recovers for now awww.
People especially in europe terrified of covid-19 coronavirus when it's been declining and almost no new cases now in asia, and this clown of a french president said yesterday "it has just begun" and "it is accelerating at an alarming rate so we are shuting down the country no school work from home non urgent patients are cancelled and so on".
The irrationals will lose money, the rationals will make money.
US democrats hate Trump so much they will do everything they can to help this market go down, they LOVE the price falling like this.
So the woke US irrationals are the ones to want the world stocks to go down down down down, pretty neat.
And boomers are going to be so desperate after losing their retirement, they'll be tempted to vote for free stuff dems in 2024.
Which will mean more bear YEEEEEESSSSS!
I wonder who will be the 2024 dem nominee? Tulsi Gabard is being ignored, probably because she is moderate and won't bow down and pro freedom at least partially.
They want a wahman do'nt they so this would be nice... Or an 80+ yo bernie? xd Or some other complete nutcase... Or salamander IQ AOC?
They are scary, if a complete nut gets the power to ruin the country the bear will extend a bit too much.
All is setting up for a mighty mighty bear cycle, and these "infinite free money no effort just buy and hold" are going to learn the most brutal lesson.
I love it!
Keep moneyz to buy cheapy stonks when they drop 80%
FED probably going to print more and more magical money because this works so well, if they keep doing that there will be a revolution of the poor eventually and the result will simply be even worse.
Bear Power!

EN BTCUSD - All Time Logarithmic Scale Chart (Halving Cycle)IDEA UNDER CONSTRUCTION.
Further study:
www.youtube.com
finees1985.wordpress.com
BITSTAMP:BTCUSD

What's A Bear Market? Most Define It As a 20% DrawdownThis chart shows the Dow Jones Industrial Average after today's sell-off. In this published idea, we want to take a second to write about bear markets and what they mean.
In the media, bear markets are officially defined as a 20% drawdown from a prior peak. Today, the Dow Jones Industrial Average closed down 20% from its prior peak. Technically, this means the market is officially in a bear market. There are some interesting stats, however, that show this definition has its flaws. For example, since the 1940s, the stock markets has dropped 20% or more 16 times and only 7 of those have turned into recessions. Sometimes, a 20% drawdown is just that... a 20% drawdown without a prolonged bear market that eventually leads to a full on recession.
This post is not making any assumptions or directional predictions. Instead, we wanted to share a chart with everyone showing the official 20% drawdown in the Dow Jones Industrial Average while also providing more context about market panics and crashes.
Thanks for reading and press Like if you enjoyed this or leave a comment with your thoughts.

FFT & Phase split: LTC teleportation ONPhasing split price and volume by trend cycles then split each cycle in 3 harmonics system by DFT. Cloud are the resultant of each harmonic gradient system in each trend cycle.
LTC has amazingly jumped into its official bull cycle: He is the first of the major to have a reach a positiv super rope resultant (Resultant of a Waves system composed of 3 harmonic). The price may hold along and above this huge rope waiting for green waves army reinforcement.

EURUSD ACCUMULATION SCHEMATIC #2EURUSD WYCKOFF ACCUMULATION SCHEMATIC #2
-Here is the link to the image example this was based off from
school.stockcharts.com


Coinbook - Pure Play on Numbers - DailyBuy the code and trading idea details behind this strategy at coinbook.com
We will backtest your trading idea for free: coinbook.com
We build custom trading bots. Please reach out to implement this idea at support@coinbook.zendesk.com.

Bitcoin fantasy? longterm chart.Just some support lines & possibilities.
However, it would be nice if bitcoin walked this path roughly.


Asynchronous BTC cycle with some altcoins. How to make money.How to make money on some altas that go completely against the Bitcoin trend or are ahead / behind? How to use it for profit taking? The cycle on the principle of working on btc / usd - alt / usd - btc / usd.
On many coins, a downward channel has now formed, both in the Alt / btc and Alt / USD pairs, most go synchronously to bitcoin. Which is logical, as bitcoin is growing in value in dollars. And on the one hand it seems in dollars, that is, in real money you will not earn anything on this. But some coins, on the contrary, move asynchronously, or at least late to the BTC / USD movement. Very often the difference is quite significant even in pairs to USD. This will be discussed.
There are many pairs that asynchronously go a large period of time Alt / BTC, Alt / USD. I think that it is understood that the price itself does not move as a counterweight, but it is intentionally directed at a certain period of time by people who have their own interest in this.
For a long time I have been watching how this is discussed in various resources on the topic of trading and cryptocurrencies. As a rule, these discussions and explanations do not have practical application, because the explanations come retroactively on the chart.
________________________________________
Explanations of the work.
XLM / USD
As an example, we see that a false breakdown on XLM / USD happened on November 12th. + 80% Then lowering the price to the lower border of the internal channel. And now the price is kept at the same level + - 15%. Roughly speaking, the price is kept from rising.
BTC / USD
At the same time, bitcoin is a completely different situation, although at first glance it seems similar. Just on November 12, a gradual, and then a sharp decline in the price of BTC / USD to the lower border of the domestic channel began, by -22%. And the price immediately rebounded + 20%. Let me remind you after reaching the borders of the internal channel on the XLM / USD pair, the price is kept at the same level, not allowing it to grow.
It is also worth noting that the channels are enormously different in terms of percentage step by XLM / USD and BTC / USD:
XLM / USD - 180% / 60%
BTC / USD - 50% / 25%
I think that you understand that this and the difference in the percentage step of the channel, plus the delay in price movement, is used to take profits. Also, the XLM / USD coin has good liquidity, then you can take substantial profits. In this pair, due to the large liquidity, you can scroll a fairly large amount of money.
Principle of operation.
Here is a simple example on an XLM / USD coin that formed a downstream channel like BTC / USD. But inside the channel, the movement is asynchronous to BTC / USD. Now the price of XLM / USD is moving down to the trend line of the internal channel , which acts as a support, the movement is now frozen in a lateral movement above this trend. Price does not allow further movement.
While BTC / USD, the price goes up to the upper trend line of the domestic channel. At the upper border of the channel, if there is no breakthrough and consolidation above, we sell BTC / USD (sold at the local maximum of the channel). At the same time, perhaps XLM / USD will reach the bottom of the channel. We buy at the local minimum of the downstream channel XLM / USD for dollars that we received for selling bitcoin at local maximums.
Then the whole action is repeated the other way around. It should also be borne in mind that this asynchronous arbitration is a profitable business, but altas always, when trend reversals, are ahead of BTC in profit in making real money. The correct entry / exit point is important. Hurry and greed is never necessary.
I also want to add that in most cases, those coins that are sent to Bitcoin asynchronously are clamped in the horizontal channel. Rare cases, as an example, are higher on the XLM in the downstream channel, even less often in the upstream channel. The reason I think is understandable, as it is a completely manipulative action and it is easier to adjust the price precisely in the horizontal channel. You also need to understand that a certain pair can work for a while. I only know a few pairs that have been working asynchronously for bitcoin for more than a year and a half. This is a gold mine.

Elliot wave perspective on bitcoin dominanceHello fellas, we've seen a huge moves on bitcoin in these past few days and in this specific post, I want to do a quick update analysis about the dominance of bitcoin. If you've seen my previous analysis about the correlation between bitcoin dominance and the bitcoin's price, you should know that lately bitcoin's price has a positive correlation with the bitcoin dominance.
Looking at the chart, I use the daily chart which is pretty consistent for the use of swing trader and has a great confirmation whatsoever. Based on EW perspective, I see that the period between September 5th, 2019 - November 12th, 2019 was the A corrective wave in bigger cycle. And with this fact, we can easily see that the A wave has formed a type of Falling wedges or usually known as a leading first wave diagonal. Usually, after this action, we will see the B wave that correct the action of A wave in this market cycle and the B wave could spike to the upside that moves align with the golden pocket zone.
But, other than that, we must consider the 70% level as a strong resistance for this dominance structure. with the price of bitcoin has a potential to touch again $8000 region, I do believe this dominance will have the similar spike as bitcoin has. The higher dominance level of bitcoin means the higher money inflow of the bitcoin and if more money inflow occur on bitcoin, we will see the demand spike comparing with the number of supply of bitcoin which will affect the increase of the price on bitcoin.


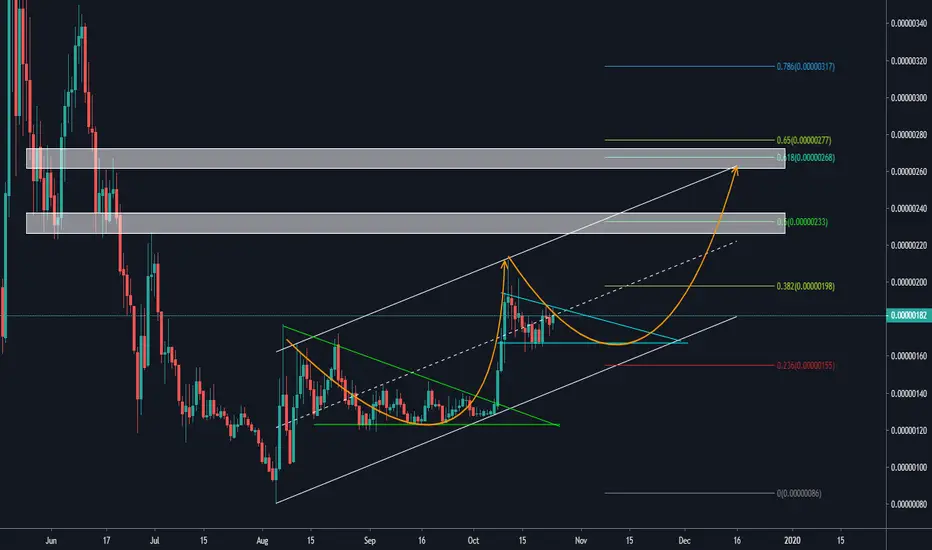
Matic network with possible 50% gain on SWINGThis is a quick update analysis about some of altcoins which have a good potential to grow and produce a possible huge profit in the near future. Let's do the technical analysis.
History is repeating itself is the most suitable quotes on MATIC here. we can see a similar pattern with previous structure in this huge up trend channel. we see a failure descending triangle which it broke to the upside. And in this current move, there is a possibility of it to repeating this previous pattern. A series of higher high and higher low can be a good reason for me to enter this trade.
If the price breaks out of the upper line of the triangle, I will enter the position and targeting the upper line of the huge up trend channel. 2 potential target that have the alignment with the previous price action is at around 230 and 270.
Watch out and let's be rich together.
GBPJPY WYCKOFF SCHEMATICS EXAMPLESHello traders,
we would like to share some value knowledge, about structure based mostly on Wyckoff schematics. As an example u have marked up few areas identify by us on multiple TF to help u deeper understanding about markets and printed structure itself. Please, scroll left and right chart to see multiple examples of accumulation and distribution schematics. Hopefully this will help u get some breakthrough in your trading journey.
God bless u all.

EURNZD WYCKOFF SCHEMATICS EXAMPLEHello traders,
we would like to share some value knowledge, about structure based mostly on Wyckoff schematics. As an example u have marked up few areas identify by us on multiple TF to help u deeper understanding about markets and printed structure itself. Please, scroll up chart to see multiple examples of accumulation and distribution schematics. Hopefully this will help u get some breakthrough in your trading journey.
God bless u all.
