How you NOT use Fibonacci! Support&Resistance for beginners!Hey everyone,
welcome to my second Video about fibonacci and how you should and should not use retracement- and extension levels. :-)
There is way more to say about resistance and support-levels.
Since I only got 10 mins. for a video I can just talk about small pieces and highly recommend you to check more about this topic.
I just wanted to give you an example how the market works and how it respects resistance and support-levels.
There are more Traders than those who safe profit to cause resistance or support-zones.
Stop-Loss-Levels gets triggered, Take-profit, fundamentals, those who are flat and wait for signals and so on.
If you wanna see more about that topic just use the comment section and tell me more about your wishes. :-)
You can also PM me!
Peace and good trades
Irasor
Trading2ez
Wanna see more? Don`t forget to follow me. :-)
Need education or more signals? PM me. :-)
Parallel Channel

Learn how MACD and Trendlines are Connected.Hey, I am back, this time with something, kinda unusual, and I dont know If you like this kind of stuff, but here is some education for you to make a better trading decision in your future!
Okay, so I would like to teach you a bit about MACD and how is this indicator connected to trendlines.
In this chart you can see three flags , each flag can be bullish or bearish.
But how do you know if a flag will be bullish or bearish?
Pretty simple and pretty hard in same way.
If a price breaks uptrend ascending ressistance it means breakout !
And if the price breaks ascending support level it means a breakdown .
This type of trading is called breakout trading.
But what makes flag, a flag? In simple.
Flag is a continuation pattern, they usually represent only brief pauses in a dynamic stock also they are typically seen right after a big, quick move , thats why we see so much flags in the Bitcoin charts, its a very quick and dynamic moving stock compared to others stocks, not cryptocurrencies.
Channel/flag, is formed by a ascending support level and ascending ressistance level.
Inside this channel you can spot tests on both support and ressistance level.
So lets now just go trough the chart chronologically and see how the MACD reacts to trendlines.
At first double top you can see the test of ressitance uptrend flag/channel.
This test was negative, you can spot that by histogram finding his top and starting to decline, same thing on "Point A".
As histogram is starting to decline ,Bitcoin is about to test a certain level, this time it is a ascending support level, you can spot it at first macd uptrend test where the histogram turned around and started to see buying volume increasing, this same is valid for each succesful uptrend test. After some tests of each ascending ressistance or support, when the price leaves this channel, its a prediction for a sharp move in a way, which was broken, for example broken ascending ressistance level would mean breakout.
After the first flag has broken out, steep uptrend were build , and succesful test of this steeper uptrend meant another wave of buyers p ushing price even higher, found ressistance at 6800, failed at testing second steep uptrend and found new channel.
In a second flag , Bitcoin is on selling wave , so for macd to give us buy signa l, Bitcoin would need to break ascending ressistance and that would give macd buy signal, its opposite as buying wave, while on buying wave you see rise in histogram which meant succesful test, here means the fall ( or rise from negative bottom if you will ) of histogram, Bitcoin finding support.
A fter Bitcoin has failed in the second flag breaking/testing the ressitance twice as macd suggest and also the ascending ressistance which wasnt overhelmed, the flag has seen a breakdown .
After breakdown Bitcoin found support and formed another uptrend , found new ascending ressitance and formed another flag, on this last flag, you can beautifuly see how is macd testing , each test represent an ascending support test on the chart, after 4 succesful test in a row, the flag has broken out and saw a breakout!
In short
MACD shows test of trendlines, ressistance, support.
When is MACD doing waves , or in another words blue riding on orange line, it means succesful test of uptrend , support and price of stock may continue to rise.
When Flag gets broken , heavy price action is ahead.
When uptrend is broken , usually downtrend is formed until stock finds support and from there form another uptrend.
The highest positive histogram tick represent finding ressistance , falling volume, headed to test support levels.
The lowest( or the longest if you will) negative histogram tick represent finding support and price headed to test ressistance for possible macd turnaround, on chart you can see two unsuccesful, which led to breakdown.
Hope you liked this Education about MACD and Trendlines connection and also some education about flags/channels.
Hope I havent missed anything important , if yes point it in comments.
I f I have learned you anything that you are able to benefit from and be a bit better trader , let me know by smashing that agree button, each like is very appreciated as I am doing this for FREE and it took me a LOT of time, Thanks a Lot!

ChannelsA channel on SPTM.
With 3 bounces on an ascending trend line and two on the parallel was created the channel.


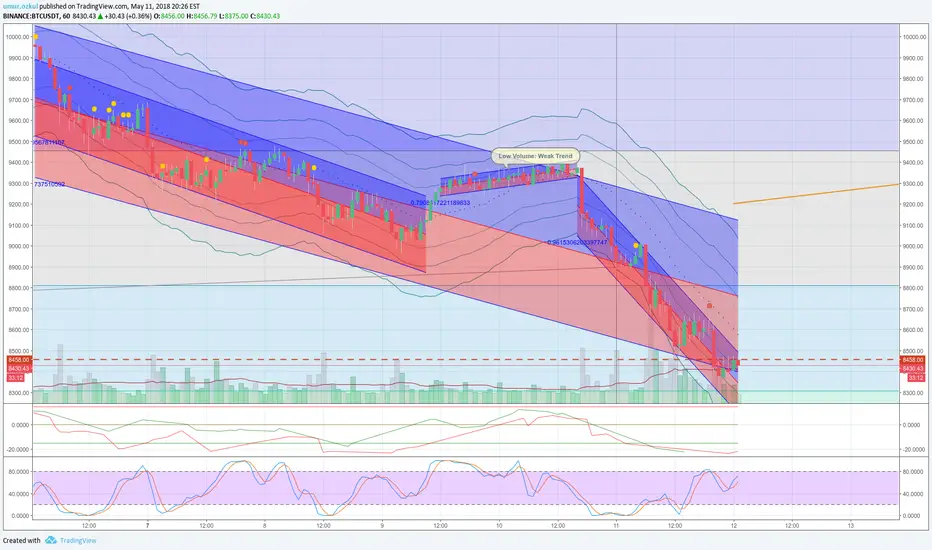
Regression Tool Showing Weak TrendBINANCE:BTCUSDT
This is an educational idea to highlight what happened in the last days.
Regression tool is showing what is going on nicely. I love it.
Between the 2 falls the up-trend is very weak. The volume is very low. Hence bulls cannot take over.
Education - 1) Trend & ChannelTo become a good trader
- Trend is the first think to know and understand;
o Trend always stronger than channels, ranges so ever,
o Trying to trade against trend is one of biggest mistake to do, which is sometimes experienced traders are doing
o If you wanna understand the trend you should look longer timeframes; in forex you can use weekly or monthly charts to understand it, in cryptocurrencies daily charts are cool enough, as i backtested
o Once you see the way, then you can start to look another indicators, channels, ichi, harmonics, fibs, ew, bb whatever you use
- Channels are second strong think to trade with;
o i just pinned one but as you see in the chart there are lots of them, and also there will be much more if you look at shorter timeframes
o Main think about trade with channels is; channel has to be on the same page with trend
o Second think is you should anticipate it before it occurs
- This is going to be my first educational document that i’m sharing, so feel free to criticize and add useful information with comments to make it better for me and community

My value channel strategy ETF investment strategy.
Long-term (3 yr)
Using my proprietary value channel strategy.
Ideal for use with long-term trending ETF's, Index ETF's work especially well.
It is based on a modified mean reversion strategy.
You can use same principles and strategies as Keltner Channels and B.Bands to get started for testing.
However, I suggest you tweak it to what works best for you and your lifestyle and make it your own and that you can trust.
1. Create trend channel.
2. buy on lows. Keep it simple.
3. Add fixed amount monthly, at low swings.
4. Never trade or invest with more than you can afford to lose.
5. Always use a stop-loss strategy.
6. For educational purposes only.
7. I am actively invested in this ETF.
Yes, it works on stocks as well, they must be trending, see tech stocks for example.
Use the last strong trend to create your baseline for your channel.
And yes you can change and update the channel as required. Monthly or Quarterly as needed. The channel is not fixed, but dynamic.
You can use the pitchfork tool or trend channel tool to draw the channels if you don't like to draw lines.

Example of a Downtrend Parallel Channel on PFFPFF formed a downtrend parallel channel.
A downtrend parallel channel (bearish channel) is a continuation pattern that slopes down and is bound by an upper and lower trend line.
The upper downtrend line it is called main line and marks resistance and the lower downtrend line it is called channel line and marks support.
For a bearish channel, the main line extends down and at least two bounces highs are required to draw it.
To draw a channel line ideally needs two bounces lows, however, some traders draw it using only one bounce low.
In a bearish channel the target is to short when prices reach main line resistance and take profit when prices reach channel line support, then, wait for prices to reach resistance again and repeat.

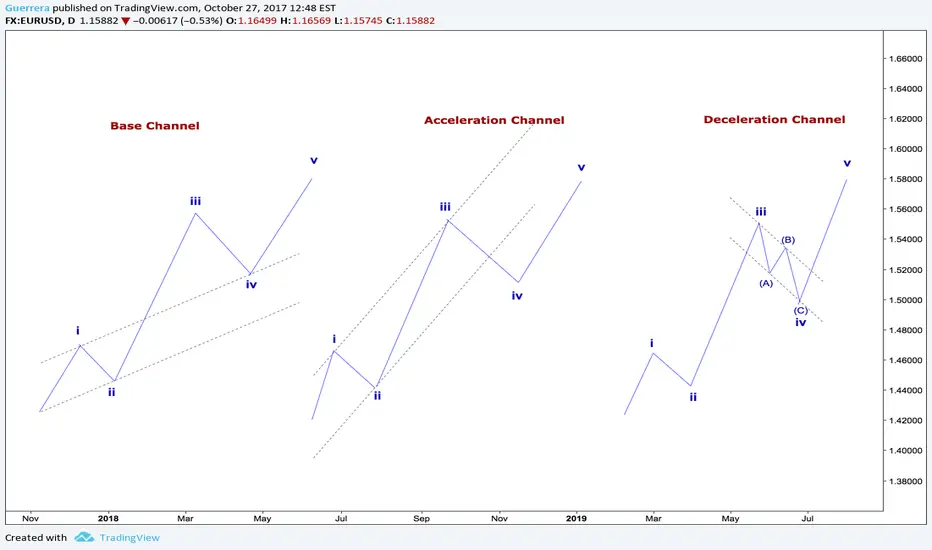
Parallel Channel and Elliott Wave CountingBase channel.
The base channel contains the origin of wave one, the end of wave two, and the extreme of wave one.
The base channel is most important, because it defines the trend.
Acceleration channel.
The acceleration channel encompasses wave three.
Once prices break through the lower boundary line of the acceleration channel, we have confirmation that wave three is over and that wave four is unfolding.
Deceleration Channel
The deceleration channel contains wave four.
To draw the deceleration channel, simply connect the extremes of wave three and wave (B) with a trend line.
Take a parallel of this line, and place it on the extreme of wave (A).
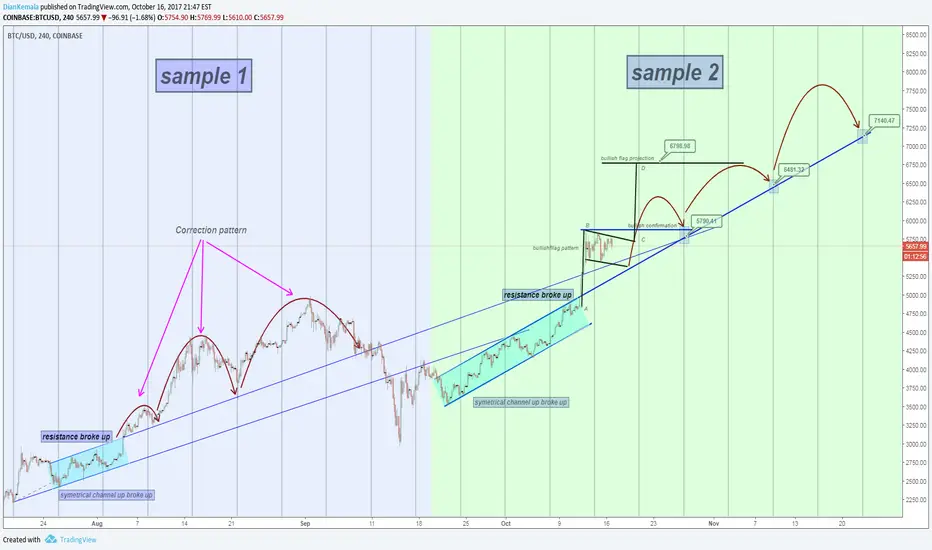
BTCUSD Correction patternIn this post i wanna share one of my method in analyzing price movement.
sample 1 :
we have symetrical channel up. After channel up resistance broke up, that resistance line will become support in next wave. Price action will try to break it as correction pattern.
sample 2 :
Again, we have same pattern here, symetrical channel resistance broke up with bullish flag pattern.
1. Bullish flag projection at 6798.98, This projection will reach after 1 candle full break up B line as bullish confirmation, If B cannot break, BTCUSD will down for correction back to A.
2. After B break up, we gonna see correction pattern as sample A, resistance line become support
3. If BTCUSD still follow the cyclic, next correction at 5790, 6481 and 7140.
Fibonacci channel swing tradingThanks to Fibonacci we have many tools helping with everyday analysis. Fibonacci channel is one of them. It is a simple tool which can cover whole swing and when used properly can find a lot of possible places for PA to bounce and create small intraday swings. Educate, practice and trade with Fibonacci cause this math algo is everywhere. In single atom, in plants, in our bodies and minds, in piramids, in our solar system and in galaxies. So it is also present in Forex. Even if forex is played mostly by computer algos those algos were writteln by humans so fibonacci is also in that code. Good luck and have a good weekend.


Patterns Identification For Trend Continuation Trade Setups Hi fellows, This is an example for patterns identification in a bearish market many traders struggle to identify patterns in a particular trending market for Trend Continuation Trade Setups. This is a perfect example for Pattern Identification.
1. IMPULSE ( First Entry )
In this chart, We have Bearish IMPULSE from top( that means market is setting up for a bearish trend) If you read that IMPULSE on time you can catch the wave right from the top for higher potential. We call this entry based on Trend Reversal Point. There are lot of names which you can use for that LIKE ( Potential Trend Reversal Point, Supply and Demand Zone, Support and Resistant E.T.C)
2. TREND CONTINUATION PATTERN ( Correction, Consolidation or Accumulation )
In this chart, From Top after the impulse we have a lower degree channel which was giving an indication that price is not going to continue until it finish the TREND CONTINUATION PATTERN FORMATION or Flag.
3. FLAG ( Trend Continuation Pattern ) ( Second Entry )
Once Flag completed, there is an other opportunity for sell which we called Entry based on TREND CONTINUATION PATTERNS. Here you can use Oscillators, Moving averages or any other indicator which can give you an indication that TREND CONTINUATION PATTERN is going to finish or Correction, Consolidation, Accumulation is going to finish for the next impulse or for the next wave.
Once you understand that Pattern is about to end and Next wave is about to start you can sell Before the Breakout or after the Breakout.
We call them:
1. Entry before the breakout:
2. Entry After the breakout:
We prefer to enter in the market before the breakout for better risk reward ratio.
4. Next IMPULSE
Once next wave or impulse appears and price again forms Trend Continuation Patterns you can repeat the same steps which you have done on the flag. But this time you might not see the flag may be you can see the Triangle as you can see in the example. Until price do not forms IMPULSE from the bottom and keep forming the trend continuation pattern you can keep adding more positions with reasonable risk. Please Keep In mind one thing, Once a wave already moved a lot adding more position without understanding the bigger pattern gonna be dangerous so always add more positions with care because buying on top and selling on bottom is dangerous so you need to understand the bigger picture so that you can understand whats going on bigger picture and where the high potential wave is. Always add more positions there where you see that, that particular wave has a huge potential and will not reverse any time soon. For that you have to analyse from bigger time frame to lower time frame so that you can pick that asset or pair where you will see that in longer term that pair will remain in a trending market not in sideways market.
5. Triangle (Trend Continuation Pattern ) ( Third Entry )
Repeat same steps which you have done on the flag
6. Flat channel ( Trend Continuation Pattern ) ( Fourth Entry )
Repeat same steps which you have done on the flag and Triangle
7. Bullish IMPULSE
Once you will see the bullish impulse from the bottom you can read that impulse and momentum on lower time frame. This is time to take the profit off from the market and time to buy for the change in trend.
Always remember. Patterns form with in the patterns so one pattern will show you the continuation and other one will show you the reversal so read them correctly.
In this chart, You can see bearish wave is running with in the higher degree descending channel and that channel is a trend reversal channel and in longer term price will change the direction to the upside and lower degree patterns are forming within that higher degree channel for the previous trend continuation and we were trading in that higher degree pattern so always remember that at some point that higher degree pattern will change the direction of the market.

Channeling Channeling stocks were the first way I learned to make money. Find the channel and buy at the FLOOR support and sell at the CELINING resistance. That would be a $43 to $48 channel and find the profits in there. Always remember to know your EXIT before you enter, your stop and your profit and manage your trades...but this strategy made me money.

HOW TO TRADE WITH CHANNELChannel strategy is a simple and complicate strategy.
A. Using it with Elliot Wave to follow a trend.
Follow the trend by "buy low, selling high".
B. Find a new turnover trend by a channel retest.
C. Find a continue wave by a sideways channel breaking
through.
Risk Management:
A. REWARD/RISH >1.5
B. Risk <2%
C. Move SL to TP1 or TP2 to protect your profit

Understanding structure and change in structure and pattern Hi fellows, Please look at the chart for Understanding structure and change in structure and pattern formation.

NZDUSD DESCENDING CHANNEL EXPLAINED!!!!!!MARKET ANALYSIS: The market has broken the huge uptrend channel and now its moving to a sell. Now in the lower time frame we have descending channel formation. We have strong support zone near the market price now. If the support zone is broken we can see a new lower low for a huge shorting opportunity. So lets wait and see what the market does in the coming days. Cheers!

Educational 03: How To Trade Channels (Part I)This is the third education series on Channel (link of Educational 01 and Educational 02 given below),
In this educational post, I cover up points that provide trades opportunity in a trending channel.
Steps To Follow:
Step 1: Connect Two Higher High Points to Draw a Trendline
Step 2: Connect Higher Lows points, take a buy call
Step 3: Buy at pullback with additional indicators
Step 4: Sell at 3rd touch point of Higher High with additional indicators Confirmation
I shall be sharing the examples on part 1 in next series.
What's Next:
1. How to identify trend with channels?
2. What is the right way to draw channels?
3. How to use Channels to find trades? ------------------------> NEXT
4. How to validate channel trades and manage risk?
5. Multi-time frame examples
Purpose: To educate retail traders like us, to make inform decisions and to become profitable in long run.
I WOULD APPRECIATE IF YOU COULD SHARE YOUR CHANNEL DRAWINGS IN COMMENT BELOW SO THAT I WOULD BE SURE THAT YOU FOLLOW WHAT IS BEEN POSTED AND WILL SET ME UP TO PROVIDE GREATER DETAILS IN NEXT ONE"
Thanks for your support,
Best Regards,
Neetesh

Educational 02: How To Draw Channels? This is the second education series on Channel (link of Education 01 given below),
In this educational post, I cover up points that validate a Channel and benefits of drawing a right channel.
Validation points are as follows:
Point 1: Two Parallel lines
Point 2: Higher High and Higher Lows in Uptrend and Vice-versa.
Point 3: Two compulsory touch points in order to draw correction trendline.
Three Touches are ideal also called "Three Touch Rule" (Will discuss further in next educational series)
What's Next:
1. How to identify trend with channels?
2. What is the right way to draw channels?
3. How to use Channels to find trades? ---------------> NEXT
4. How to validate channel trades and manage risk?
5. Multi-time frame examples
Purpose: To educate retail traders like us to make inform decisions and to become profitable in long run.
I WOULD APPRECIATE IF YOU COULD SHARE YOUR CHANNEL DRAWINGS IN COMMENT BELOW SO THAT I WOULD BE SURE THAT YOU FOLLOW WHAT IS BEEN POSTED AND WILL SET ME UP TO PROVIDE GREATER DETAILS IN NEXT ONE"
Thanks for your support,
Regards

Educational 01: How to Identify TREND with CHANNELSThis is my first educational posting series on "Channels".
In this educational series, I would cover five important points while dealing with channels, as given below:
1. How to identify trend with channels?
2. What is the right way to draw channels?
3. How to use Channels to find trades?
4. How to validate channel trades and manage risk?
5. Multi-time frame examples
Purpose: To educate retail traders like us to make inform decisions and to become profitable in long run.
Thanks for your support,
Regards


How triangle works on bullish channel?Dear friend's
How triangle works on bullish channel?
This is a simple way to find entry point in triangle bullish movement.
inverse, in bearish movement is true.
Hope this lesson help to me and help to you for improve your trading.
Kind regards,
Pooya Salehipour

BASIC PRICE ACTION & STRUCTURE TRADING (EDUCATION)This is basic stuff which keeps happening almost in all pairs & all time frames. Once you get the eyes trained to know this pattern, then only this setup & discipline will keep u on profitable side. Eye ball & try to find this setup in your charts & keep practicing it till u are comfortably finding the live trades in your chart.
