USDCAD Backtesting & Chart Work session on Price Action AnalysisHello everyone:
Welcome to a backtesting/charting session on price action analysis.
Many have inquired about how to properly identify market phrases (Impulse phrase vs corrective phrase).
In addition, how to use trendline properly to identify a structure/pattern as a continuation or reversal correction.
This session will be the start to all these.
So let's take a look into this. To start, make sure you have a new chart layout just for backtesting/charting work.
his won't get overlapped on your current chart for your normal analysis.
Utilizing tradingview’s feature on “replay”, this is how we can backtest and do chart work on previous price action that has already happened.
As we already see the price moved in that period of time, we then look for potential buy/sell bias entries to get familiar with the move within the market.
1. Start from the Higher time frames, top down approach. Utilize multi-time frame analysis to your advantage.
2. Identify what market phrase you are in, is the current price in a HTF impulse phrase ? or in a corrective phrase.
3. Now that you have a more clear bias on the HTF, then go down to the lower time frame to confirm your bias.
Do we see the same bearish/bullish price action on the LTF as well ? If so then that's a good indication that both HTF and LTF have the same buy/sell opportunity.
Look for possible entries on the LTF.
4. Repeat this process with different pairs, different markets to “program” our minds into looking for the similar buy/sell setups in the current, live market.
This is how we don't get FOMO, or fear of losing. If you have done enough backtesting and charting, then you simply remove the emotion out of the equation.
You have seen the move play out over and over again, then it comes down to probabilities.
Feel free to ask me questions, comments or feedback :)
Thank you
Parallel Channel

Ascending Broadening Wedges V Parallel Channels Simply switch this LINKUSD chart between the log and linear scale to see an ascending broadening wedge turn into a parallel channel. A nice example of this perspective.

Trading parallel channel like Proin parallel channel there are two trend lines parallel to each other.
You buy/sell at trend line.
near the yellow arrow sign. you multiple resistance
trend line
fib retracement
previous support now turned into resistance
trade always have two part Entry and exit
you have multiple resistance to sell and you exit at 100% projection of wave at lower trend line of channel
this is perfect example : How you can trade using trend lines, fib retracement and extension, support and resistance.
(market doesn't give you this type trade everyday. so you have to wait which strategy is giving you signal to trade. if you wait you always spot this type of trade easily ).

How To Trade Channels?The above chart shows what is called a “channel” in trading. It is basically diagonal support and resistance (a.k.a Trend-lines). The area in between is known as a channel.
The red zone is said to be the perfect entry area for sells whereas the green is for buys.
How To Find The Zones?
Using the “Parallel Lines” tool, draw the diagonal S/R then measure the first candle/wick that starts the channel and that area is where you would get entries with the least possible drawdown.

DESCENDING CHANNELHere we have a nice example of a DESCENDING CHANNEL, which is a continuation pattern.
The take profit target was to 1 : 4.5 (450 pips), but you could extend it even to over 900 pips.
DON'T LET ANOTHER CHANNEL LIKE THIS UNTRADED ! ! !

ASCENDING CHANNELHere we have an example of an ASCENDIN CHANNEL.
Very good Risk To Reward (1:9 = 900+ pips).
DON'T LET AGAIN a trade opportunity like this ! ! !

BULLISH CHANNELAs you can see the market offers plenty of times 1 : 4.5 trades with over 450 pips each.
It's an easy pattern to spot and to trade.
GOOD LUCK THE NEXT TIME YOU WILL FACE A CHANNEL ! ! !

BEARISH CHANNELHere is an a example of a BEARISH CHANNEL.
Successful top to bottom was 200++ pips profit each time (4 opportunities).
Breakout was at 750 pips.
IT'S A NICE CHART PATTERN TO TRADE ! ! !

It's not a bird. It's not a plane! It's a channel.
Nobody really knows for sure why channels develop. There are loads of theories. I'm not interested.
A channel is usually discovered late, obviously because the channel is evolving and then you see it. Unbelievable as it is, it is there.
So what do you do. Well, I don't give advice. What I do is understand that there may be limited opportunity to exploit. I say limited because when late in the game, price can break up out of the channel or down out of the channel. That means that if price approaches either end of the channel, it is a critical time.
All one can do is take the loss! It's called a stop loss.
Channels also do strange things like break out and then go madly the other way. If everybody had a magic formula how to work them, everybody would be zillionaires. It ain' t happening!
But there is still money to be made by following microtrends. That's where you follow small trends from 3 min to 15 min. These can take days to play out.
For newcomers it's not a good idea to work blindly in a channel. Find other indicators to assist.
Experience is also an important thing. As I always say blowing up 10 Tradingview paper trading accounts is far better than blowing up one live account. Get the safe experience almost totally for FREE!

GBPJPYThe pair coul not break the suppport. we can expect a move to the upside to test the broken channel.

EURUSDWe were stop hunted from our previous trade. The analysis is still the same. You can check out the previous analysis to get a broader idea of where we are coming from.


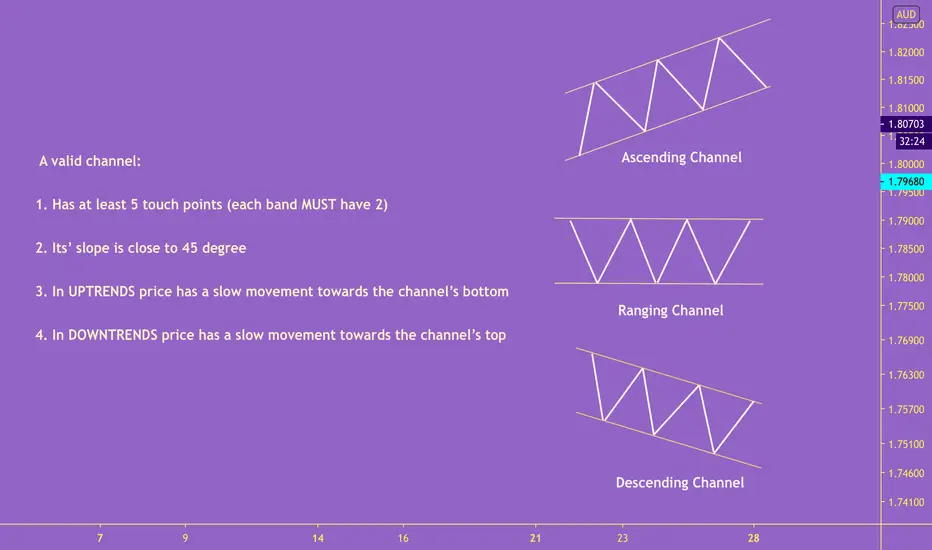
Some Tips about Channels you may didn’t knowChannels might seem simple but there are some points that help us to distinguish reliable channels from invalid ones.
The PitchFork - a great way to define and trade channelsThis is how I use pitchforks and I hope it is an inspiration for you too. I like trading channels and the pitchfork is a great way to identify them early on and to confirm these channels. It is not always straightforward to find the right points (1-2-3, see below), but I think the pitchfork is quite powerful and for me a handy tool in addition to other indicators and tools.
If you have not tried it before, give it a go!
Please leave your comments and thoughts so we can all learn and get inspired by each other!!!
************************************
HOW TO SET the PITCHFORK?
A Pitchfork can help identifying a channel in a fairly early stage. Three points need to be used:
1. a previous pre-channel high/low
2. the new channel high
3. the new channel low
If 2 is closer to 1 compared to 3 (vertically) then you will see a descending channel. Otherwise ascending.
Point 1 will become the mid-line of the channel and serves as an additional support/resistance
HOW TO DEFINE OPPORTUNITIES?
Opportunities exist when the price touches the boundaries.
#SELL - In this case we see 3 SELL opportunities when the price touches the upper bound
#LONG - we see 3 LONG opportunities, one of which (partly) failed as it got resisted by midline, which is not uncommon and always a watch out.
#BREAK OUT - We also see a clear break out that can be traded as well, especially after retest.
As always with channels - I prefer to only take LONG opportunities for ascending channels and SHORT for descending. This channel is fairly flat, so both were possible.
Always use this technique in conjunction with other signals.
**************************************

SOYBEAN Higher Time Frame Outlook on structureHello traders:
Looking at soybeans from the higher time frame perspective and its price action structures.
We see strong bearish impulse down from mid of 2018, and has been in this larger channel like structure ever since.
Price has been consolidating for these few years, and finally breaking to the top in the recent times.
What I like about the price from a structure point of view is that we just broke the previous top, but on the lower time frame the price broke up in a corrective structure.
I see this type of price action over and over again. Price breaks up, catching a lot of buyers, then see a strong sell momentum down.
I wouldn't be surprise to see some bearish impulse from the lower time frame, to bring the price right back into this larger channel structure, and we can potentially see the next bearish move from the top.
For now, happy to be a bit more patient, and wait for price to develop a bit more.
thank you

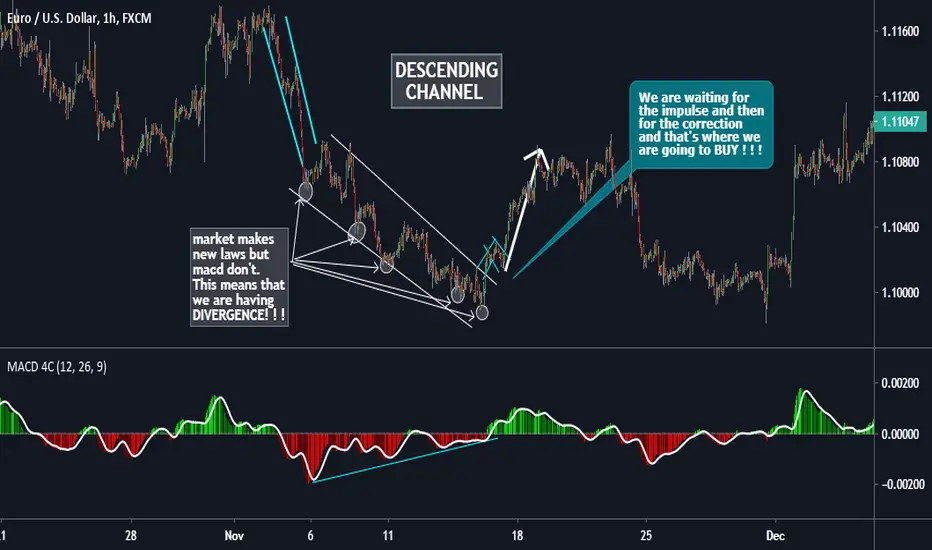
DESCENDING CHANNELThis is an example of descending channel
and I show you how to understand it with
the macd 4c indicator ! !
We are always looking for DIVERGENCE.
Market Structures Explained - Short and SimplePrice action moves in a particular Market Structure.
We have three types of Broad Market Structures.
1 - Breakout 2 - Channels 3- Trading Range
1 - Breakout
Every Trend starts with a Breakout. Every Trend ends with a Failed Breakout. Breakout is the Strongest type of Trend.
2 - Channels
Trend is contained in a Channel. Pullback in channels categorises it in the Tight or Broad Channel. Channel is the Weakest Trend. Small Pullback Channel is a Tight Channel Only Look to buy in it. Deep Pullbacks are Broad Channels. 2 sided trading is possible in Broad Channel. Breaout from Trend always evolves in Trading Range. Some Channels such as Wedge or Triangles evolves into Trend Reversal.
3 - Trading Range
Market is not trending. Bulls and Bear both are making money in this structure. They scalp not swing. Chances of Breakout are 50-50 in either direction. 80% of the breakouts will fail in Trading Range.
Buy Low and Sell High Should be followed.
Trend begins with a Breakout. Breakout weakens into Channel. Channel evolves into Trading Range. Now, Market decides which way to go. Probability of Trend Resumption and Reversal is same.
If you find this content useful then do tell me in the Comments.
Thanks-


USDJPY Selling Signal Patterns.Taking a look at the recent price action on USDJPY, we can see how the use of patterns and structure can be used to increase the probability for any potential trade setup.
As you can see from the 15 Minute chart, USDJPY was on the rise until it ran out of steam and started to trade into an ascending channel. This ascending channel completed a bearish (selling) 3 drive pattern at the highs which can indicate price exhaustion.
Once we saw this pattern complete and start to break down, we still don't look to enter the market until we locate a lower inner trend line to also break to the downside as this can help increase the strength of the pattern holding enough to extract pips from the market. Once the trend line breaks we can look to enter on the retest on the other side.
As we saw continued weakness in USD, we were given another opportunity to enter the market for a potential continuation play, this time in the form of a bearish head & shoulders pattern. Just like the 3 drive pattern we don't look to enter the head & shoulders until we see a lower inner trend line also break to the downside on the retest.
We would look to minimise our risk to the downside in both setups by placing a stop loss not to far above the 3rd drive high of the 3 drive pattern and just above the head of the head & shoulders pattern.

EURGBP Multi-Time Frame Analysis and Management Hi everyone:
Here is my multi-time frame analysis and management on EURGBP.
I do my analysis from a top down approach, from higher time frame down to the lower time frame for extra confluences and clarity.
Thank you

GBPJPY 4H 15M RABBIT TRAIL CHANNEL TRADING STRATEGY LONG TRADERule #1: Draw a channel on a 1 or 4 hour chart.
Rule #2 Identify If there is a Breakout on 1 hour or 4 hour chart.
Rule #3 Wait for a Pull Back on a 15 minute Chart.
Rule #4 After Pull Back on 15m, Make Entry.
Rule #5 Find a Stop Loss Placement.
Rule #6 Ride The Rabbit Trail to 50 pips with a TP Order!
Rule #1: Draw a channel on a 1 hour or 4 hour chart.
The first thing you need to do to get this strategy started off is you need to find a channel on a
four hour or one hour chart. Remember there must be two resistance and support points to
validate a channel.
This strategy can use many currency pairs. Make sure you search through all of them. Many say
that they “only trade EURUSD.” There is no reason for that..
Get in the charts and see for yourself! There are channels everywhere. This strategy will work
with any currency pair. The opportunities are endless..
Not too bad. So basically all you are doing here is drawing parallel lines on the tops and
bottoms of the price movement. This example hit a quite a few resistance and support levels
which means that when it breaks this channel it has the potential to make a huge move!
Rule #2 Identify If there is a Breakout on a 1 hour
chart.
The way you find the trade is to find a breakout of the channel that you drew on your chart..
In a perfect world the support and resistance levels will hold on forever..
But the world isn’t perfect..
So that’s why we have what is called a breakout.
This breakout happened on the top of the channel. So that means you will BUY.
If the breakout happens on the bottom of the channel then you will SELL.
Great! We have breakout candle let’s get in the trade and follow the rabbit trail to pip glory!
Rule #3 Wait for a Pull Back on a 15 minute Chart.
Why wait? Because the market is money grabbing machine, and they want your hard earned
cash!
You wait because sometimes the market does a “head fake” and turns against you.
So if you would have got in this trade right when it broke out of the channel you would soon
have got stopped out.
That is why it is so important to Wait for it to pull back.
This is where many people struggle. They see that it broke out so they want to click BUY or
SELL right now!!!
Think about the sayings you have heard since you were a child, “Patience is a Virtue,” Or “Good
things in life take Time”
Just be patient and wait…
This trade would not have burned you, but countless other trades would have!
Think about the pull back as the candle that closes towards the channel. So if the pull back is
above the channel you are looking for a bearish (red) candle. If the pull back is below the
channel you are looking for a bullish (green) candle.
*We only need one of these pull back candles on a 15 minute chart. Once this happens
move on to the next step.
Rule #4 After Pull Back, Make Entry.
We are getting so close to getting on our rabbit trail to make some serious pips!
Our lines are drawn, we identified the breakout, and waited for the pull back. It is now time to
make our trade.
The criteria to make an entry after a pull back on a 15 minute chart to enter a trade is that there
must be two 15-minute candles that support our trade.
If it is a BUY trade we want to see TWO bullish (up) candles after the pull back.
If it is a SELL trade we want to see TWO bearish (down) candles after the pull back.
Enter after the two bullish 15 minute candlesticks close.
So again, we WAIT for a pull back candle to close and then we need two BULLISH (green)
candles to close to many an entry.
Rule #5 Stop Loss Placement
This is probably one of the most important rules of the strategy.
You always need to place a stop loss somewhere for a reason. If you are throwing in stop
losses 5 to 10 pips from your entry order just because someone you read that somewhere, then
you are without a doubt treading some dangerous waters.
In a Buy The stop loss will be placed in the channel below the last support point.
In a SELL The stop loss will be placed in the channel above the last resistance point.
That way if it does come back in the Channel it will hit the support level and end up going back
up in a bullish movement.
Rule #6 Ride The Rabbit Trail to 50 pips!
The last thing you need to do is know when to exit the trade.
This strategy goes for a 50 pip target.
So when you make your entry, you calculate 50 pips take profit mark and place it.
The rabbit trail may be 2 hours, or could take as long as two days. You have your target so
really you have nothing else to do but sit back and watch your trade make you some money!
Stay in the trade and remember your rules. You are going for a 50 pip breakout trade!

The trend is your best friendWe have a descending chanel. the downtrend is strong. we ride with our best friend, the Trend.
This is not a trading advice. It is for educational purposes.
