AXISBANK LONG PARALLEL PATTERNHi,
Axis Bank stock chart..3 more parrallel channel found..
I separated all parallel lines..
we should check every parallel channel for break out...
IF 1 ST CHANNEL BREAK,, TAKE BUY ENTRY..
TARGET 682
STOP LOSS 295
WAIT FOR ENTRY...
Parallel Channel


Will bitcoin still dominate cryptocurrency?While bitcoin is trading very close to the APEX of previous ascending triangle that I've anticipated, we better to look at another factor that may affect the price movement of bitcoin. One of those factor is the bitcoin dominance.
Bitcoin dominance is still trending inside this up trend channel that has held the price since January 2018, a 2 years channel trend line. Currently the dominance is trending slightly above the 200 MA which could be the confirmation of breaks out to the upside. But, before talking further to the breaks out, we need to see the dominance to breaks out of the yellow region first.
After covering the upside movement, we must anticipate the downside movement too which is the breaking down of the lower line of the up trend channel which will leads the dominance into further downside movement.
From this perspective, I can see 2 correlation that is important for us to understand.
1. If the bitcoin dominance breaks out to the upside, there will be a money inflow in the bitcoin that cause the market capitalization gain bigger in the future which will cause a positive correlation to the price of bitcoin.
2. If the bitcoin dominance breaks to the lower line, there will be a money inflow to the altcoins market and the altcoins will potentially have an altcoin season. This is however very logical because the most of altcoins are trending at its historical low right now. During this scenario, we'll see the price of bitcoin has its sideway movement.

Bitcoin | Ascending Channel & EMA50..!!#BTC (Update)
Bitcoin Has been Moving Between 8.4k-10k Range from last 36 Days. (forming Ascending Channel)
At the Moment, holding the Channel Middle line (9.6k Support) & EMA50 (9464)
Now, there Are two Possible Scenarios..!!
- In Bearish Case, If Bulls lost the Support, It Might Retest the 8.8k Area Support.
- In Bullish Case, It Might test the Major Resistance (10k Area) Again, In Case of Rejection, There is a Possibility of Triple Top Formation 📉
Bitcoin CME Future Closed at 9800..!!
Expanding Triangle Formation..!!
According to Expanding Triangle, Big Move Ahead (Higher High or Lower Low)
In Weekly Chart. Bitcoin Facing Longterm Downtrend line...!!
In Weekly Candle Closed Below 9.6k or Trendline, Expecting Bearish Wave for Midterm.
In Case of Trendline Breakout, There is a Possibility of Bitcoin Bull Run in Coming Days..!!|
Waiting for Weekly Close 😎
Please like the idea for Support & Subscribe for More ideas like this and share your ideas and charts in Comments Section..!!
Thanks for Your Love & Support..!


🔰Channel is an element of technical analysis🔰
Let's recall my previous TA ideas and more 👇🏻👇🏻👇🏻
T oday we are talking about channels. Come on💪🏻
Technical analysis defines a “channel” as a corridor in which a price chart moves limited by the support line below and the resistance line above.
There are three types of channels:
📌bullish channel
📌bearish channel
📌sideway or range (flat, trendless)
The channel breaks, when the price breaks through either support or resistance.
Breaking resistance on the bull channel is a good signal to buy. For a bear channel the opposite is true.
With the side channel, the signal is less strong. If we break through support on the bullish channel and resistance on the bearish, we get a weak sell / buy signal (it is better to get confirmation from other indicators).
In addition, you can play inside the channel, observing two rules:
⭐the longer the price moves in the channel, the more likely it is to exit it;
⭐play better towards the main trend.
If you like my edu posts, put me like and subscribe on me💪🏻❤
Stay in touch💋
Your Rocket Bomb🚀💣


How to draw & interpret trendlines correctlyIn this video, I am going to show you how to draw & interpret trendlines correctly. You can apply this method in any timeframe and instruments such as forex, stocks, futures, bitcoins, bonds, etc…
In an uptrend,a trendline connecting two swing low and act as support, which is also called demand line. In a downtrend, a trendline connecting two swing highs and act as resistance, also called supply line. So, always buy near the support and sell near the resistance to have an edge in trading.
First, we need to define the timeframe we are trading. If we trade on daily chart, we can draw trendline in the daily timeframe. If we we use to trade in H1 timeframe, draw the trendline in the H1 timeframe.
One important thing is that once the trend line is violated, we need to adjust the trendline accordingly to fit as many swing low/high as possible.
A break out from the trendline means there is a change of the pace in the trend. We can look at the trendline as a gradient. A steeper trendline means the price travel at faster pace than a less steep trendline.

NZDUSD Aloha, welcome to the new week!
Wanted to share a tip that has helped me save money and kept my psychology sane:
Let the market develop for the first few hours before placing a trade. Reason being is spreads are usually steep and the market can be volatile and choppy.
NZDUSD was on my watch at the end of last week and my last analysis shows that I would be going long on this trade, however, applying a the rule of "let the market decide in the first 4-5 hours", minimum, has saved me from a quick loss of -1% on this trade and countless others trades.
I like the 15min wedge for a continuation, the 50ema on 4hr, 1hr, and 15min all support my thoughs of going long. However, The daily is stil developing to either break above the 50 or reject it and have a
crash.
Any way, hope this in your trading journey!
Stay patient and wait for your strategy to play out, no need to rush it! Mahalo for reading, happy trading all!

Support And Resistance – The House! EICHERMOTOR.----------------------------------Support And Resistance – The House!----------------------------------
Support and Resistance explanation:
Imagine that you are looking at a vertical cross-section of an "Old fashioned dolls house " which is shown in the schematic. Now you can see all the floors and ceilings in the house, and as you can see here we have a ground floor, first floor, second floor, and roof.
The market then moves lower, having reversed, back to the floor, where it consolidates.
The concept of Support and resistance is important for a number of reasons.
--> First, as we have already seen, a breakout from a consolidation phase can be validated with volume , and if confirmed, provides excellent trading opportunities . The so-called breakout trade s.
It is a WIN/WIN. You have the comfort of knowing that once the market has broken through a ceiling of price resistance, not only does this become a floor of price support, it has also become a barrier of price protection in the event of any short term re-test of this area. Any stop loss, for example, could then be placed in the lower regions of the price congestion. This is why breakout trading is so popular.

Bitcoin | Big Move Ahead..!!BTC/USD (Update)
In Daily Chart, BTC volume has been Decreasing since 12th March Crash, that Means Big Move Ahead.
At the Moment, It's Been Moving Btw Major Support (6.6-6.8k) & Key Resistance (7.4k)
If Bulls Cleared the Resistance (7375) then Bitcoin Might Jump towards 8.8k Area in Coming Days.
If Bulls Lost the Major Support Area then We Could See Another Crash in Coming Days (Target Will be 5.2-5.4k Area)
In 8h Chart, EMA200 (7332) & EMA100 (6950) Both Are Play Important Rule As Key Support & Resistance Level.
At the moment, Bulls holding the EMA100 (Support) & Pushing the Bitcoin price towards EMA200 (Resistance)
Now If Bulls Cleared the EMA200 (Resistance) & Weekly Candle Close Above it then Bitcoin Might PUMP Hard in Coming days (We Could See HALVING FOMO)
If Bitcoin Bulls Failed to Hold EMA100 (Support) Then It Might Retest the 6.4-6,6k Area Again.
BTW Bitcoin Bulls Already Broke the Bullish Flag & Now Forming Another tiny Bullish Flag .
In Case of Bullish Move, Target Will be Between 7340-7380 ( CME gap Area)
Outline : At the Moment, I'm Bullish on BTC & It Might Test the 7340-7380 Area, & Also Waiting for Weekly Closing, It Will be Important for Halving FOMO.
Please like the idea for Support & Subscribe for More ideas like this and share your ideas and charts in Comments Section..!!
Thanks for Your Love & Support..!

GBPAUD 1H SCOTT BARKLEY "TRADE OF THE WEEK"THIS IS NOT A TRADE SIGNAL - All trade ideas are for educational purposes only,


BITCOIN | Ascending Channel & EMA100 Resistance..!!BTC/USD (Update)
Bitcoin Has been Moving Inside the Ascending Channel & Facing EMA100 In 8h Chart.
Now There Are Two Possible Scenarios!!
1- If Bulls Lost the MA50 & Channel Broken down, then It Might Crash Hard towards 4.8k Support.
2- if Bulls Clear the EMA100, then It Might Test 8k Area. (Major Resistance)
Please like the idea for Support & subscribe for More ideas like this and share your ideas and charts in Comments Section..!!
Thanks for Your Love & Support..!

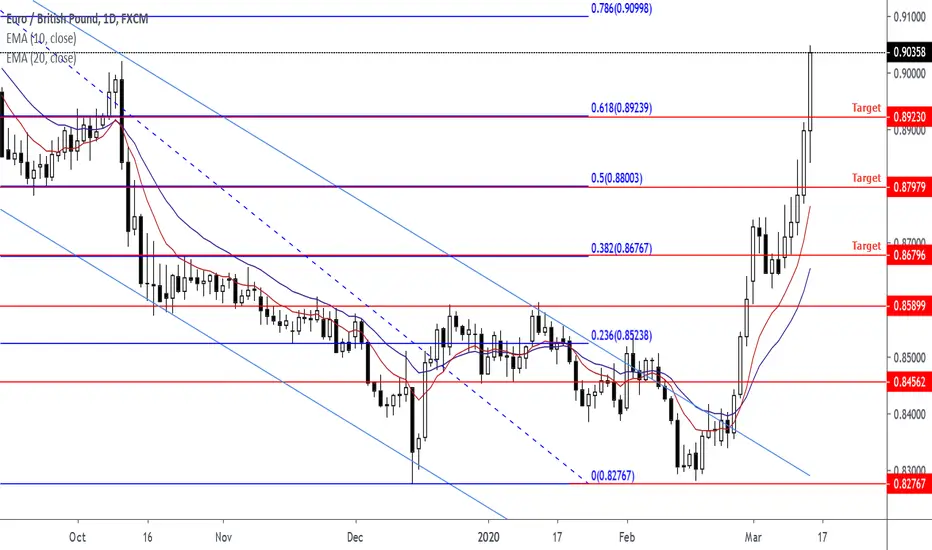
EURGBP 2020/03/15 Parallel Channel and Fibonacci LevelEURGBP Parallel Channel and Fibonacci Trade Idea From 2020/01/31. Price hit three targets.
ZECUSD Trade Idea | 2020/02/23 | Target Price 43.27349884ZECUSD Parallel Channel. Trade Idea From 2020 February 23

Technical Analysis Education - Simple TA on Weekly Chart - XJOTechnical Analysis Education:
ASX200 (ASX - XJO) Weekly Chart
For those of you out there who are new to trading, I like to keep my TA simple and clean. I also like to look at the bigger picture to understand what's happening right now. There can be a lot of confusion when an event such as a market crash happens. We can be reactive and emotional, which is normal, but not helpful.
See below the #XJO which tracks the ASX200. On the weekly charts its a clean upward channel, going through from the end of the GFC to now. Strong bullish trend with healthy pullbacks (corrections) You will note that the points value moves within this channel, bouncing as it goes.
Some points to note on the chart:
1. We are still in a #bullish market trend on the weekly timeframe (exclude the smaller time frames)
2. We haven't broken any major support levels.
3. We can expect to keep falling at least another 6% to said support.
4. We are still within the key #fibonacci levels of 38.2, 50 and 61.8. These are healthy retracement levels.
When to be concerned?
If we broke through our trend lines and fell below 5,800 points, we could potentially fall to 5,000 points or lower.
Make sure to look at the big picture!
Hope this helps

NZDJPY Parallel Channel 2020/03/03NZDJPY Parallel Channel Trade Ideas From 2020/01/31 and 2020/02/25


