Draw perfect channelsDraw perfect channels using a quick hack.
1. Draw at least one level connecting two highs or lows that are of importance
2. Press and hold control and click and drag with your mouse
3. Now you're an expert channel drawer :)
Don't invest what you can't afford to lose. This is not investment advice. Subjective view/report of a financial product only.
You can learn price action trading at no cost. Join my mailing list to receive more information zc.vg
DISCLAIMER
All information published within this website is purely for educational purposes and offers no guarantees. Profit Fx, Forex Bootcamp and any of its associates cannot be held responsible for any trades that you have executed in any way whatsoever. Please familiarize yourself with the relevant risks involved when trading forex, CFD’s and other products. Any trading is done solely at your own risk. Profit Fx, Forex Bootcamp and any of its associates are in no way employed by any broker or any other legal entity. All information published within this website does not constitute advice, but rather objective information about a financial product and analysis or report of a financial product.
Parallel Channel

Elliott Wave Theory and Fibonacci This chart correponds to the example commented in our educational article "Elliott Wave Theory and Fibonacci ."

Possible 30% gain on this altcoinsHello Fellas, Today is a very interesting day when we see at the market . it is all because I saw a lot of buy signals from altcoins which could lead them into a huge bullish run in the next few days.
First of all, if we look at the 4 hours chart, we can easily find an ascending triangle has been formed which usually could lead the price to go up. Beside that, I've seen a possible 5th wave is going to be formed in near future.
Because I often see a truncated 5th wave which usually lead us to the double top pattern, I will be waiting for the break out confirmation of this 4 hours pattern. and enter long position from here.
My 1st target will be between 19700 - 20000 which act as previous swing high of current pattern. My highest target for mid term is around the 25000 which is 30% up from current price. However, between 20000 - 25000, I see a lot of significant resistance is ready to fight the price back, that's why I will give you a breakdown update for those resistance ahead.
Thank you.

USDSGD 10.24RUSDSGD 10.24R Parallel Channel Support Resistance
Enter on the Retest of the Horizontal Support Resistance Line. Exit at the next Horizontal Support Resistance Line.

USDSGD Exit 1.37211USDSGD
Entry 1: 1.38463
Entry 2: 1.38063
Exit: 1.37211
-----------------------------------------------------
First Entry: 6.18R
Second Entry: 4.06R
Total 10.24R

Impulsive Waves Construction - Part 2 (03)The following chart corresponds to the third chart of our article "Motive Waves Construction - Part 2".

Impulsive Waves Construction - Part 2 (02)The following chart corresponds to the second chart of our article "Motive Waves Construction - Part 2".

Impulsive Waves Construction - Part 2 (01)The following chart corresponds to our article "Impulsive Waves Construction - Part 2".

gbpnzd pattern tutorialprice action is all about pattern repetition here u will c same structure not so long ago now it repeating if u hopping to buy wait fo break up then buy

EURUSD 4.29R 154.3 PipsHorizontal Support Resistance, Diagonal Support Resistant (Parallel Channel), Dynamic Support Resistance (EMA 10 EMA 20), Pin Bar.
Enter at Horizontal Level
Exit at Horizontal Level
Enter at 50% Retracement of Pinbar. 50.0 Fibonacci Retracement Level.
Exit at Horizontal Level of the Equidistant Channel. (Target 1)
Exit at the Measured Move Measured Objective of the Flag Pattern. (Target 2)

Signature of perfectionist buyers to trade a small reboundFor those who still wonder by what miracle chart analysis can work well, here's a proof:
Such proofs, I often see and they are an integral part of my publications, but I had not yet had the idea to dedicate a small Tutorial, and this proof is perfect for its simplicity and its obvious!
It is simply a question of proving that Chartism is neither a science nor divination or pure chance.
In technical analysis , there is especially a strong psychological dimension to study, interpret, and try to anticipate or at least use to his advantage.
This proof is an ascending channel that is anything but the product of hazard: a whale (market maker) or a set of individuals (I did not check the order book because it doesn't matter) traced a bullish trend resistant between the two recent peaks as you can see in white on my graph, then reported a parallel (you have the dedicated tool "Parallel Channel" to do the same in Tradingview), adjusted on the bottom of my graph: and he has (they have) placed their (their) purchase order very exactly on this parallel during the dump of the Rising Wedge of my previous publication (here in dashed for reminder), which also coincides with the expected target of this pattern of reversal (return bearish to the base of the wedge ).
The perfection of the pattern with this rebound leaves no room for doubt: it was not the result of chance, which gave the opportunity to anticipate and enjoy it with the interesting probability that there is a greater number of Long trades on the same simple track as on a direct continuation of the dump without rebound.

NZDCAD Entry Near The Price Level 0.87333 NZDCAD Parallel Channel
Action Steps:
Draw Support Resistance Line
Wait for the Market to Break and Retest Support Resistance Line


Ascending ChannelAn ascending channel is an uptrend that moves between very accurate limits. It can be confined in two parallel lines from which the one is the trend line support and the other acts like a resistance.
How to trade ascending channels?
Enter short when point reaches resistance, and long when price reaches support. The stop loss should be above the upper line when short selling and the profit target should be the lower line.
How to draw Ascending Channel?
To create an up (ascending) channel, simply draw a parallel line at the same angle as an uptrend line and then move that line to position where it touches the most recent peak.

Exceptional speculation from mid April '18 onwardsUsing an updated chart of earlier posted opportunity around AUDUSD (AU) I like to highlight and illustrate the exceptional speculation that has been going on since mid April onwards. The first and many incidence of the same speculation has often seen coming in very sudden which indicates a single source instead of graduate forming of buying/selling pressure you see normally when larger long term trends are forming.
Only news events cause such sudden incoming interest in the buying or selling of an asset when it's coming from a group, but then there have to be a profound reason for it been in the news and it always dies out within a few hours. Quite often we have seen USD buying surges since mid April not complying with any of these rules on top of that these volumes were sometimes hidden from public pools and planned very timely to exactly block a USD bearish cycle from bringing down the value of USD or a potential opposite interest such as London open.
The latter is just too silly to observe, suddenly on Tuesday morning Asia timezone when there are normally low volumes until one hour before London open, there would be a ridiculous sudden surge of GU and EU selling at a time it was never seen before. There is simply also no reasonable explanation for anybody selling GU and EU at that time other to stopping GBP and EUR from being appreciated.
Nobody says a word and nobody writes about it since that I have noticed these out of place events. There are some economists speaking in youtube videos but searching for manipulation of USD returns litle results on Google and first few entries are about China manipulating their currency and Google's very nice suggestion list doesn't show a single entry when typing it out into the search field. Well, everybody knows that every single central bank is doing it, all of them. They call it market operations and it published on their websites. Look at the implementation notes published by the FED May this year or read on about RBA market operations published clear in public, just to name two examples but all central banks list it as normal operational tasks as part of their portfolio of services.
Yet search seems to return limited results, making everyone believe very few people are interested in this business. Something so important as a ring-network of almighty controllers manipulating the financial market on a daily basis and nobody would be interested. That doesn't glue very well with me, censored it is, big time, for only one reason, this network of market operators have a lot to hide. More than they trying to let the everyone believe with their website publications.
The dangers are that like this year the speculators are all making to believe the sudden interest is genuine, just to grow a large group of supporters because the FED know it can't beat macroeconomic cycles. At one the these will overpower the built up speculative forces against the macros over 6 months and that contr force will be stronger than ever seen on the market and speculators will realise that at one point in time and start selling on top of the macro selling pressure. That combined could give us the strongest ever seen sling back down from high up reaching far below it normally would go, the so called overshoot could reach the opposite side of the market at USDJPY 67...

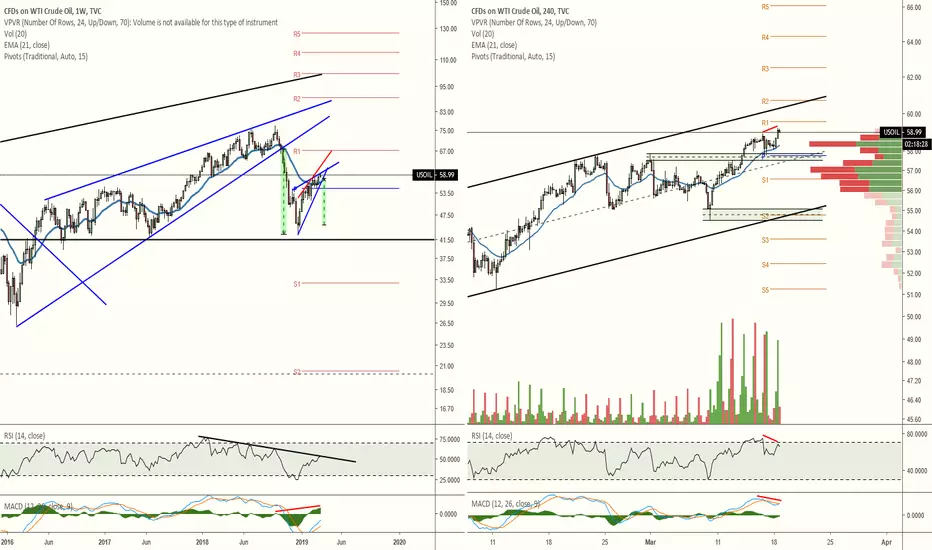
USOIL headed downWeekly chart shows price nearing the apex of the ascending wedge with a target of $45. RSI is hitting resistance and MACD's histogram is possibly printing hidden bearish divergence.
H4 chart shows RSI, and possibly MACD, printing bearish divergence. The nearby demand has already been tapped once making it much easier for the next drop into it to potentially fall further. I would watch for the demand below that at around $55 to provide some support. It also aligns with the ascending channel's support. If that support cannot hold then, based on the height of the ascending channel, we should be looking at $49.70/$50 for the next likely support. That target is a mere $5 away from the weekly breakdown target.