Parallel Channel


Bitcoin Space Launch - a basic EMA pictorial (Bull Run to 9k)Use snapshot link below if the text and objects are overlapping. Sorry, I'm still learning how to publish content. Tips and suggestions welcome!
What is this?
Quickly learn some basics on EMAs (Exponential Moving Averages). Right.. the E does NOT stand for "Emotional"... However, if your are trading too often without making gains, then you may need to learn about those too! Also, don't get upset with me if BTC crashes tomorrow...
Which reminds me to inform you that... I am not a professional, but I do invest responsibly and believe that you should too! Please do you own research! (DYOR)
If you dig this pictorial or the full history chart of BTCUSD, then please give a Like! Also, I believe you can "make it yours" for future reference by click on the share button and selecting "Make it yours".
Thanks and enjoy your trades!


Elliot wave count update and Bias on long termHello fellas, welcome back to the Sunday update of bitcoin, Just like usual we will explain the chart work about bitcoin and its long term and short term bias. Here in this post, I'll do an elliot wave count in specific.
Looking at the above chart, we can see that there are still a possibility for bitcoin to head up to the upside of the huge down trend channel which I can classified it as the b wave for potential Z wave in higher degree. Although there might be a potential to the upside movement and try to retest the upper line of the channel, I still believe that there are 1 more wave down to the area of confluence support to complete the Z wave.
There are 2 areas of resistance that is becoming my main concern which are at the 38.2 fib retracement which has confluence with the $8000 region as support and the golden pocket zone which has a confluence with the upper line of the downtrend channel.
For short term, there is still potential to push to the upside and for long term, I still see a potential of touching the $5000 region.


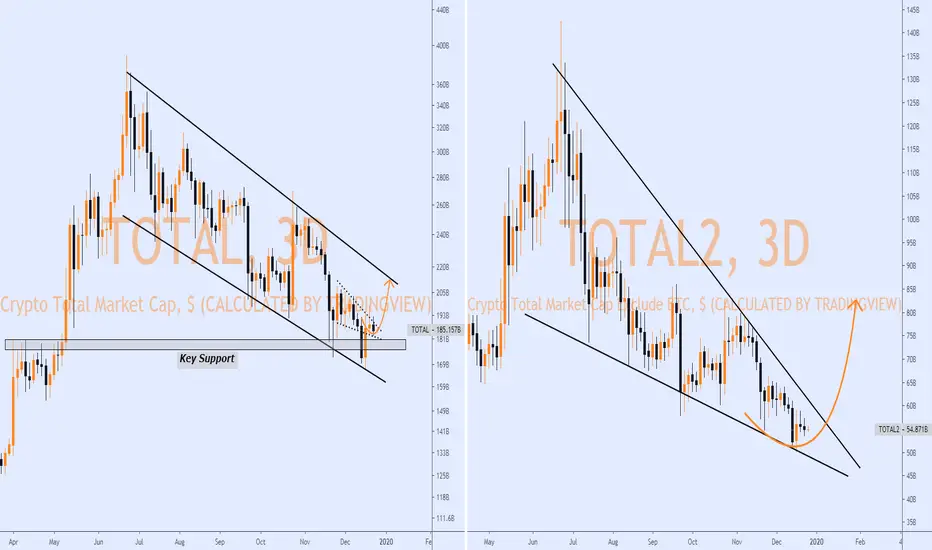
Crypto MarketCap Analysis..!!- Total MarketCap
Holding the Key Support in 3d Chart & Just Like Bitcoin, It's Also Forming Descending Channel.
If Bitcoin Price Jump from 7k Support then Total MarketCap will Automatically Grow & Follow the BTCUSD.
- ALTS_MarketCap
On the Other Hand, ALTS MarketCap is Forming Bullish Wedge Pattern in Bigger Time frames & I Think Q1 2020 Will be Bullish Year For ALTS too.
ALTS Need Some Strong Volume For Wedge Breakout & Growth.
- Bitcoin Dominance
On The Other Hand, Bitcoin Dominance is Also Increasing after Wedge Breakout & Now Holding the Key Support, (70%)
If Support Broken Then We Could See Some Growth in ALTS in Coming Days,
Some Bitcoin Updates..!!
Please like, subscribe and share your ideas and charts with the community!
DOUBLE BOTTOM PATTERN, How to trade it...DOUBLE BOTTOM
It is a reversal pattern and it forms in a Downtrend
It consists of a lower low followed by a point that is unable to make a lower low, after that price will start
making higher lows instead of lower lows.
This is a sign that the down move is over and price has the potential to reverse to the upside.
HOW TO TRADE IT:
This pattern usually occurs after price form a descending channel, we wait for a breakout of the descending trendline as well as the resistance level that will become future support and then we wait for a bullish corrective structure such as ''Flag/Wedge/Triangle'' to buy on a breakout.
*Thankyou for reading*


CHFJPY Trade Opportunities Look For Buy Opportunities Above 110.210. Look For Sell Opportunities Below 110.048.


LevelsHello fellas, Happy Saturday and I hope this can be a nice weekend for all of you. Today's update is always about bitcoin and this will always be a significant update as the analysis for the next 7 days ahead. I hope this analysis still can give us a nice horoscope for the next few days, just like what I've always did! So, Enjoy!
Looking at the daily perspective of the bitcoin's price, we can see that the down trend channel that has held the price since June 26th, 2019 as the initial corrective phase of bitcoin is remain valid and still hold true. At November 25th, we can see the price bounced right after it touched the lower line of the channel which act as a strong support so far.
Right now, the price has came close to the median line of the channel which is acting as a strong support too. we might see an action at this region whether it is going to break it out or getting rejected from it. If we see a break out action, we might see the price to reach out $8800 as the shadow support before it pushes further to the upper line of the channel as the next strong resistance ahead. But, if the price get rejected at the yellow zone, we might see the price to push further low to $6600 or even $5500 region.
It's just a matter of time, we might see the price to push further to the lower region of $5500 as it's almost impossible for bitcoin to breaks the upper line of the channel which is huge for now. with current condition, A lot of uncertainty in the market, Huge adoption this year, But low levels of confidence? It is certainly the longer recession is coming.


EURSEK 2.93 R-MultipleEURSEK Reward:Risk = 2.93R
Stop Loss: 286.6 Pips
Target: 838.5 Pips
Entry at price level: 10.64975
Note: Price Level 10.64975 was retested and EURSEK continued into its intended direction.
Note: Price Level 10.60763 was broken and retested. Entry comes in at the retest of level 10.60763. Target is the next horizontal support resistance level at price 10.56657.

Elliott Wave Channeling and Parametric Model of an Ideal TrendChanneling is the single most important technique that you must know in trading.
Channeling:
- can be used 100% of the time in all market conditions for both impulses and corrections. Price always travels in a channel until it breaks
- there's never a single channel - there are always multiple nested channels and by breaking/bouncing off of their boundaries price travels between channels
- the game is always to short/long main channel boundaries in a range or play breakouts
- lets you know where exactly where the trend breaks and new trend or correction begins regardless of wave structure
- helps with identifying the optimal hierarchy of nested waves, which waves are continuation of other waves, eliminates almost all of the wave count related guesswork.
- breaking of a smaller channel can signal a break of a larger one well in advance - use as confirmation
On a chart there are 3 channels: blue, green, red.
Using channeling with Elliott Waves:
- blue (base) channel connects 012 points/wicks and tells you where wave 3 ends (blue dot intersecting the channel boundary), otherwise this is not wave 3
- green channel connects 123 points/wicks and tells you where wave 4 ends (green dot intersecting the channel boundary)
- red channel connects 234 points/wicks and tells you where wave 5 ends (red dot intersecting the channel boundary)
- use fib price and time wave relationships to calculate price and time based wave targets
The same method can be used in general regardless of wave structure - you must always connect 3 last pivots and draw a channel (2 in one dir, 1 in the opposite dir).
Continue drawing new channels with each new pivot - soon you will get an idea of how price travels and why it bounces at certain points - boundaries of prev channels.
- In a bull market you wait for any 3 waves down and buy. In a bear market you wait for any 3 waves up and sell. Waves can have multiple subwaves inside - you don't need to worry about that. Keep an eye on the main channel boundaries only. 1 wave = 1 channel - makes it easy to count them. Smaller channels appear inside larger ones - these are your nested subwaves.
- If the main trend direction is unknown - don't trade or trade the range inside the channel with only small positions.
- you can also use Modified Schiff Pitchfork with stddev warning lines - it's basically a channel with side sub channels
- the last wave of a move (wave 5, C, Y, E) can end near the channel's median line or at its boundary, overshoot or undershoot it. At some times it's best to exit, other times - to enter at this points.
- when wave 4 ends inside a channel, doesn't break it - buy, don't sell.
- when wave 4 is near the middle line of the channel - this is just the first leg of the correction
- breaking the channel only tells you that the current wave has likely ended. It can break out, correct and reverse, get back into the channel and continue the trend
- breaking the channel doesn't necessarily mean end of a particular wave, it can be the first leg of a correction that has already started inside the channel from the last pivot or even 1 pivot back
- use pitchfork warning lines (stddev), breaking a series of channels (starting from smaller and cascading to larger one), breaking the last known trend pivot and high volume to confirm trend change.
Also watch these videos:
Must see - channeling elliott wave impulses, using price time fib relationships
www.youtube.com
www.youtube.com
the mechanics of WXY double zigzag and combo corrections
www.youtube.com
triangles and exp flats
www.youtube.com
______________________________________________
Parametric Model of an Ideal Trend
1) slope:
wave 1 slope = 71 degrees
wave 3 slope < wave 1 slope
wave 5 slope < wave 1 slope
2) price:
wave 2 = 50% of wave 1
wave 3 = 1.618 of wave 1
wave 4 = 38.2% of wave 3
wave 5 = 100% of wave 1
wave 4 splits waves 0-5 at 38.2%
3) time:
wave 2 time = 100% of wave 1 time
wave 3 time = 1.618 of wave 1 time
wave 4 time = 1.618 of wave 1 time
wave 5 time = 100% of wave 1 time
wave 3 end time is usually 100% or 161.8% wave 1 time or 61.8%, 100, 161.8% or 261.8% of wave 1 + 2 time
wave 4 end time = at least 100% of wave 2 time or 100%, 161.8% or 261.8% of wave 3 time or 61.8% or 100% of wave 1-3 time
wave 3 end time is also 38.2%, 50 or 61.8% of the entire wave 0-5 impulse cycle time
usually either fib price or fib time is respected in waves 1-4 - whichever comes first, you can have a series of boxes for certain price-time combinations as targets.
in an extended wave 5 both price and time fib relationships are usually respected, other waves may not respect both time/price
4) volume
wave 3 has the highest volume
5) divergence
wave 5 has divergence on RSI, EWO
6) structure
waves 1,3,5 - 5-wave impulses
wave 2 = zigzag
wave 4 = triangle or flat
if end of wave 3 vol bar >= subwave 3 volume bar i.e. volume increases => wave 5 will be extended, otherwise wave 5 will be normal short wave, not extended
either end of wave 3 bar (followed by a normal wave 5) or end of extended wave 5 bar have the biggest volume in the whole move
in an extended wave 5
- wave 5 end can be 61.8, 100%, 161.8% of wave 0-3 => wave 5 end can be projected
- subwave 4 divides the whole wave 0-5 move:
at 38.2%,50% (61.8% only for normal wave 5) => wave 5 end can be projected
in normal wave 5
- wave 5 end can be 61.8, 100% of wave 0-3
- subwave 4 divides the whole wave 0-5 move: 78.6% or 61.8% or 50% of entire wave 0-5 impulse cycle price/height (78.6 up from wave 0)
P. S. This is the Way


USDJPY Longer-Term View with Regression Trend ToolI have added in another regression trend channel going back to the late 2016 high. That longer-term channel shows the potential upside target for a breakout above the medium-term channel if that were to occur.
At this particular juncture, the medium and short-term channels are the ones in play, with a potential or bounce or break of the short-term channel on the radar right now.
This is a follow-up post. See related ideas for the original.
Use the tool if you like it, discard if it doesn't help you.

GBPUSD – Buyers momentum reaction from the channelGBPUSD – Buyers momentum reaction from the channel
Trend: Buy/ Neutral
Support/Resistance:
R2: 1.29929
R1: 1.28974
S1: 1.28378
S2: 1.27548
Price action:
Buyers were very strong from news announcement, but the problem is because we have small gap downside. We might reach channel next touch but be aware of the gap and market behaviour like we are teaching in our elite course.
Potencial trade idea:
Bulls targets:
T1: 1.28974
T2: 1.29929
Bears targets:
T1: 1.27548
NOTE – We are trading GBPUSD via the preferred trading setups
Disclamer1: We have to wait for a currency pair to trade after news are reliased. This might be a short correction, or price will give us moving dirrection after news are reliased.
Disclaimer2: Martin's views on the Chart analysis is ment as a trading advice for education terms; Education terms include: trading consistency to everyone who is reading this blog; for every advance student and for every Elite student who is using this analysis for managing his equity by Elite strategy and custom indicator. This analysis is understandable and transparent for all Elite students. This is a free content which is based from Academy in term of transparency to support and following progress to everyone. We know that there is always possible way that market can pull you out even when you follow our analysis blog and advice for a trade. We don't publish where you have to have your risk management – Stop Loss, because, it would not be fair to Elite members, who learned this techniques in our Elite course.
ELITEFXACADEMY

Bitcoin : Shadow support and short term view.Hello all, welcome to the Saturday update of current bitcoin condition after yesterday's drop. Currently, After the drop we can see that the price is entering a shadow support (the yellow region). The shadow support itself is the area where the previous period's bull trap or the wick fishing region located.
So, here is my view in the short term, we can see that the price has touched the yellow region and there is a possible consolidation to occur at this area. I do believe we can see the price to have 1 more drop to the next strong support which has confluence zone with the golden pocket region. After that, we can see the price to touch the previous broken support that is now acting as a resistance as well around $9000 region.
From the daily perspective region, we can see that the MACD histogram is having the first ticking down to the negative side and the bearish action has completed with the confirmation of the death cross on moving average in the MACD.
However, $8500 will become a very strong support and there is a very good region to accumulate the long order.

