Closer look into Rising/Falling Wedge, Reversal Price Action
Closer look into Rising/Falling Wedge, Reversal Price Action structures/patterns
Hi traders:
Today I will go more in detail on rising/falling wedge correction in price action structures/patterns.
You might have already heard about these types of correctional structures, and many traders who utilize them.
Certainly there are many ways of traders identifying them and taking advantage of these kinds of price action, so it's ideal for you to understand them in your analysis.
We first need to understand that a rising/falling wedge is a REVERSAL price action. Meaning when the correction completes, there's a higher probability of the price to reverse.
You might have already seen multiple price action videos from me that go over all sorts of continuation and reversal price action (I will share links below),
and I always talk about when combining multiples of different price action structures/patterns will give you a better edge at entering positions that work out in your favor.
Same idea here, so let's take a look at how rising/falling wedges are, how to identify them, and how to effectively use them in your analysis.
Rising/falling wedge, just as the name suggests, is an ascending/descending type of correction where the price is getting squeezed into a “wedge”.
As the price gets narrower and narrower, there's a higher probability of the price to “reverse” from the wedge.
Now about entries, certainly many traders have their own method of entering, so I will share my point of view and the way how I like to enter them.
Any questions, comments or feedback welcome to let me know :)
Thank you
Risk Management: 3 different entries on how to enter the impulsive phrase of price action
Multi-time frame analysis
Identify a correction for the next impulse move in price action analysis
Continuation and Reversal Correction
Continuation Bull/Bear Flag
Parallel Channel (Horizontal, Ascending, Descending)
Reversal Ascending/Descending Channel
Reversal Double Top/Bottom
Reversal Head & Shoulder Pattern
Reversal “M” and “W” style pattern
Reversal Impulse Price Action
Continuation/Reversal Expanding Structure/Pattern
Risk Management

Video How to Set the PERFECT Target Every Time (yeah, right...) Educational video on the different approaches to setting targets & the importance of having a certain mindset when looking to take profits

TYPES OF TRADING ORDERS AND HOW TO USE THEMPending orders
Somewhere you can find the term as "Deferred orders".
These are orders that will be filled in the future, once a certain condition is met.
Most often this condition is reaching a certain market price.
The most popular pending orders are Stop and Limit!
Both types of orders become market orders when the initially set price is reached.
The difference between them is that Stop Orders can be activated at a worse price than the set price, depending on market conditions.
Limit orders cannot be activated at a price lower than the set price, the price must be either equal to the set price or even more advantageous.
Depending on the purposes of the trade, different deferred orders are used.
A breakout of a level is traded with a Stop order
A pullback from a level is traded with Limit order.
The types of Pending Orders are:
Buy Limit;
Sell Limit;
Buy Stop;
Sell Stop;
OTO;
OCO;
and other.
Market order
This is an order where you enter a trade, regardless of buy or sell, which is executed at the current best price.
For example, if you want to buy GBP/USD, you click directly on the corresponding button and the trading platform automatically places the deal on the market.
When you click on the "Sell" or "Buy" button, you actually place a market order.
Keep in mind that depending on market conditions, there may be some difference between the price you see and the price at which the order will be executed.
Stop Forex orders - Buy Stop and Sell Stop
The Stop orders to enter a deal are different from the Stop Loss order to limit the loss!
Buy Stop order is used when you want to buy at a level higher than the current market price.
It is placed higher than the level at which the price is currently.
Sell Stop order is used when you want to sell at a level lower than the current market price.
It is set lower than the current price level.
For example, EUR/USD is currently trading at a price of 1.1860, you think that if it reaches a price of 1.1960 it will continue to move in an uptrend.
In this situation you have two options:
To sit in front of the screen waiting for price to reach 1,1960 so you can buy, or;
To place a Buy Stop order at the 1,1960 level.
However, if you think that the price will fall in the coming periods, instead of staying at the computer and wait for a convenient time to sell, you can place a Sell Stop order at a level lower than the current market price - on the chart 1.1760.
Limit Forex orders / Buy limit and Sell Limit
Buy Limit order is used when you want to buy at a level lower than the current market price.
It is set lower than the current price level.
Sell Limit order is used when you want to sell at a level higher than the current market price.
It is placed higher than the level at which the price is currently.
For example, EUR/USD is currently trading at a price of 1.1860, you think that if it reaches a price of 1.1960 it will bounce off the level and go into a downtrend.
In this situation you have two options:
To sit in front of the screen waiting for price to reach 1,1960 so you can sell, or;
To place a Sell Limit order at the 1,1960 level.
However, if you think that the price will fall in the following periods and then rise, instead of you sitting at the computer and wait for a convenient time to buy, you can place an order to buy a limit below the current market price - on chart 1,1760.
Above is a summary chart of the orders and where they are placed.
Let’s summarise:
Buy Limit - pending buy order placed at a price lower than the current one;
Buy Stop - pending buy order placed at a price higher than the current one;
Sell Limit - pending sell order placed at a price higher than the current one;
Sell Stop - pending sale order placed at a price higher than the current one;
OCO orders / One Cancels The Other
The OCO order is a combination of two orders to enter into a trade.
One order is placed above the current market price and the other below the current market price.
When one of the orders is reached, it is executed and the other one is automatically deleted from the trading platform.
For example, EUR/USD is currently trading at 1.1850.
You expect great volatility in the market and you do not want to miss the movement.
In this case you place an OCO Forex order at the level of 1.1880 (above the market price) in anticipation of an upside move and at the level of 1.1820 (below the market price) in case the price goes down.
When the market reaches 1.1880, you will buy EUR/USD at this level, and the order placed at 1.1820 will be deleted from the trading platform.
OTO orders / One Triggers The Other
OTO allows the trader to place two orders simultaneously, the second one being activated after the first one.
This type of order allows many different combinations.
For example, a buy order can be placed at a pre-set price, above the current one (Buy Stop) and a second order can be placed together with it to limit the loss from the buy order, in case the price goes in the opposite direction.
In this case, the loss limit order will only be activated if the buy order is activated.
The orders described so far are for entering into a trade, but you must also exit the trades.
This is done by using “Stop Loss” and “Take Profit”.
Trailing stop
Trailing stop is an order to limit the loss, which moves along with the market price.
It can be said that this is a moving Stop Loss.
And here is how to do it!
Suppose you want to buy GBP/USD at a price of 1.2820.
You place a trailing stop at a distance of 20 pips at a price of 1.2800.
When the price goes in your direction and reaches the level of 1.2840, then the trailing stop will move by 20 pips or at the level of the entrance to the transaction.
Then if the price reaches the level of 1.2860, then the trailing stop will move to the level of 1.2840.
Keep in mind that if the price returns from 1.2860 to 1.2850, the trailing stop will NOT go down to 1.2830, but it will remain at 1.2840.
If it was to move down back with the price, it makes no sense, because it will never be reached and will not be able to limit the loss of the deal.
And then you will find out first hand what Margin Call and Stop Out is!
Another important feature to keep in mind is that the trailing stop is only active if the trading platform is active.
If the platform is closed, then you do not have a Stop Loss order at all!
Conclusion
These are the most frequently used orders on the Forex market and they are totally enough, there is no need to complicate trading.
Before you start trading live, get familiar with the conditions of the broker regarding the orders.
Make sure that you understand them and that you can use them correctly.
The best teacher remains the practice, therefore, open a demo account and test the capabilities of the platform.
👍 Please support this tutorial with like and comment so we can help more people together.
Thank you in advance! 🙏

Use ATR for Stop LossWhy is ATR indicator useful?
1) If we know volatility we know where to set stops and targets
2) Higher volatility = higher stops/targets
3) Lower volatility = lower stops/targets
4) This can be easily done using a calculator
Yes, there are websites with the volatility of all Forex pairs--you should confer with prior to taking any trades.
Please try using ATR indicator: ATR x 1.5 = Total Pips (for Stop Loss)

Profits & Stop Loss - Using ATR indicatorOn all pairs you trade you should know the daily ATR volatility and if scalping or day trading that time frames ATR too. The higher the daily ATR is the more volatile the pair, but easier I think to scalp or day trade with.
Rules to use ATR indicator for stop loss are:
1) Find the candlestick or setup that you would like to trade from, (example: 1 hour candle bullish pin bar on GBPCHF chart)- ATR is 12 pips
2) then times it by 1.5, so total would be 18 pips for stop loss
3) this will cover both most volatility of price action and spread ( low or very little getting stopped out on trades)
rules to use ATR indicator for profits are:
1) 1:1 risk reward would be 18 pips
2) 1:1.5 risk reward would be 27 pips
3) 1:2 risk reward world be 36 pips
Note: All three profit targets are noted (by black ARROWS) on 1 hour example chart of GBPCHF
I do not keep ATR on my charts, but just glance at it to set up both stop loss and profit targets and then delete it, this is so my other indicators can assist me after entering any new trades. This is one of the best indicators to use for stop losses and take profit targets, just manage your risk management and lot sizes.
Note: I always let price action come to me and chase price action, so after one hour red candlestick (used for ATR), I let price action reverse into my buy order above price action at open of red pin bar candlestick used to get ATR. Please put into your trading using ATR for both stop loss and profit targets.

Use Proper Position Sizing In Forex (Mandatory)Proper position sizing is THE single most important skill that traders could have. Without it, you’ll end up taking trades that are too big or too small, either blowing out your account or under utilizing a high performing trading method.
Typically, risking a max of 1% to 2% of account per trade is recommended for new traders to avoid ruin, but that will change as your skills grow.
Using a position size calculator, you can match your ideal risk per trade together with your entry and exit levels to give you the exact number of units that you should work with.Of course, you could always round them off (as long as you stay within your max risk) to make your trade journal entries easier or if your broker isn’t flexible with their position size offerings.
Position Sizing: The Way to Profit in Forex
It has been said that the single most important factor in building equity in your trading account is the size of the position you take in your trades. In fact, position sizing will account for the quickest and most magnified returns that a trade can generate. Here we take a controversial look at risk and position sizing in the Forex market and give you some tips on how to use it to your advantage.
How Much Risk Is Enough?
So just how should a trader go about playing for meaningful stakes? First of all, all traders must assess their own appetites for risk. Traders should only play the markets with "risk money," meaning that if they did lose it all, they would not be destitute. Second, each trader must define—in money terms—just how much they are prepared to lose on any single trade. Usually, this percentage is about 2%-3%. Depending on your resources, and your appetite for risk, you could increase that percentage to 5% or even 10%, but I would not recommend more than that.
Look on example chart: Risk was around $110 vs Reward of $185 to $275 or 1 to 1.5 to 2.5 setup. This was based on 1 standard size lot.
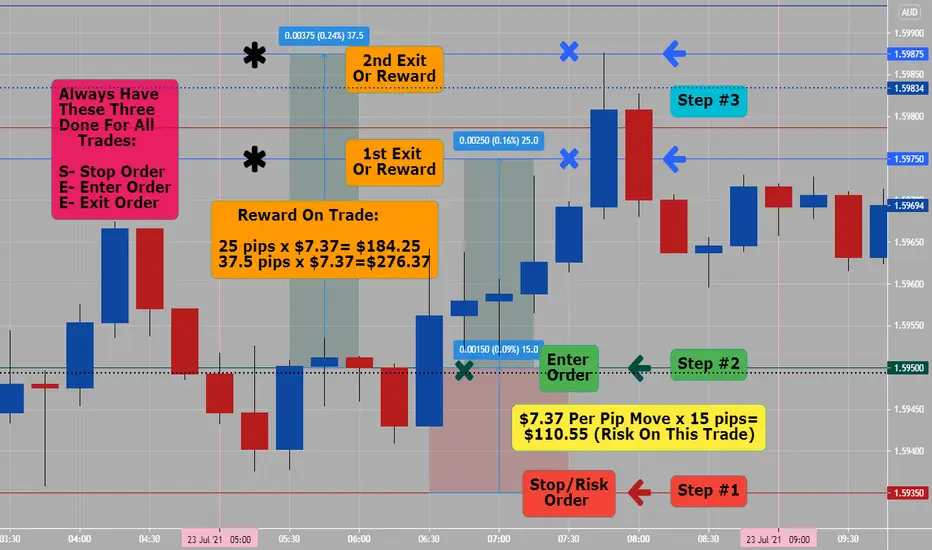
3 Steps Of A Trade (Step #3 Exit Order)Forex Exit Strategies: Tricks on Setting Limit Orders:
Forex exit strategies and exiting a trading position at the right time and price is arguably more important than your entry order. Because only when you exit, you lock in and confirm your profit. Choose the best currency pairs and the best times to trade.Today, let’s talk about getting out, WITH profit. By paying attention to a small trick when setting limit exit orders in your long-term trades.
There are many ways to calculate your Forex exit strategies. They highly depend on your trading time frame, your account’s margin and on the market sentiment in general.Identifying Limit orders or Profit Taking Levels is one of them. These are the areas you calculate to get out of your position and manage your Forex exit strategies when the market prices reach your target.
Limit Orders
Traders usually use market orders to exit trades with a big profit. If you use a limit order while you are going long, then your limit order will be higher than the market price.On the other hand, if you go short with a limit order, then your limit order will be below the market price. Imagine a limit order like a finish line. Your trades will be directly closed every time the market price crosses your limit orders.
Put bull exit orders below obvious psychological round numbers (ex: 1.50000, etc...) and above bearish psychological numbers, support and resistance areas. Most of time big banks on purpose do not go to these areas knowingly that a lot of traders are TRAPPED in these areas.

Trade 3 Steps (Step #2 Enter Order)Entry orders are a valuable tool in Forex trading. Traders can have a great trading plan, but if they can’t execute that plan effectively, all their hard work might as well be thrown out the window. This is where setting up Forex entry orders comes into play. Entry orders allow traders to set price that they would like to buy or sell a currency ahead of time. Only be executed if that specific price is hit. There are several benefits to trading Forex using entry orders.
WHAT IS AN ENTRY ORDER IN FOREX TRADING?
A Forex entry order is an order that is placed at a specified price level for a currency pair. Once this price is reached, the order is then executed/filled. If the price never reaches the desired price level, the order will not execute. The type of order can vary as well, which should be taken into consideration prior to placing the Forex order.
TOP 5 BENEFITS OF USING FOREX ENTRY ORDERS
1. Price Control- The first benefit of entry orders is the control they provide over price level. Traders can indicate their desired price level entry point at which the trade will execute. Having this ability to designate a level allows for ease of trading without having to constantly monitor the market.
2. Entry Orders Save Time-Forex entry orders are very useful for saving time. By setting one, traders do not need to be at a computer when a trend line is hit or when price breaks out of its price channel. Traders can very easily add an entry order to get in the trade if price behaves in the way he/she thinks it will. The order does the waiting and allows traders to focus on other things.
3. Better Money Management- Forex entry orders help to save money. To understand this better, consider how much time traders dedicate to trading each day.
4. Accountability-Forex entry orders (with stops and limits attached) also help keep traders accountable. This is because they eliminate the possibility of emotions getting in the way of reliable, profitable trades, and make sure traders are following the rules to the latter.
5. Support Trading on a Time Frame-Trading on a custom time frame can allow for more specified trades that could be in line with upcoming market news, political events or company results depending on what market is being traded. Traders can stipulate the expiry period for the entry order:

Trade 3 Steps (Step #1 Stop-Loss Order)“Always use stop-loss orders.” -W.D. Gann, legendary investor/trader
What is Stop Loss in Forex?
Stop loss in Forex is a great way to minimize the amount of money you lose through trading. It is an exit plan in the event of a losing trade. Essentially, stop loss is a limit you set to minimize your risk that automatically exits you out of a trade if your currency pair dips below a level that is losing you money. Stop loss is a valuable mechanism that Forex traders must use if they want to make a living from Forex Trading. It is especially essential for beginner and inexperienced Forex traders who aren’t able to always make the best trade choices. Stop loss, while important for beginners, is also used by experienced traders. There’s no downside to protecting your trades- unexpected fluctuations of currency prices happens all the time, and it’s wise to safeguard your investing when you can. Stop loss also allows you to make trades and walk away from the computer for a while, instead of having to watch the currencies change. It also worth mentioning that stop loss can work against you. * I let the trade breath with stop loss but still look for 1:5 or higher risk reward setups.
Let’s say your stop-loss is hit and you are automatically backed out of a trade, and after you’re exited from the trade the currency pair swings back other way exponentially? Not only did you just lose money on the trade, you missed out on a potentially big profit. This is why some Forex traders might have a disdain for stop loss since they view it as missing out on opportunities for major swings in a currency pair. While it depends on who you talk to, the majority of Forex traders will advise you to use stop loss, especially for beginners. It’s necessary to know about stop loss orders and how to calculate the proper limit to set it at.
Figure out your stop-loss strategy and keep to it- it will save you in the long run. Nailing down a proper stop loss strategy before you start trading is one of the best ways you can ensure yourself from the always-changing Forex market.Choosing best stop loss strategy depends on your experience, skill level, bankroll, etc. There are so many different factors that will impact what the best stop loss strategy will be for you. As with everything in Forex, it’s best to educate yourself on Forex trading strategies to eventually get to the point where you’re making a consistent income through online trading.

REASONS not to trade 1st hour of sessionIf you are either a scalper trader and/or a day trading, the 1st hour of new session is never a place to trade: Here are some reasons:
1) Low Liquidity
2) Low Volume
3) Very High spread widening ( can be 15 to 20 pips) from broker
4) Very Large hourly candlesticks (example: 88 pip large clearing doji candlestick) happens for broker to take both buyer and seller positions out.
Note: 1st hour of session is during Sydney session, then afterwards Tokyo session starts. Increasing liquidity and volume starts end of Tokyo.
Part of your plan should be:
Pairs to trade
When to trade
What setups to trade
Trading edge & Strategy
Do not be greedy especially during the financial craziness going on in most countries around the world, just get a piece of PIP PIE in a trade if you are either a scalper or day trading. Use risk management and commonsense- this is no place to gamble with your money- use probabilities of success of setups.

Smart Money- Pair,Price,Session & TimeIf you are a scalper trader or day trader you need to know always:
What pair are you trading (ADR, day of week, etc...)
What price is right now
What session(s) is open/closed now- start of session, middle or end
What is time- lunch in Tokyo, London or NY.
Smart Money- Where is the money- right now?
From example one hour chart of Friday (what do you see?)
You need to know support or resistance areas (bearish or bullish order blocks)
When price action could breakout or reverse from a manipulation phase- anticipation and catching these moves are early will give your set ups less risk and lower stop loss, especially if you scalp or day trade.

The 3 Types of Traders. Who Do You Belong To? 🤔
There are thousands of different ways to trade the market.
During the last 100 years, various trading strategies and techniques were invented.
One of the ways to categorize them is to split them by types of traders.
Such a category type will lean on 2 main elements:
trading frequency and time frame selection.
1️⃣ - Scalper
I guess 99% of newbie traders start from scalping.
Trying to catch quick market moves and become rich quick,
newbies are practicing different scalping strategies.
What is funny about scalping is the fact that such a trading style is considered to be the easiest by the majority while remaining one of the hardest in the view of pros.
The main obstacle with scalping is a constant focus and rapid decision-making.
Scalpers usually open dozens of trading positions during the trading session, most of the time being in front of the screen constantly.
Paying huge commissions to the broker and dealing with complete chaos on lower time frames, the majority simply can't survive the pressure and drop, leaving the pie to true gurus.
2️⃣ - Day Trader
Day trading or intraday trading is the most appealing to me.
Staying relatively active, the market gives some time for the trader for reflection & thinking.
Opening and managing on average 1-2 trades per trading session, the intraday trader is granted a certain degree of freedom.
However, with declining volatility, quite ofter intraday traders get a relatively low risk/reward ratio for their trades,
3️⃣ - Swing Trader
Swing trading is the best choice for traders having a full-time job.
Primarily being focused on daily/weekly time frames, swing trading is not demanding for a daily routine and aims at catching mid-term/long-term market moves.
With an average holding period being around 2 weeks and opening 1-2 trading positions per week, swing trading is considered to be the least emotional and involves low risk.
The main problem with swing trading is patience.
Correctly identifying the market trend and opening a trading position,
the majority tends to close their positions preliminary not being patient enough to let the price reach their target.
Which trading type do you prefer?

Continuation & Reversal Correction in price action structures
In-depth look at Continuation & Reversal Correction in price action structures/patterns
Hi everyone:
Today I want to revisit the fundamental aspect of trading impulsive and corrective phases in Price Action Analysis.
As you all know I focus on multi-time frame analysis and forecasting/anticipating the next impulsive move in the market.
To me, the most important part of identifying the next impulsive phase of the market, is to understand how correction works.
An impulse phase usually happens after a correction has finished correcting, so the key is to identify and understand how a corrections structure will complete so we anticipate the next impulsive move.
You may have seen my videos on this topic, but today I will go more in detail on this, and explain the 2 types of correctional structure the market can create.
The market can only be in 2 phases, impulsive phrase or corrective phrase.
In addition, the corrective phrase can only be continuation, or reversal.
So to fully have an edge in the market, is to understand what the correctional structure the price is currently making,
whether a continuation/reversal, then forecast the possible price outlook, and go down to the lower time frames for possible entries.
Now, it's important to understand that different traders/strategies/styles will call these patterns/structures in varies names.
What they are called or identify isn't important, but the important aspect is to understand whether they are continuation, or they are reversal.
In addition, simply seeing price action structures/patterns by itself, is not a good enough entry criteria for me.
You want to combine multi- time frame analysis, top-down approach, and with multiples of these price actions all happening so it adds extra confluence for you to enter a particular trade.
Seeing a H and S pattern, on a 5 minute chart, without considering the overall HTF and other factors, will not be a consistent move in the long run.
Continuation Correctional Structure/Pattern
Bullish/Bearish Flag
Bullish/Bearish Pennant
Parallel Channel
Reversal Correctional Structure/Pattern
Ascending/Descending Channel
Rising/Falling Wedge
Double Top/Bottom
Head & Shoulder Pattern/Inverse H and S
“M” and “W” style pattern
Reversal Impulse Price Action
I will forward all the price action structures/patterns videos I have made in the past to help you understand each of the structures more.
Impulse VS Correction
Multi-time frame analysis
Identify a correction for the next impulse move in price action analysis
Continuation Bull/Bear Flag
Parallel Channel (Horizontal, Ascending, Descending)
Reversal Ascending/Descending Channel
Reversal Double Top/Bottom
Reversal Head & Shoulder Pattern
Reversal “M” and “W” style pattern
Reversal Impulse Price Action
Continuation/Reversal Expanding Structure/Pattern
Any questions, comments or feedback please let me know. :)
Thank you
Jojo

Education - How to Take Losses & Move On EffectivelyThis is usually something that people don't want to talk about... We think its important that everyone does!

How to manage & deal with consecutive losses in trading ?
Trading Psychology: How to manage & deal with losses/consecutive losses in trading ?
Hi everyone:
Today I want to go over a very key trading psychology lesson on how to deal with losses, especially consecutive losses.
This is bound to happen to any traders, whether you are new or experienced. ITs something all professional traders will have to deal with on a regular basis.
Understand that, dealing with losses psychologically is the key factor in the success of a trader.
This is because losses are inevitable, and trading is a probability, which trades that you take will end up both in wins and losses.
However, traders usually can not accept losses, due to their ego, greed and other emotional factors.
Aside from having a good risk management, trading plan, and trading strategies, traders can still experience the psychological emotions of losing.
This is due to the fact that we are humans and we are an “emotional” animal. We don't want to be wrong, at all.
Taking a loss is like getting slapped in the face by the market, which we have egos to fight against.
What ends up after taking losses or consecutive losses, it puts traders at a disadvantage where their emotion is high, and likely to “revenage” trade to chase back losses, which end up in a deeper hole.
To deal with such psychological phenomena, take a step back and observe your situation:
First, did you follow your trading plan/strategy on how to enter, set SL/TP, and management ?
Second, did you take an emotional trade due to greed or fear of missing out ?
Third, have you journal down your losses and review them to make sure they are trades you really want to risk your capitals on ?
By now you will see why we need to review these. Trading is a probability, not right or wrong. It's a random variable that you are putting your $ at risk.
So if you understand the rules and plans that you follow and execute a trade accordingly,
then there should NOT be any negative emotions towards the outcome of the trades, whether they are winners or losers.
When I discuss the trades I entered every week in my trade recaps videos, I am always happy to enter a position, even if it goes to a loss.
This is because I have done enough backtesting, chart work, and plan to enter a position.
I understand strictly from a probability point of view, I could have a higher strike rate, and more often the trades will end up as a winner rather than a loser.
However, I also understand and acknowledge that some trades will end up in a loss, disregard mine technical analysis or other’s fundamental analysis. It is what trading is all about.
When I have consecutive losses, I will always review the 3 points I mentioned above and make sure they are all valid for me.
Then I simply will take 1 day off from the market, chart, phone, and just get your mind clear. Come back strong after 1-2 days of rest, and have a positive mindset.
What traders often do when they have consecutive losses is to right away re-enter back into the market and try to chase back their losses.
This has always been the downfall of losing and it creates anxiety in traders’ minds.
Such a negative experience is going to stay in the traders’ mind longer and deeper, compared to consecutive winners.
So wise we understand that is the case how our brain is "programmed” into thinking, then it's up to us to do the opposite, and fight the urge to “revenge” our losses.
At the end of the day, no one is trading your trading account, except yourself.
Taking ownership of your account, learning to control our emotions, understanding the probability side of trading, and learning to let go, drop our ego will help us in the long run in this industry.
I hope these pointers can help some traders who are still struggling with this concept.
It's impossible not to take losses, but professional traders deal with it on a regular basis and still remain consistent in the long run.
Thank you
I will forward some Trading Psychology educational videos below on some of the topics explained today.
Trading Psychology: Revenge Trading
Trading Psychology: Fear Of Missing Out
Trading Psychology: Over Leveraged Trading
Trading Psychology: Is there Stop Loss Hunting in Trading ? How to deal with it ?

The Hammer (How To Trade)The hammer:
Puts in its appearance after prolonged downtrend. On the day of the hammer candle, there is strong selling, often beginning at the 3rd/4 hour candle of session. As the session goes on, however, the market recovers and closed near the unchanged mark, or in some cases even higher. In these cases the market potentially is "hammering" out a bottom.
In order for the Hammer signal to be valid, the following conditions must exist:
The FX pair must have been in a definite downtrend before this signal occurs. This can be visually seen on the chart.
The lower shadow must be at least twice the size of the body.
The 4 hour (example candle, see chart) after the Hammer is formed, one should witness continued buying
There should be no upper shadow or a very small upper shadow. The color of the body does not matter, but a blue/green body would be more positive than a red body.
Make sure pattern on 4 hour time frames happen during Tokyo session, can be on 1 hour time frame if they happen during London or NY session. (fyi)

Dragonfly Doji (How to Use It)A "Dragonfly" doji:
Depicts a time period on which prices opened high, sold off, and then returned to the opening price.
Dragonflies are fairly infrequent, but when seen on hourly, 4 hour or higher would consider trading them to the bullish side.
When they do occur, however, they often resolve bullishly (provided the Forex pair is not already overbought as shown by Bollinger bands and indicators such as stochastic).
Things to look for:
1) Dragonfly doji to happen in 1st 8 hours of a new session.
2) First 8 hours of new session is low liquidity and volume (during Tokyo session).
3) For scalping or day trading, I would make sure right pair, right price, right session and right time- for trading any FX pairs.
4) If you catch a pattern within the 1st 8 hours- you may be able to ride the trade thru the end of London session (this is end of all of my trades or earlier).
Example chart trade was set up on 4 hour session with a 1:1.5 risk/reward setup with is great if you are day trading a trade for 8-10 hours. Are you patience?

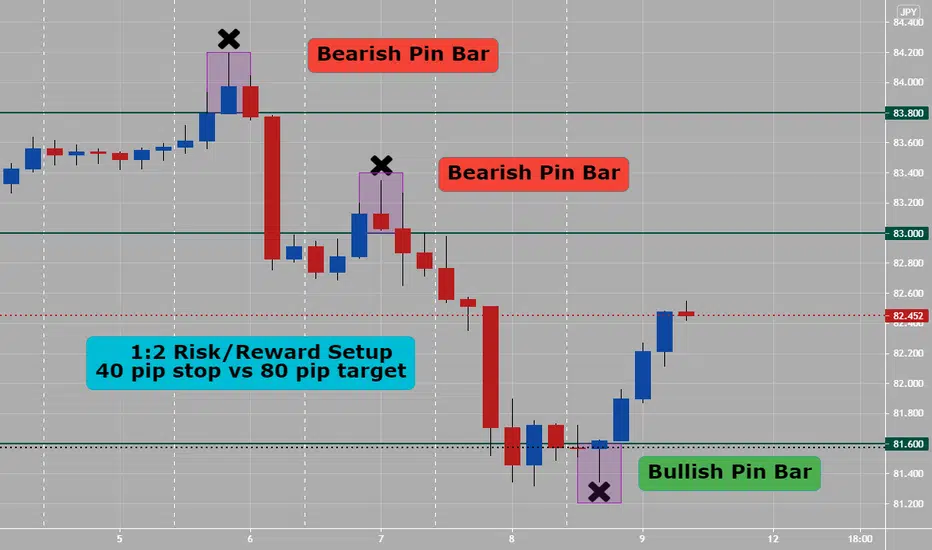
Breakouts (Keep Trading Simple)Breakouts
Violation of Trend Line, Support or Resistance, or previous reversal point.
It signifies that a change in buyer and seller behavior and signals the beginning or end of a trend.
See chart for more visual clues on how to trade this: 1:4 risk reward would have worked on this trade or 20 pip stop vs 80 pip target+.

AudJpy (Day Trade- How To Manage It)Patience is a must in trading Forex. Take a deep breath. Let trade work out. This AudJpy trade was an example of risking 25 pips vs target of 25 pips on the initial setup and then bring stop loss to lock in break even when New York opens for 25 pips vs 50 pip target. Let trade play out..

Sydney-Tokyo Overlap Session Do you trade AUD pairs? If yes, look for trends to start during the overlapping session with Tokyo: around 6 hr overlap time.
What To Look For:
1) Look on hourly charts for trends with AUDxxx or xxxAUD pairs to start during Sydney-Tokyo overlapping session (slow but great risk/reward setups)
2) See AUDJPY 1 hour chart example- excellent Harami two candle pattern to set up a bullish trade with. (placed in purple box on chart)
3) 81.500 price level is a highly psychological price level for big banks and realtor traders ( both, love price numbers ending with 000,250,500 or 750)
4) On chart is three indicators (that I use either alone or together) to get confluence with to enter a new trade: Yes, price action only with naked charts work.
A- Ichimoku Cloud- price action is above gold line or conversion line (so bullish sign)
B- Pivot Points- price action is above weekly pivot point or red line (so bullish sign)
C- Bollinger Band- price action is on or above 20 ema or middle yellow line and BB squeeze is starting (so bullish sign)
Note: With Aud pairs- look for trends to start during the Sydney session and both Sydney-Tokyo overlapping session- this AUDJPY bullish trade on hourly chart on Friday could have let you ride it for most of the daily session. Do not be greedy when scalping or day trading- get your pip piece of pie and close trade.
With all trading price action and risk management are both #1 (set entry, stop and targets for all trades)-

Harami/Inside Bar (3 of 3)Harami/Inside Bar
This pattern is a two-candlestick pattern in which the first candlestick vertically encompasses the one that follows it. This signal is interpreted in two ways:
1. An indication that an increase in volatility is imminent. This affords traders the opportunity to create trades that speculate not so much on direction,
but rather on an increase in volatility on a breakout in any specific direction.
2. In the context of a trend, a harami/inside bar can be indicative of exhaustion and the onset of a reversal. In this manner, it is similar to long wick patterns
and evening star/morning star patterns examined earlier in this guide.
Note: All three patterns in this series (Pin-bar, Harami and Engulfing) should be traded with a confluence of things like:
1) Support and Resistance
2) Trend lines
3) Fib Retracement levels (50% to 61.8%) golden zone
4) Remember: Pair you trade, Price right now, Session(s) open & Time it is. All of these are highly important in Forex trading.
5) Patterns at pivot points (daily, weekly or monthly)

Engulfing Candlesticks (2 of 3)Engulfing Candlesticks
The other important candlestick pattern I think price action traders need to have knowledge on is the engulfing candlestick. Like pin bar the engulfing candle is a reversal pattern, which means that a reversal is supposed to take place immediately after you see one form in the market. Unlike the pin bar the engulfing candlestick is a two bar reversal pattern, a pattern which requires there to be two candlesticks present in order for it's formation to be complete.
The formation of a bearish engulf is always a signal that a reversal to the downside is about to take place. The pattern itself consists of two candlesticks.
The bearish engulfing candlestick itself, which I've marked with an arrow, and the bullish candlestick that formed an hour before. The bullish candle is first candle required in the bearish engulf setup. This is the candlestick which the market will always engulf with a bearish candle immediately after it's formation.
In order for a bearish engulfing candle to form, a bullish candle must have formed immediately prior. You can't have a bearish candlestick engulfing another
bearish candle, it has to be a bullish candle in order for it to be a bearish engulf.
Bullish engulfing candlesticks are of course the opposite to bearish engulfing candles, which means their appearance is a sign the market is going to reverse
to the upside. Like the bearish engulfing candle they are also a two bar pattern, but instead of the first candle in the pattern being a bullish candlestick, like we see with the bearish engulfing formation, the first candle in a bullish engulfing setup will always engulf a bearish candle. A bullish engulfing candle cannot engulf another bullish candle, it can only engulf bearish candles.
Engulfing candlesticks are best used as signals to enter trades at pre-existing points where you expect the market to reverse, such as support and resistance
levels or supply and demand zones. They can be traded on their own without any other confirming factors being present, but in my opinion they don't tend to work out as well as pin bars do.

Pin Bar/Hammer Candlestick (Part 1 of 3)The pin bar is a single candle pattern which can be found forming across all currencies and all time-frames in the market. It falls into the category of price
action reversal patterns due the fact it's appearance is supposed to be a signal a reversal is going to occur. Although it must be said that very few pin bars actually cause large reversals to take place in the market, (I'll explain why in a minute).
Like most price action patterns the pin bar comes in two varieties:
The bullish pin bar, which signals a reversal to the upside may be about to take place, and the bearish pin bar, which is a sign a reversal to the downside is
probably going to occur. You can see that the vast majority of these bullish pins did cause the market to reverse once they had formed, but they didn't all cause it to reverse for the same duration of time. Some caused large upswings to take place whilst others only created small retracements.
Again, you can see that the pin bars which formed on here also caused reversals of varying sizes to take place. The reason why pin bars cause different sized reversals to occur, is because of the action that caused the pin bar to form in the first place. Pin bars and all the other candlesticks you see forming on your charts, form as a result of traders making decisions in regards to the market price. Pin bars happen to form exclusively from the bank traders either placing trades because they want to make the market reverse, or from taking profits off trades which they've already got placed.
The reversal created by the pin bar which has formed as a result of the bank traders taking profits off their trades, is naturally much smaller than the reversal caused by the pin which has formed from the bank traders placing trades to make the market reverse. It's obvious why this is, I mean if you took some profits off a trade you would want the market to continue moving in the direction to which your trade had been placed so you could make more money from the trade. The bank traders want the same to happen when they cause a pin bar to form from taking profits off their own trades, which is why the reversal caused by some pin bars forming are much smaller than the reversals caused by other pins forming.
Bullish and bearish pin bars are really good reversal patterns to watch out for if you're a price action trader, but they must be traded in the right way and you must understand why they form in the market. Most of the books and guides out there on pin bars do not teach traders what causes them to form, when it's knowing what causes them to form that will allow you to determine which pins have a high probability of working out successfully.