타지마할 밴드⚠️ Disclaimer: For Informational Purposes Only – Use at Your Own Risk
The indicators and tools provided in this script are intended solely for educational and informational purposes. They are not financial advice, investment recommendations, or guarantees of any kind. While technical indicators can be helpful in identifying trends or potential entry/exit points, they are inherently limited, subject to interpretation, and should never be relied upon as the sole basis for making trading decisions.
Market conditions are dynamic and influenced by numerous unpredictable factors. Past performance, patterns, or signals generated by indicators do not guarantee future results. No indicator can account for fundamental news events, market manipulation, or sudden price volatility.
You are solely responsible for any decisions you make based on the use of this script. Trading involves substantial risk and may not be suitable for every investor. Always conduct your own research, consult with a qualified financial advisor, and understand your personal risk tolerance before entering any trade.
Use this tool at your own discretion and always trade responsibly.
Cycles

Session SeparatorAn indicator that adds a vertical line for each of the following sessions start times:
Tokyo Session: 7pm EST
London Session: 3am EST
US Session: 8am EST
The purpose of this indicator is to have a minimalistic separation of the different time zones without cluttering the chart!

Enhanced Market Structure (Advanced)We are beta testing a ICT script that 100% does all of the price action analysis for you. We are excited to show case this as it has taking us over a YEAR to fully code and do what we want. THIS IS THE MARKET STRUCTURE VARIATION!

TradeX Labs Price Action (FREE Variation)We are beta testing a ICT script that 100% does all of the price action analysis for you. We are excited to show case this as it has taking us over a YEAR to fully code and do what we want. THIS IS THE FREE VERSION.

TradeX Labs Price Action (FULL VARIATION)We are beta testing a ICT script that 100% does all of the price action analysis for you. We are excited to show case this as it has taking us over a YEAR to fully code and do what we want.

First Candle🕯️ First Candle Indicator (First 5-Minute Candle High/Low)
The First Candle indicator automatically marks the high and low of the first 5-minute candle of the U.S. trading session . These levels can act as key intraday support and resistance zones, often used in breakout, scalping, or opening-range trading strategies.
📌 Key Features:
Automatic detection of the first candle of the U.S. session based on the selected timeframe (default is 5 minutes).
Horizontal lines are plotted at the high and low of that candle, with fully customizable colors and thickness.
Labels show the exact level and timeframe used for the high and low.
Resets daily, removing previous session data at the start of a new session.
Displays a visual marker (blue triangle) when the first candle is detected.
Allows users to select different timeframes for defining the "first candle" (e.g., 1, 5, 15 minutes).
⚙️ Customizable Inputs:
Show First Candle Lines: toggle the display of high/low lines.
Timeframe for Marking: choose the timeframe to detect the first candle (e.g., 5 minutes).
High Line Color / Low Line Color: set the color of each level line.
Line Thickness: adjust the width of the lines (1 to 5 pixels).
🧠 Strategic Applications:
Identify breakout zones right after the market opens.
Define opening range for pullback or continuation setups.
Set clear reference levels for intraday trading decisions.

King 3EMA Trader CryptoShorter EMA Periods: The 13/55/21-period EMAs are more responsive than the original 21/89/34, better capturing the rapid price movements in BTC and ETH markets.

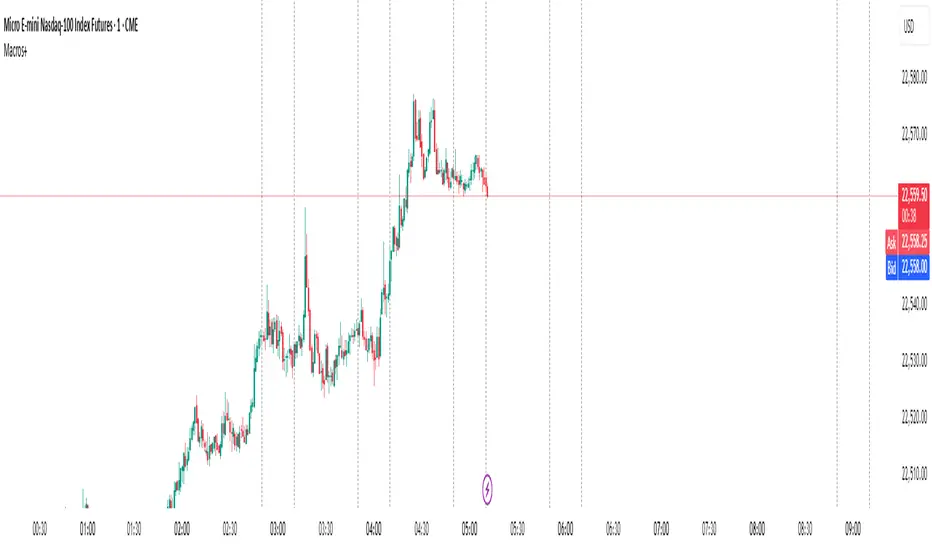
Predictive Time & AlertsPredictive Time Engine (ICT Macros)
Summary
The Predictive Time Engine is a visual tool designed specifically for traders who utilize Time & Price based methodologies, particularly those inspired by ICT (Inner Circle Trader) concepts.
The primary purpose of this indicator is to visualize the critical "time windows" where market liquidity is most likely to be significantly manipulated or distributed. Instead of only appearing in real-time, this indicator is predictive: at the beginning of each day, it will automatically calculate and draw all selected macro sessions for the day ahead, serving as your daily time roadmap.
With this tool, you will no longer miss these crucial moments and can be better prepared to anticipate price action.
Key Features
Predictive Visualization: Automatically projects and draws all macro time windows for the current trading day, giving you a forward-looking view of where the action is likely to occur.
ICT Macro Time Filter: Based on the "Hourly-Macros" concept, which are specific 20-minute periods within each hour (e.g., 09:50 - 10:10) where the price delivery algorithm (IPDA) is often active. You can select and enable each macro window you wish to monitor.
Full Customization: You have complete control over how the information is displayed. Choose between:
Outline: A clean, transparent box frame.
Background: A solid, colored background for the time zone.
Vertical Lines (Dotted, Dashed, Solid): Marks the beginning of each macro session with a vertical line in your chosen style.
Real-time Alerts: Set up notifications in TradingView to get an alert precisely when the price enters one of your selected Macro Time windows.
Automatic Management: Drawings from previous days are automatically cleared to keep your chart clean and focused on the current day's schedule.
The Concept Behind the Indicator
This indicator is inspired by the concept that the market moves in fractal Time Cycles, from yearly down to 90-minute periods. Each of these time cycles often follows a pattern of AMD (Accumulation, Manipulation, Distribution).
Accumulation: A phase of order gathering.
Manipulation: Price is often driven in the opposite direction of its true intent to sweep liquidity (stop losses).
Distribution: The true price move towards a liquidity target (Draw On Liquidity).
The Macro Time windows marked by this indicator are often the stage where the Manipulation phase or the beginning of the Distribution phase occurs. By knowing when these times are approaching, traders can be on high alert and look for confirming trade setups in the most potent areas and times.
How to Use
Configure Sessions: Open the indicator's Settings.
In the "1. General Settings" tab, ensure the Timezone matches your chart's local time (Default: "America/New_York").
In the "2. Active Macro Sessions" tab, check the box for each macro time window you want to monitor.
Choose Display Style: In "General Settings", select your preferred "Display Style" (Outline, Background, or various Line types). You can also change the color.
Set Up Alerts (Optional):
Click the "Alert" clock icon in the TradingView toolbar.
In the "Condition" section, select this indicator: Predictive Time Engine.
From the dropdown below it, ensure "Sesi Makro Dimulai" (Macro Session Start) is selected.
Set your desired notification options and click "Create".
Chart Interpretation: Use the marked time zones as high-alert areas. Pay close attention to how price reacts when entering or leaving these zones to find potential entry opportunities that align with your trading strategy.
Disclaimer: This tool is provided for educational and analytical purposes only. It is not financial advice. All trading decisions are solely your responsibility. Conduct your own research and manage your risk appropriately.
Session Overlay [Tokyo, London, NY]This indicator is for Distinguishing between US Tokyo/London sessions we can easily determine each of them with color in background works better on 15 minute to 1 hour time frame.

Altcoins vs Stablecoins (with signals)This indicator visualizes the ratio of altcoin market dominance (excluding the top 10) to the combined dominance of the two largest stablecoins (USDT + USDC).
📊 Formula:
OTHERS.D / (USDT.D + USDC.D)
🔍 Purpose:
Rising values indicate increasing capital flow into altcoins — a potential altseason signal
Falling values suggest capital rotation into stablecoins — risk-off behavior
🟢 Bullish Signal:
When the ratio crosses above 1.3, a green arrow appears — signaling possible altcoin momentum
🔴 Bearish Signal:
When the ratio crosses below 0.9, a red arrow appears — signaling capital flight into stablecoins
✅ Useful for:
Timing market phases
Spotting early altseason entries
Portfolio rotation and risk monitoring

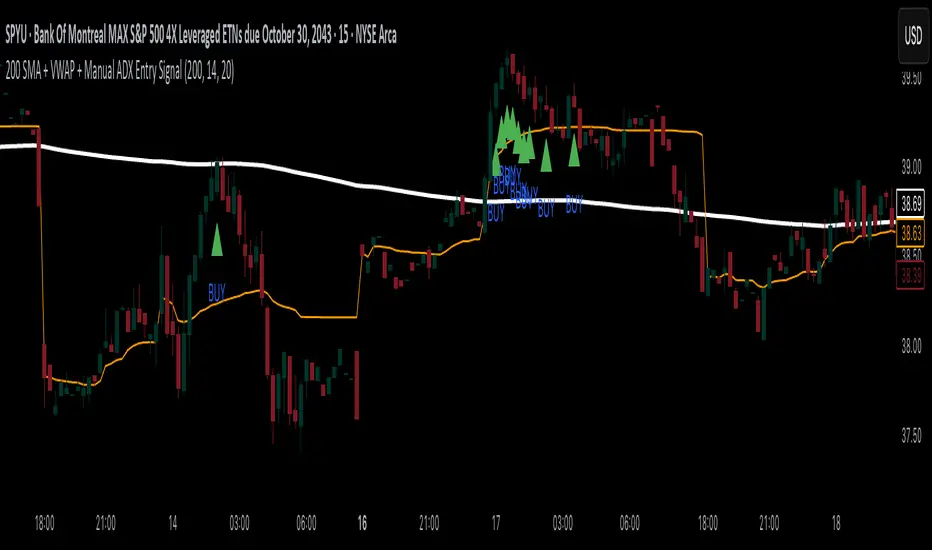
200 SMA + VWAP + Manual ADX Entry Signal200 SMA + VWAP + Manual ADX Entry Signal – Indicator Description
This custom indicator is designed for trend-following intraday traders who want a powerful, rules-based entry confirmation system. It combines three proven tools—the 200-period Simple Moving Average (SMA), Volume-Weighted Average Price (VWAP), and a manually coded ADX (Average Directional Index)—to identify high-probability long entries in strong, directional markets.
By filtering trades through a combination of trend direction, mean-reversion reference, and momentum strength, this indicator helps traders avoid false breakouts, whipsaws, and low-quality setups. It’s particularly well-suited for traders using 15-minute charts, leveraged ETFs, or high-beta stocks, where precision entries and trend confirmation are critical to consistent profitability.
⸻
✅ What This Indicator Does
This indicator visually displays:
• The 200-period SMA (orange line) – a long-term trend filter.
• The VWAP (blue line) – a dynamic intraday price average used by institutions.
• A buy signal triangle below the price bar – when all bullish criteria are met.
• It also includes an alert condition so traders can be notified when a new buy signal appears in real time.
Behind the scenes, the indicator calculates trend and strength conditions and plots a BUY signal only when all three tools agree that a bullish move is in play.
⸻
🔍 The Three-Pillar Entry System
1. 200 SMA Filter – Defining Market Bias
The 200 SMA is a widely used institutional benchmark that represents long-term trend direction. In this indicator:
• A trade is only considered valid if price is above the 200 SMA.
• This helps eliminate trades in downtrending or range-bound markets.
• It ensures that entries are aligned with broader directional bias.
By filtering out trades below the 200 SMA, you instantly remove a majority of low-probability setups and whipsaw environments.
⸻
2. VWAP – Institutional Mean Price Anchor
VWAP (Volume-Weighted Average Price) is often used by hedge funds and algorithmic systems to judge whether price is considered “expensive” or “cheap” within a given trading session.
• This version of VWAP is anchored to the current intraday session.
• Trades are only considered valid if price is above the VWAP, which shows market consensus is favoring the upside.
• VWAP provides both confirmation and support levels, helping ensure your entry isn’t into overextended territory.
By combining the 200 SMA and VWAP filters, the indicator ensures that trades are only taken when price is strong on both the macro and micro timeframes.
⸻
3. ADX – Confirming Momentum Strength
ADX (Average Directional Index) is used to measure trend strength without regard to direction. However, TradingView has limited functionality with the ta.adx() call in some environments, so this script includes a custom-coded version of ADX that follows standard Wilder’s smoothing and directional movement logic.
• A BUY signal only triggers if ADX is above a user-defined threshold (default is 20) and rising from the previous bar.
• This means not only is the market trending — but the trend is strengthening.
This final filter prevents entries in chop or decaying rallies, and ensures you’re catching the strongest part of a move, not the tail end.
⸻
⚙️ Logic Summary
A BUY signal is plotted when:
• Price > 200 SMA ✅
• Price > VWAP ✅
• ADX > 20 and rising ✅
Only when all three conditions are true does the indicator plot a green triangle below the price bar.
This visual simplicity makes it ideal for fast trade decisions, and the alert function allows hands-free monitoring during busy sessions.
⸻
🧠 Recommended Use
This indicator works best on:
• 15-minute to 1-hour charts
• Intraday leveraged ETFs (e.g., TQQQ, SPYU, SQQQ)
• Trend-following strategies
• Breakout continuation trades
⸻
📉 Limitations
• This is a long-only system by design. If you want to trade short, you’ll need to invert the logic (e.g., price < 200 SMA, price < VWAP, ADX > threshold).
• It doesn’t generate exit signals. You should pair this with your own take-profit or trailing stop strategy.
• While it works great for momentum entries, it may underperform in range-bound or news-driven chop markets.
⸻
🛠️ Settings Customization
• SMA Length: default is 200; adjust for faster or slower trend confirmation.
• ADX Length: default is 14; shorter periods = more sensitive, longer = smoother.
• ADX Threshold: default is 20; raise to 25 or 30 to only catch very strong moves.
These settings give you flexibility to match the indicator to your trading style.
⸻
🚀 Final Thoughts
The 200 SMA + VWAP + Manual ADX Entry Signal is a battle-tested, rule-based tool to help you:
• Enter only when the trend, mean, and momentum align
• Avoid fakeouts and poor risk-reward entries
• Automate part of your setup process without overcomplication
This is the kind of filter used by professional traders to reduce screen time and improve trade quality. If you’re looking to build confidence in your intraday trading with clear, logical entries — this indicator will help you stay consistent and systematic.
Happy trading!
Breakouts with Trailing Stops V6 + AlertsBreakouts with Trailing Stops in Trading
Breakout trading is a strategy where traders aim to profit from an asset's price moving outside a defined support or resistance level, signaling a potential new trend. Trailing stops are a key risk management tool often used with breakouts to protect profits and limit potential losses.
What is a breakout?
A breakout occurs when an asset's price moves decisively above a resistance level (for a bullish breakout) or below a support level (for a bearish breakdown). This often signals increased momentum and potential for a significant price movement in the direction of the breakout.
Why use trailing stops with breakouts?
Trailing stops are particularly useful in breakout trading because they allow traders to capture potential profits as the price moves in their favor, while automatically adjusting to protect against sudden reversals.
How do trailing stops work with breakouts?
Initial Stop-Loss: When entering a breakout trade, a traditional stop-loss order is placed at a predetermined level to limit potential losses if the price reverses. For example, in a long position after a resistance breakout, the initial stop-loss might be placed below the former resistance level (which can now act as support).
Trailing Stop Activation: Once the price moves a favorable distance beyond the entry point, the trailing stop loss is activated. As highlighted by StoneX, it is a dynamic order that follows the price as it continues to move in the desired direction, maintaining a set distance below (for a long position) or above (for a short position) the current market price.
Profit Locking: If the price continues to rise (or fall for a short position), the trailing stop will move with it, "locking in" profits by raising the stop-loss level.
Exit Strategy: If the price reverses and hits the trailing stop, the position is automatically closed, ensuring that the trader retains a portion of the gains made while in the trade.
Advantages of using trailing stops with breakouts:
Locks in profits: Trailing stops help protect profits generated from successful breakout trades.
Automates exits: They automate the exit process, helping traders avoid emotional decision-making when the price reverses.
Allows for potential gains: They allow traders to stay in profitable trades as long as the trend continues.
Disadvantages of using trailing stops with breakouts:
Whipsaw risk: In volatile markets, the trailing stop may be triggered prematurely by minor price fluctuations.
Potential for missed gains: If the trailing stop is set too tightly, it may prevent the trader from capturing the maximum potential gains if the price experiences a minor pullback before continuing in the desired direction.
Tips for using trailing stops with breakouts:
Consider the asset's volatility: Adjust the trailing stop distance based on the asset's volatility to minimize the risk of premature stops.
Test different trailing stop methods: Experiment with different trailing stop methods to find what works best for your trading style and the specific asset you are trading.
Backtest your strategy: Before applying a trailing stop strategy to live trading, backtest it on historical data to evaluate its performance under different market conditions.
Combine with other indicators: Use other technical indicators, such as volume or momentum oscillators, to confirm the validity of breakouts and improve the effectiveness of your trailing stop strategy.
By carefully considering the market dynamics, using appropriate indicators, and implementing proper risk management techniques, traders can effectively utilize trailing stops with breakouts to capture potential profits while minimizing risk.
Have a good trade.

LANZ Strategy 1.0 [Backtest]🔷 LANZ Strategy 1.0 — Time-Based Session Trading with Smart Reversal Logic and Risk-Controlled Limit Orders
This backtest version of LANZ Strategy 1.0 brings precision to session-based trading by using directional confirmation, pre-defined risk parameters, and limit orders that execute overnight. Designed for the 1-hour timeframe, it allows traders to evaluate the system with configurable SL, TP, and risk settings in a fully automated environment.
🧠 Core Strategy Logic:
1. Directional Confirmation at 18:00 NY:
At 18:00 NY, the system compares the 08:00 open vs the 18:00 close:
If the direction matches the previous day, the signal is reversed.
If the direction differs, the current day's trend is kept.
This logic is designed to avoid momentum exhaustion and capture corrective reversals.
2. Entry Level Definition:
Based on the confirmed direction:
For BUY, the Low of the day is used as Entry Point (EP).
For SELL, the High of the day becomes EP.
The system plots a Stop Loss and Take Profit based on user-defined pip inputs (default: SL = 18 pips, TP = 54 pips → RR 1:3).
3. Time-Limited Entry Execution (LIMIT Orders):
Orders are sent after 18:00 NY and can be triggered anytime between 18:00 and 08:00 NY.
If EP is not touched before 08:00, the order is automatically cancelled.
4. Manual Close Feature:
If the trade is still open at the configured hour (default 09:00 NY), the system closes all positions, simulating realistic intraday exit scenarios.
5. Lot Size Calculation Based on Risk:
Lot size is dynamically calculated using the account size, risk percentage, and SL distance.
This ensures consistent risk exposure regardless of market volatility.
⚙️ Step-by-Step Flow:
08:00 NY → Captures the open of the day.
18:00 NY → Confirms direction and defines EP, SL, and TP.
After 18:00 NY → If conditions are met, a LIMIT order is placed at EP.
Between 18:00–08:00 NY → If price touches EP, the trade is executed.
At 08:00 NY → If EP wasn’t touched, the order is cancelled.
At Configured Manual Close Time (default 09:00 NY) → All open positions are force-closed if still active.
🧪 Backtest Settings:
Timeframe: 1-hour only
Order Type: strategy.entry() with limit=
SL/TP Configurable: Yes, in pips
Risk Input: % of capital per trade
Manual Close Time: Fully adjustable (default 09:00 NY)
👨💻 Credits:
Developed by LANZ
Strategy logic and trading concept built with clarity and precision.
Code structure and documentation by Kairos, your AI trading assistant.
Designed for high-confidence execution and clean backtesting performance.

LANZ Strategy 1.0🔷 LANZ Strategy 1.0 — Session-Based Directional Logic with Visual Multi-Account Risk Management
LANZ Strategy 1.0 is a structured and disciplined trading strategy designed for the 1-hour timeframe, operating during the NY session and executing trades overnight. It uses the directional behavior between 08:00 and 18:00 New York time to define precise limit entries for the following night. Ideal for traders who prefer time-based execution, clear visuals, and professional risk management across multiple accounts.
🧠 Core Components:
1. Session Direction Confirmation:
At 18:00 NY, the system evaluates the market direction by comparing the open at 08:00 vs the close at 18:00:
If the direction matches the previous day, it is reversed.
If it differs, the current day’s direction is kept.
This logic is designed to avoid trend exhaustion and favor potential reversal opportunities.
2. EP Level & Risk Definition:
Once direction is defined:
For BUY, EP is set at the Low of the session.
For SELL, EP is set at the High of the session.
The system automatically plots:
SL fixed at 18 pips from EP
TP at 3.00× the risk → 54 pips from EP
All levels (EP, SL, TP) are shown with visual lines and price labels.
3. Time-Restricted Entry Execution:
The entry is only valid if price touches the EP between 19:00 and 08:00 NY.
If EP is not touched before 08:00 NY, the trade is automatically cancelled.
4. Multi-Account Lot Sizing:
Traders can configure up to five different accounts, each with its own capital and risk percentage.
The system calculates and displays the lot size per account, based on SL distance and pip value, in a dynamic floating label.
5. Outcome Tracking:
If TP is hit, a +3.00% profit label is displayed along with a congratulatory alert.
If SL is hit, a -1.00% label appears with a loss alert.
If the trade is still open by 09:00 NY, it is manually closed, and the result is shown as a percentage of the initial risk.
📊 Visual Features:
Custom-colored angle and guide lines.
Dynamic angle line starts at 08:00 NY and tracks price until 18:00.
Shaded backgrounds for key time zones (e.g., 08:00, 18:00, 19:00).
BUY/SELL signals shown at 19:00 based on match/divergence logic.
Label panel showing risk metrics and lot size for each active account.
⚙️ How It Works:
08:00 NY: Marks the session open and initiates a dynamic angle line.
18:00 NY: Evaluates the session direction and calculates EP/SL/TP based on outcome.
19:00 NY: Activates limit order monitoring.
During the night (until 08:00 NY): If EP is touched, the trade is triggered.
At 08:00 NY: If no touch occurred, trade is cancelled.
Overnight: TP/SL logic is enforced, showing percentage outcomes.
At 09:00 NY: If still open, trade is closed manually and result is labeled visually.
🔔 Alerts:
🚀 EP execution alert when touched
💢 Stop Loss hit alert
⚡ Take Profit hit alert
✅ Manual close at 09:00 NY with performance result
🔔 Daily reminder at 19:00 NY to configure and prepare the trade
📝 Notes:
Strategy is exclusive to the 1-hour timeframe.
Works best on assets with clean NY session movement.
Perfect for structured, semi-automated swing/overnight trading styles.
Fully visual, self-explanatory, and backtest-friendly.
👨💻 Credits:
Developed by LANZ
A strategy created with precision, discipline, and a vision for traders who value time-based entries, clean execution logic, and visual confidence on the chart.
Special thanks to Kairos — your AI assistant — for the detailed structure, scripting, and documentation of the strategy.

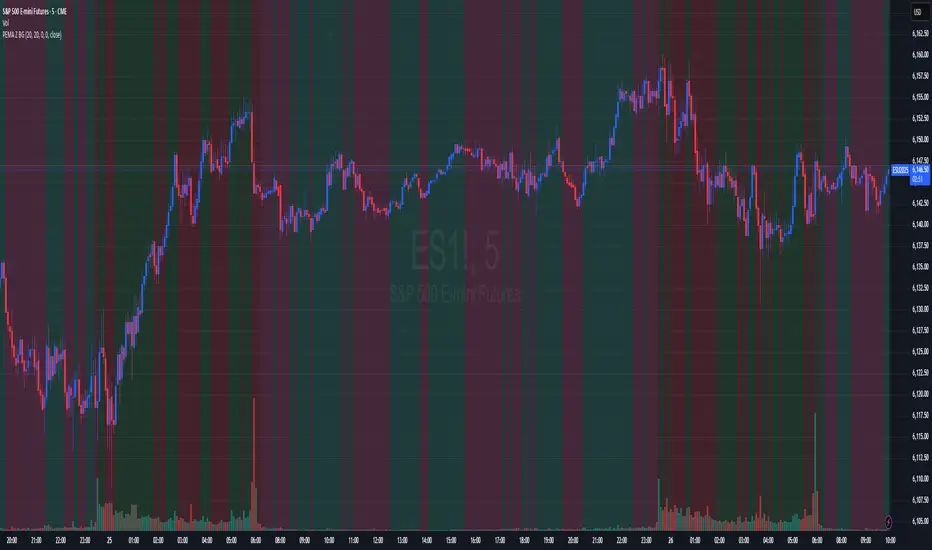
Price-EMA Z-Score Backgroundhe “Price‑to‑EMA Z‑Score Background” indicator is designed to give you a clear, visual sense of when price has moved unusually far away from its smoothed trend, and to highlight those moments as potential overextension or mean‑reversion opportunities. Under the hood, it first computes a standard exponential moving average (EMA) of your chosen lookback length, then measures the raw difference between the current close and that EMA on every bar. To make that raw deviation comparable across different markets and timeframes, it converts the series of differences into a z‑score—subtracting the rolling mean of the deviations and dividing by their rolling standard deviation over a second lookback window.
Once you’ve normalized price‑to‑EMA distance into z‑score units, you can set two simple trigger levels: one upper threshold and one lower threshold. Whenever the z‑score climbs above the upper threshold, the chart background glows green, signaling that price is extended far above its EMA (and might be ripe for a pullback). Whenever the z‑score falls below the lower threshold, the background turns red, calling out an equally extreme move below the EMA (and a possible oversold bounce). Between those bands, no shading appears, letting you know price is trading within its “normal” range around the trend.
By adjusting the EMA period, the z‑score lookback, and the two trigger levels, you can dial in early warning signals (e.g. ±1 σ) or wait for very stretched moves (±2 σ or more). Used in concert with your favorite momentum or pattern tools—or even as a standalone visual cue—this simple background‑shading approach makes it easy to spot when a market is running too hot or too cold relative to its own recent average.
Yield Curve Regime Shading with LegendTakes two symbols (e.g. two futures contracts, two FX pairs, etc.) as inputs.
Calculates the “regime” as the sign of the change in their difference over an n‑period lookback.
Lets you choose whether you want to color the bars themselves or shade the background.
How it works
Inputs
symbolA, symbolB: the two tickers you’re comparing.
n: lookback in bars to measure the change in the spread.
mode: pick between “Shading” or “Candle Color”.
Data fetching
We use request.security() to pull each series at the chart’s timeframe.
Regime calculation
spread = priceA – priceB
spreadPrev = ta.valuewhen(not na(spread), spread , 0) (i.e. the spread n bars ago)
If spread > spreadPrev → bullish regime
If spread < spreadPrev → bearish regime
Plotting
Shading: apply bgcolor() in green/red.
Candle Color: use barcolor() to override the bar color.

BTC Transaction Indicator Name: "Bitcoin On-Chain Volume & Dynamic Parabolic Curve Signals"
Purpose:
This indicator is designed for Bitcoin traders and long-term holders. It combines the analysis of Bitcoin's on-chain transaction volume with price action to generate "Whale" and "Bear" signals. Additionally, it features a unique dynamic parabolic curve that acts as a visual support line, adapting its visibility based on price interaction with a key Exponential Moving Average (EMA).
Key Components:
On-Chain Volume Analysis:
Utilizes Estimated Transaction Volume (ETRAV) data from the Bitcoin blockchain.
Calculates fast and slow Simple Moving Averages (SMAs) of this volume.
Identifies volume trends (up/down) and significant volume increases/decreases.
Employs fixed thresholds (2,500,000 for low volume and 25,000,000 for high volume) to define key activity levels, similar to how historical on-chain analysis defined accumulation and distribution zones.
Price Action Analysis:
Calculates fast and slow SMAs of the price.
Detects price trends (up/down), recoveries, and declines based on these price SMAs.
"Whale" and "Bear" Signals:
Whale Signals (Buy-side): Generated when there's an upward volume trend, significant volume increase, and a downward price trend followed by price recovery. These indicate potential accumulation phases.
Bear Signals (Sell-side): Generated when there's a downward volume trend, significant volume decrease, and an upward price trend followed by price decline. These indicate potential distribution phases.
Visuals: Both types of signals are plotted as small, colored circles directly on the price chart, with corresponding text labels ("Whale," "Buy," "Bear," "Sell," "Price Recovering," "Price Declining").
Dynamic Parabolic Curve:
Concept: A green parabolic (exponential) curve that serves as a dynamic visual support line.
Activation: The curve starts drawing automatically only when the price crosses over the EMA 500 (Exponential Moving Average of 500 periods). The curve's starting point is set at a user-defined percentage below the EMA 500 value at that exact crossover point.
Visibility: The curve remains visible and continues its trajectory only as long as the price stays above the EMA 500.
Deactivation: The curve disappears instantly if the price falls below or equals the EMA 500. It will only reappear if the price crosses above the EMA 500 again.
Customization: The curve's steepness (Tasa Crecimiento Curva) and its initial distance from the EMA 500 (Inicio Curva % por debajo de EMA500) are adjustable.
Dynamic Label: A "Parabólico" text label is plotted near the center of the active curve segment, with an adjustable vertical offset to ensure it stays visually appealing below the curve.
What is PLOTTED on the chart:
The small, colored circle signals for Whale/Buy and Bear/Sell activity.
The green dynamic parabolic curve.
What is NOT PLOTTED:
EMA 200, EMA 500 lines (though they are calculated internally for logic).
Raw volume data or volume Moving Averages (these are only used for signal calculation, not plotted).
Ideal for:
Bitcoin traders and investors focused on long-term trends and cycle analysis, who want visual cues for accumulation/distribution phases based on on-chain activity, complemented by a unique, dynamically appearing parabolic support curve.
Important Notes:
Relies on the availability of external on-chain data (QUANDL:BCHAIN) within TradingView.
Functions best on a daily timeframe for optimal on-chain data relevance.

Rainbow Price Chart This indicator is a technical and on-chain analysis tool for Bitcoin, designed to help investors better understand the different phases of the market cycle and underlying sentiment. It directly overlays on the price chart (overlay=true).
Indicator Name: "Rainbow Price Chart & V/T Ratio Signals"
General Purpose:
It combines two popular methodologies for visualizing Bitcoin's value and sentiment: the classic "Rainbow Price Chart" and signals derived from the "Value per Transaction Ratio" (V/T Ratio) based on blockchain data. It is ideal for long-term investors looking for strategic entry/exit points.
Main Components:
Rainbow Price Chart:
Concept: Divides Bitcoin's price range into different market "sentiment zones" (e.g., "Bubble Zone," "FOMO Zone," "HODL Zone," "Accumulation Zone," "Buy Zone," "Fire Sale Zone") using colored bands. These bands are calculated as ascending and descending multiples of a base Exponential Moving Average (EMA), configurable by default to 200 periods.
Visualization: The zones are represented with transparent color fills on the price chart. A detailed legend in the top right corner of the chart explains the meaning of each color and sentiment zone.
Important Note: This type of chart is designed to be viewed and analyzed correctly on a logarithmic price scale. The indicator includes a visual reminder to activate this scale.
Value per Transaction (V/T) Ratio Signals:
Concept: Measures the average value per transaction on the Bitcoin blockchain by dividing the total transacted volume in USD by the number of transactions. This ratio is smoothed with an Exponential Moving Average (by default, 7 periods) and is framed within a dynamic Linear Regression Channel (LRC) based on standard deviation.
Signal Generation: Based on the position of the smoothed V/T Ratio within this LRC channel, the indicator generates signals directly on the price chart, such as:
"BOTTOM": Low price, V/T Ratio in the lower band of the LRC.
"SEMI-LOW" / "SEMI-HIGH": Intermediate phases within the channel.
"ATH" (All-Time High): Potentially overvalued price, V/T Ratio in the upper band of the LRC.
On-Chain Data: The indicator requests external daily on-chain data for total transacted volume (TVTVR) and number of transactions (NTRAN) from the Bitcoin blockchain.
Diagnostic Panes: Includes plots of the raw on-chain data (volume and number of transactions) in a separate pane, which are useful for debugging or verifying the data source. The lines for the V/T Ratio itself and its LRC channel are not plotted by default but can be activated in the code for deeper analysis.
Ideal for:
Bitcoin investors and "hodlers" who desire a visual tool that combines price-based market cycle context with fundamental signals derived from on-chain activity, to help identify key moments for accumulation or potential distribution.
Considerations:
Relies on the availability of external on-chain data (QUANDL:BCHAIN) within TradingView.
Functions best on a daily timeframe.

CirclesCircles - Support & Resistance Levels
Overview
This indicator plots horizontal support and resistance levels based on W.D. Gann's mathematical approach of dividing 360 degrees by 2 and by 3. These divisions create natural price magnetism points that have historically acted as significant support and resistance levels across all markets and timeframes.
How It Works
360÷2 Levels (Blue): 5.63, 11.25, 33.75, 56.25, 78.75, etc.
360÷3 Levels (Red): 7.5, 15, 30, 37.5, 52.5, 60, 75, etc.
Both Levels (Yellow): 22.5, 45, 67.5, 90, 112.5, 135, 157.5, 180 - These are "doubly strong" as they appear in both calculations
Key Features
Auto-Scaling: Automatically adjusts for any price range (from $0.001 altcoins to $100K+ Bitcoin)
Manual Scaling: Choose from 0.001x to 1000x multipliers or set custom values
Full Customization: Colors, line widths, styles (solid/dashed/dotted)
Historical View: Option to show all levels regardless of current price
Clean Display: Adjustable label positioning and line extensions
Use Cases
Identify potential reversal zones before price reaches them
Set profit targets and stop losses at key mathematical levels
Confirm breakouts when price decisively moves through major levels
Works on all timeframes and all markets (stocks, crypto, forex, commodities)
Gann Theory
W.D. Gann believed that markets move in mathematical harmony based on geometric angles and time cycles. These 360-degree divisions represent natural balance points where price often finds support or resistance, making them valuable for both short-term trading and long-term analysis.
Perfect for traders who use:
Support/Resistance trading
Fibonacci levels
Pivot points
Mathematical/geometric analysis
Multi-timeframe analysis

Simple Sessions & LevelsWhat this indicator does:
This script marks out two essential types of price levels for intraday and swing traders:
The high and low of a customizable 15-minute opening range after the market/session open.
The previous day’s high, midpoint (“halfback”), and low.
How it works:
The script lets you set the session start time (hour and minute) to match your market.
It then calculates the high and low of the first 15 minutes after the session opens and plots those as solid lines.
It also plots the prior day’s high, halfback (midpoint), and low on your chart for easy reference.
Each line and each label can be toggled on or off independently in the settings for maximum customization.
Colors for each level are also fully customizable.
How to use it:
Add the script to your chart.
Set the session start hour and minute to match the open of the market or instrument you trade.
Choose which levels and labels you want displayed by using the toggles in the settings.
The indicator will automatically draw the session range and prior day levels for you.
Use these lines as reference for key support, resistance, and potential trade entry/exit points.
What makes it unique and useful:
This tool combines a flexible session opening range with classic daily reference levels in one package. You have complete control over which levels and labels are shown, making it adaptable for any trading style. It’s especially useful for day traders who want to quickly identify volatility windows and the most important price levels from the previous session.

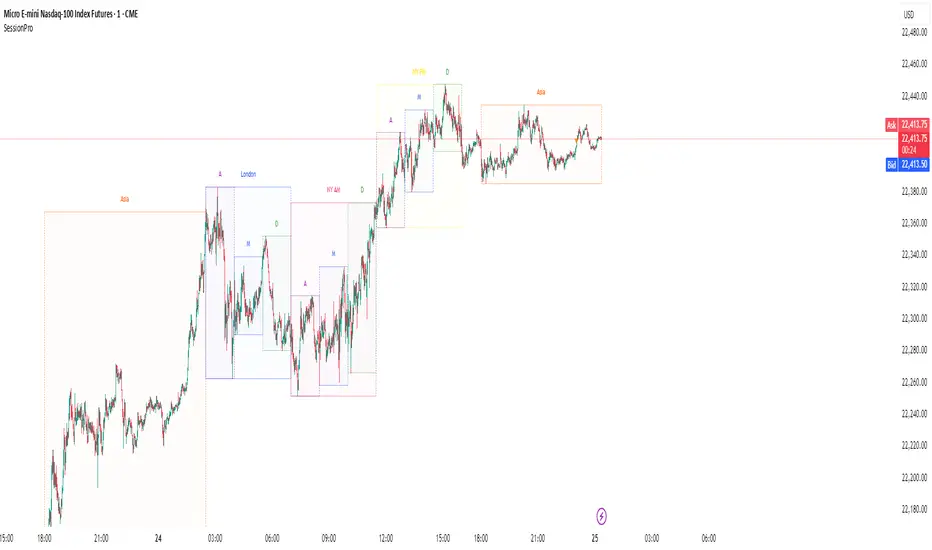
Session [PRO]Session Pro is a powerful and highly customizable indicator designed to visualize key trading sessions and their internal phases directly on your chart. It's built for traders who base their strategies on time-of-day dynamics, market opens, and specific session profiles.
This tool moves beyond simple session boxes by allowing you to map out detailed sub-sessions (e.g., Accumulation, Manipulation, Distribution phases) within the main trading windows, giving you a clearer view of the market's structure throughout the day.
Key Features
Customizable Main Sessions: Visualize Asia, London, and New York (AM/PM) sessions with distinct high/low ranges.
Detailed Sub-Sessions: Break down the London and New York sessions into three distinct profiles (A, M, D) to analyze intraday market movements.
Advanced Display Control: For every single session and sub-session, use a dropdown menu to choose your preferred display style:
Outline & Fill: The default view with a transparent colored background.
Outline Only: A minimalist view showing only the session's high/low border.
Off: Hide any session completely to declutter your chart.
Granular Color Customization: Every session and sub-session has its own individual color picker, giving you full control over your chart's aesthetics.
Custom Alerts: Never miss a session start again. Enable alerts for any specific main or sub-session you want to track.
Full Timezone Support: Easily sync the indicator to your local time using a UTC offset (defaulting to NY time, UTC-4) or your exchange's timezone.
How to Use
Go into the indicator Settings.
For each session, configure the Time, Color, and Display Style to your preference.
Check the Alert box for any session you wish to receive a notification for when it begins.
Adjust the global UTC Timezone Offset in the final settings tab to match your trading clock.
How to Set Alerts
First, go into the indicator's Settings and check the "Alert" box for each session you want to be notified about.
Click the "Alert" button on the TradingView toolbar (the alarm clock icon).
In the Condition dropdown, select "Session Pro".
In the dropdown directly below it, choose the option "Any alert() function call".
Select your preferred notification method (e.g., Pop-up, Email, App Notification) and click "Create".
Hope this tool helps you better visualize market structure and time your trades more effectively. Happy trading!
Dominance Interflow DThis indicator visualizes the normalized dominance levels of key sectors in the crypto market, including Bitcoin, Ethereum, Stablecoins, and the Altcoins as grouped market segments.
All dominance values are normalized between 0 and 1 for clear visual comparison. This allows traders and analysts to:
- Track capital rotation and dominance shifts
- Identify Altseason setups or defensive market phases
- Spot Risk-On / Risk-Off sentiment based on Stablecoin dominance
- Evaluate market breadth through altcoin tracking
📊 Included Data Series:
- 🟧 Bitcoin Dominance (BTC.D)
- 🔵 Ethereum Dominance (ETH.D)
- ⚪ Stablecoin Dominance (STABLE.C.D)
- 🟥 Without Top 50 Coins (TOTALE50.D)
- 🟥 without Top 100 Coins (TOTALE100.D)
🧠 Smart Normalization:
Automatically adjusts based on timeframe
500 candles for Daily (1D)
💡 Use this tool to understand macro capital flows, identify crypto sector trends, and optimize your asset rotation strategy.

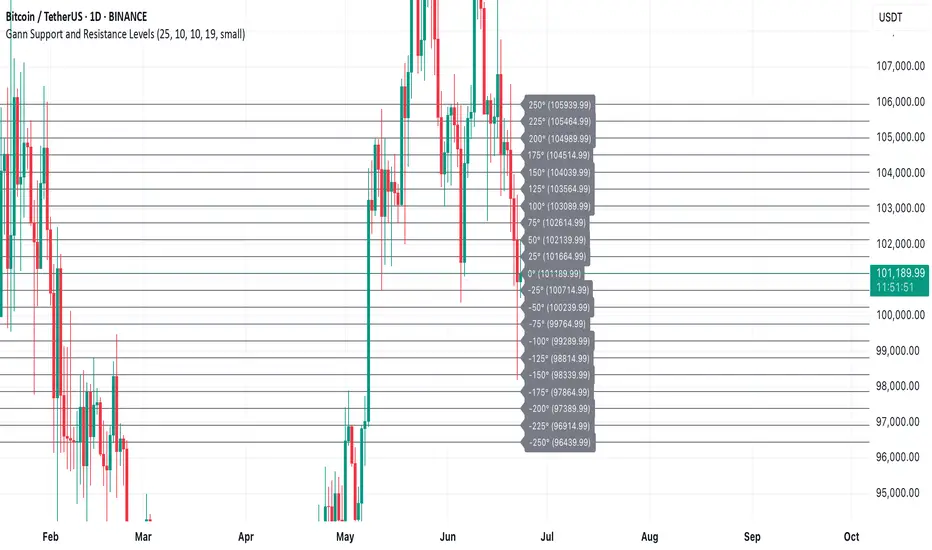
Gann Support and Resistance LevelsThis indicator plots dynamic Gann Degree Levels as potential support and resistance zones around the current market price. You can fully customize the Gann degree step (e.g., 45°, 30°, 90°), the number of levels above and below the price, and the price movement per degree to fine-tune the levels to your strategy.
Key Features:
✅ Dynamic levels update automatically with the live price
✅ Adjustable degree intervals (Gann steps)
✅ User control over how many levels to display above and below
✅ Fully customizable label size, label color, and text color for mobile-friendly visibility
✅ Clean visual design for easy chart analysis
How to Use:
Gann levels can act as potential support and resistance zones.
Watch for price reactions at major degrees like 0°, 90°, 180°, and 270°.
Can be combined with other technical tools like price action, trendlines, or Gann fans for deeper analysis.
📌 This tool is perfect for traders using Gann theory, grid-based strategies, or those looking to enhance their visual trading setups with structured levels.