ZY Legend İndikatörü (Hedge Modda)The ZY Legend Indicator (in Hedge Mode) can be used with the ZY Legend Indicator. When used alone, it allows entering into a transaction in an already established trend. Its use with the ZY Legend Indicator is as follows: When transactions taken with the ZY Legend Indicator are hedged with the signals of the same indicator, it shows the TP target of the position performing the hedge transaction (the last opened position). When the relevant TP signal arrives, the position should be closed with a market order, and the profit/loss from the position should be added to or deducted from the profit/loss of the main position at the TP target.
Cycles

Trend Following with Mean Reversion - IndicatorTrend Following with Mean Reversion Indicator
A comprehensive technical analysis tool that combines trend detection with momentum reversal signals for enhanced market timing.
Strategy Overview:
This indicator identifies high-probability entry points by combining two proven technical concepts:
Trend Following: Uses Exponential Moving Average (EMA) to determine market direction
Mean Reversion: Utilizes RSI oversold/overbought levels for optimal entry timing
Key Features:
📊 Core Indicators:
Customizable EMA for trend identification (default: 50 periods)
RSI momentum oscillator with adjustable overbought/oversold levels
Visual trend direction indicators
🎯 Signal Generation:
BUY Signals: Generated when price is above EMA (uptrend) AND RSI is oversold (<30)
SELL Signals: Generated when price is below EMA (downtrend) AND RSI is overbought (>70)
Clear visual labels on chart for easy identification
⏰ Advanced Time Management:
Customizable trading session filter (default: 0700-1500)
Multiple timezone support (GMT-8 to GMT+13)
Individual day exclusion controls (weekends excluded by default)
Visual background coloring for time restrictions
🎨 Visual Elements:
Color-coded trend indicators
RSI extreme level background highlighting
Time filter status visualization
Comprehensive information table showing current market conditions
🔔 Alert System:
Built-in alerts for valid entry signals
Notifications for signals occurring outside trading hours
Customizable alert messages
How It Works:
Trend Filter: EMA determines if market is trending up or down
Momentum Confirmation: RSI identifies when price has moved too far and is due for reversal
Time Validation: Ensures signals only occur during specified trading hours
Visual Confirmation: Clear BUY/SELL labels appear only when all conditions align
Best Use Cases:
Swing trading on higher timeframes (4H, Daily)
Counter-trend entries in strong trending markets
Combining with other technical analysis tools
Educational purposes for understanding trend/momentum relationships
Customization Options:
Adjustable EMA and RSI periods
Customizable overbought/oversold levels
Flexible time and day restrictions
Toggle visual elements on/off
Multiple display themes
Note: This is a technical analysis tool for educational and informational purposes. Always conduct your own analysis and consider risk management principles. Past performance does not guarantee future results.

Trend Following with Mean Reversion (Indicator with Alerts)This script implements a combined trend-following and mean-reversion strategy for educational and analytical purposes. It uses a configurable Exponential Moving Average (EMA) to determine market trend direction, and the Relative Strength Index (RSI) to identify potential entry conditions aligned with oversold or overbought states.
Key features include customizable take profit and stop loss levels for both long and short trades, as well as flexible filters for trading hours and days of the week. These restrictions help users explore strategy behavior under various market conditions and timeframes.
The strategy does not make any claims regarding profitability, win rates, or future performance. It is intended to support informed experimentation, backtesting, and learning within the TradingView platform.
Always conduct your own research and consult a financial advisor before making trading decisions.
Message me if you would like code only to improve it and re-share.

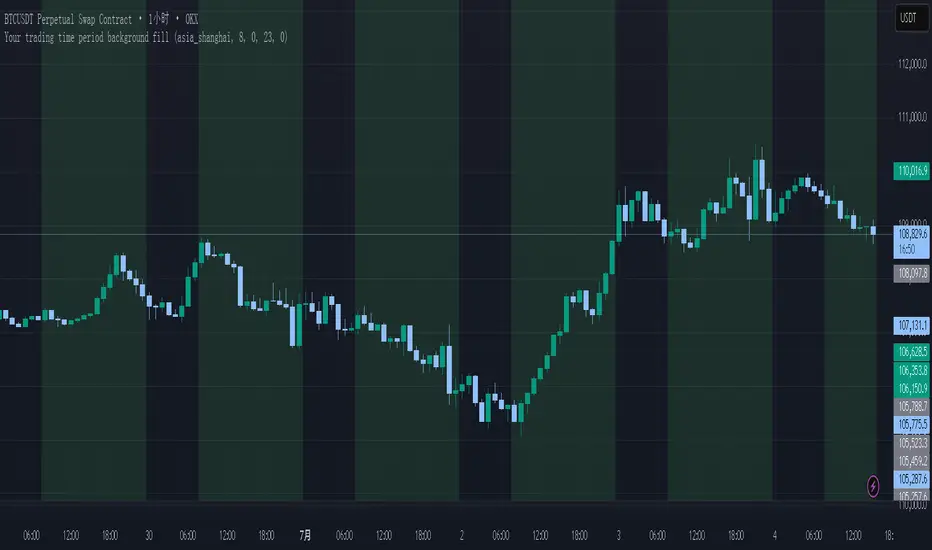
Your trading time period background fillThis script allows you to add background highlights to charts during any regional trading session, customize your own trading time, and is precise and customizable yet simple and easy to use, making it more convenient to review transactions.
Support global mainstream time zones: The drop-down list includes 30 commonly used IANA time zones (default is Asia/Shanghai) (such as Asia/Shanghai, America/New_York, Europe/London, etc.), one-click switching, no need to manually calculate the time difference.
Fully localized time input: "Start hour/minute" and "End hour/minute" are filled in with the local time of the selected time zone. The end hour defaults to 23:00 and can be adjusted to 0-23 at will.
Accurate time difference splitting: The script internally splits the time zone offset into whole hours and remainder minutes (supports half-hour zones, such as UTC+5:30), and ensures that all parameters are integers when calling timestamp to avoid errors.
Dynamic background rendering: Each K-line is judged according to the UTC timestamp whether it falls within the set range. If it meets the time period, it will be marked with a semi-transparent green background, and it will return to its original state after crossing the time period, helping you to identify the opening, closing or active period of any market at a glance.
Wide range of scenarios: It can be used for time-sharing highlighting of all-weather varieties of foreign exchange and cryptocurrency, and can also be used in conjunction with backtesting and timing strategies to only send signals during the active period of the target market, greatly improving trading efficiency and strategy accuracy.
Just select the region and set the time, and the script will automatically complete all complex time zone conversions and drawing, allowing you to focus on the transaction itself.
Forex Sessions (Asia, London, NY)This indicator highlights the current day’s Forex trading sessions for Asia, London, and New York with clear vertical lines. Each session’s open and close times are marked with distinct colors and clean labels for quick visual reference. Designed to help traders easily identify key market hours on any timeframe. UTC+2 !!!

Shift 3M - 30Y Yield Spread🟧 Shift 3M - 30Y Yield Spread
- This indicator visually displays the **inverse of the US Treasury short-long yield spread** (3-month minus 30-year spread reversal signal) in a "price chart-like" form.
- By default, the spread line is shifted by 1 year to help anticipate forward market moves (you can adjust this offset freely).
- Especially customized to be analyzed together with the movements of US indices like the S&P 500, and to help understand broader market cycles.
✅ Description
- Normalizes the spread based on a rolling window length you set (default: 500 bars).
- Both the normalization window and offset (shift) are fully customizable.
- Then, it scales the spread to match your chart’s price range, allowing you to intuitively compare spread movements alongside price action.
- Instantly see the **inverse (reversal) signals of the short-long yield spread**, curve steepening, and how they align with actual price trends.
⚡ By reading macro yield signals, you can **anticipate exactly when a market crash might come or when an explosive rally is about to start**.
⚡ A perfect tool for macro traders and yield curve analysts who want to quickly catch major market turning points!
copyright @invest_hedgeway
============================================================
🟧3개월 - 30년 물 장단기 금리차 역수
- 이 인디케이터는 미국 국채 **장단기 금리차 역수**(3개월물 - 30년물 스프레드의 반전 시그널)를 시각적으로 "가격 차트"처럼 표시해 줍니다.
- 기본적으로 스프레드 선은 **1년(365봉) 시프트**되어 있어, 시장을 선행적으로 파악할 수 있도록 설계되었습니다 (값은 자유롭게 조정 가능).
- 특히 S&P500 등 미국 지수 흐름과 함께 분석할 수 있도록 맞춤화되었으며, 시장 사이클을 이해하는 데에도 큰 도움이 됩니다.
✅ 설명
- 지정한 롤링 윈도우 길이(기본: 500봉)를 기준으로 스프레드를 정규화합니다.
- 정규화 길이와 오프셋(시프트) 모두 자유롭게 설정 가능
- 이후 현재 차트의 가격 레인지에 맞게 스케일링해, 가격과 함께 흐름을 직관적으로 비교할 수 있습니다.
- **장단기 금리차의 역전(역수) 시그널**, 커브 스티프닝 등과 실제 가격 움직임의 관계를 한눈에 확인
⚡ 거시 금리 신호를 통해 **언제 폭락이 올지, 언제 폭등이 터질지** 미리 감지할 수 있습니다.
⚡ 시장의 전환점을 빠르게 캐치하고 싶은 매크로 트레이더와 금리 분석가에게 완벽한 도구!
copyright @invest_hedgeway

Bearish Fibonacci Extension Distance Table
### 📉 **Bearish Fibonacci Extension Distance Table – Pine Script Indicator**
This TradingView indicator calculates and displays **bearish Fibonacci extension targets** based on recent price swings, specifically designed for traders looking to **analyze downside potential** in a trending market. Unlike traditional Fibonacci retracement tools that help identify pullbacks, this version projects likely **price targets below current levels** using Fibonacci ratios commonly followed by institutional and retail traders alike.
#### 🔧 **How It Works:**
* **Swing Calculation**:
The script looks back over a user-defined period (`swingLen`, default 20 bars) to find:
* `B`: The **highest high** in the lookback (start of bearish move)
* `A`: The **lowest low** in the same period (end of bearish swing)
* `C`: The **current high**, serving as the base for projecting future downside levels.
* **Bearish Extensions**:
It then calculates Fibonacci extension levels **below** the current high using standard ratios:
* **100%**, **127.2%**, **161.8%**, **200%**, and **261.8%**
* **Distance Calculation**:
For each level, the indicator computes:
* The **target price**
* The **distance (in %)** between the current close and each Fibonacci level
* **Visual Output**:
A live, auto-updating **data table** is shown in the **top-right corner** of the chart. This provides at-a-glance insight into how far current price is from each bearish target, with color-coded levels for clarity.
#### 📊 **Use Cases**:
* Identify **bearish continuation targets** in downtrending or correcting markets.
* Help manage **take-profit** zones for short trades.
* Assess **risk-reward** scenarios when entering bearish positions.
* Combine with indicators like RSI, OBV, or MACD for **confluence-based setups**.
#### ⚙️ **Inputs**:
* `Swing Lookback`: Number of bars to consider for calculating the swing high and swing low.
* `Show Table`: Toggle to display or hide the Fibonacci level table.
---
### 🧠 Example Interpretation:
Suppose the stock is trading at ₹180 and the 161.8% Fibonacci extension level is ₹165 with a -8.3% distance — this suggests the price may continue down to ₹165, offering a potential 8% short opportunity if confirmed by other indicators.


NEXGEN XNEXGEN X is a powerful multi-layered technical indicator developed by NexGen Trading Academy to give traders an edge by combining the strength of trend analysis (ADX) with the precision of momentum timing (MACD). This all-in-one tool is specially designed for those who want to identify strong trends and execute high-probability entries based on momentum shifts.

NEXGEN ADXNEXGEN ADX
NEXGEN ADX – Advanced Trend Strength & Directional Indicator
Purpose:
The NEXGEN ADX is a powerful trend analysis tool developed by NexGen Trading Academy to help traders identify the strength and direction of market trends with precision. Based on the Average Directional Index (ADX) along with +DI (Positive Directional Indicator) and –DI (Negative Directional Indicator), this custom indicator provides a reliable foundation for both trend-following strategies and trend reversal setups.


Wyckoff Smart Signals (Long + Short)- Wycoff Smart signals made by Melik
Using Wycoff fundamentals and volume confirmation to form a bias

Gold Trend Scalper [Strategy]The Gold Trend Scalper (GTS Pro) is a trend-following momentum-based strategy specifically optimized for trading XAUUSD (Gold) on the 1-minute timeframe. It combines volatility filters, breakout logic, trend confirmation, and risk management to identify high-probability entry points with dynamic exits.


Holy GrailThis is a long-only educational strategy that simulates what happens if you keep adding to a position during pullbacks and only exit when the asset hits a new All-Time High (ATH). It is intended for learning purposes only — not for live trading.
🧠 How it works:
The strategy identifies pullbacks using a simple moving average (MA).
When price dips below the MA, it begins monitoring for the first green candle (close > open).
That green candle signals a potential bottom, so it adds to the position.
If price goes lower, it waits for the next green candle and adds again.
The exit happens after ATH — it sells on each red candle (close < open) once a new ATH is reached.
You can adjust:
MA length (defines what’s considered a pullback)
Initial buy % (how much to pre-fill before signals start)
Buy % per signal (after pullback green candle)
Exit % per red candle after ATH
📊 Intended assets & timeframes:
This strategy is designed for broad market indices and long-term appreciating assets, such as:
SPY, NASDAQ, DAX, FTSE
Use it only on 1D or higher timeframes — it’s not meant for scalping or short-term trading.
⚠️ Important Limitations:
Long-only: The script does not short. It assumes the asset will eventually recover to a new ATH.
Not for all assets: It won't work on assets that may never recover (e.g., single stocks or speculative tokens).
Slow capital deployment: Entries happen gradually and may take a long time to close.
Not optimized for returns: Buy & hold can outperform this strategy.
No slippage, fees, or funding costs included.
This is not a performance strategy. It’s a teaching tool to show that:
High win rate ≠ high profitability
Patience can be deceiving
Many signals = long capital lock-in
🎓 Why it exists:
The purpose of this strategy is to demonstrate market psychology and risk overconfidence. Traders often chase strategies with high win rates without considering holding time, drawdowns, or opportunity cost.
This script helps visualize that phenomenon.

LEOLA LENS FOOTPRINT Reveal institutional intent with real-time price-based zones.
LEOLALENS™ Footprint tracks liquidity sweeps, high-probability entries, and smart money moves — built for traders who demand accuracy.
🔹 Institutional Sweep Detection
🔹 Non-Lagging Real-Time Zones
🔹 High-Probability Entry/Exit Points
🔹 Orange & Green LCB BOX Zones
🔹 Hidden Support/Resistance Detection
🔹 Psychological Price Levels
🔹 Momentum Shift Awareness Zones
🔹 Compatible across all asset classes: Crypto, Stocks, Forex, Commodities
Note: This is an invite-only script. Access is granted upon approval by the script author.

Alpha Trader University - London Continuation StrategyAlpha Trader University - London Continuation Strategy Indicator
OVERVIEW:
This educational indicator implements the London Continuation Strategy, a session-based trading methodology that capitalizes on price continuation patterns between the Asia and London trading sessions. Designed to teach traders about session timing, market structure, and continuation strategies.
STRATEGY METHODOLOGY:
The London Continuation Strategy is based on the market principle that directional movements established during the Asia session often continue during the early London session, creating high-probability trading opportunities.
SESSION ANALYSIS FRAMEWORK:
1. ASIA SESSION (4:00-9:00 Dubai Time):
- Establishes initial market direction and sentiment
- Creates key support and resistance levels
- Provides the foundation for continuation bias
- Blue box visualization with range tracking
2. PRE-LONDON SESSION (9:00-11:00 Dubai Time):
- Transition period between major sessions
- Setup and preparation phase for London entries
- Confirmation or negation of Asia session bias
- Teal box visualization for monitoring
3. LONDON SESSION (11:00-12:00 Dubai Time):
- Primary entry window for continuation trades
- Highest probability period for strategy execution
- Green box labeled "Entry Window" for clear identification
- Optimal timing for trade execution
EDUCATIONAL VALUE:
- Learn session-based trading concepts and timing
- Understand market flow between major trading centers
- Develop skills in identifying continuation patterns
- Practice using session ranges for risk management
- Build foundation for advanced session strategies
TRADING APPLICATIONS:
- Entry Timing: Use London session start for optimal entry points
- Direction Bias: Follow Asia session directional momentum
- Risk Management: Utilize session ranges for stop-loss placement
- Target Setting: Project targets based on session volatility patterns
- Market Structure: Respect key session levels and range breaks
UNIQUE FEATURES:
- Dubai timezone optimization for Middle East traders
- Three-session comprehensive analysis framework
- Real-time session range tracking and visualization
- Customizable visual elements and colors
- Educational labels and clear entry window identification
TECHNICAL IMPLEMENTATION:
- Accurate timezone conversion (UTC to Dubai time)
- Dynamic session detection and range calculation
- Real-time box and label updates during active sessions
- Clean visual design with professional color coding
- Efficient memory management for optimal performance
CUSTOMIZATION OPTIONS:
- Session colors for personal preference
- Box border width adjustment
- Label size customization
- Visual element toggle capabilities
RISK MANAGEMENT INTEGRATION:
- Session range-based stop-loss guidance
- Volatility assessment through range analysis
- Clear entry and exit timing signals
- Structure-based risk parameter definition
This indicator transforms complex session analysis into a systematic, visual trading approach, helping traders understand market timing and develop disciplined continuation strategies.
EDUCATIONAL DISCLAIMER: This indicator is designed for educational purposes and strategy development. It should be used as part of a comprehensive trading plan with proper risk management. Past performance of any strategy does not guarantee future results. Always practice proper risk management and consider market conditions before trading.

Renko MACD v2.0 (TradingFrog)Renko MACD (TradingFrog) – Professional Description with Code Explanations
Description:
The Renko MACD v2.0 (TradingFrog) merges the clarity of Renko charting with the power of the MACD indicator. This script SIMULATES RENKO BRICKS using price movement within any timeframe and calculates the MACD on these pseudo-Renko closes, resulting in clearer, noise-reduced trend signals.
Key Features & Code Insights
1. Pseudo-Renko Brick Calculation
price_diff = src - renko_close
abs_diff = math.abs(price_diff)
bricks_needed = math.floor(abs_diff / box_size)
Explanation:
This section computes how far the current price (src) has moved from the last Renko close. If the movement exceeds the predefined brick size, one or more new bricks will be created. This logic helps simulate Renko charts on any timeframe.
2. Brick Update Logic
if bricks_needed >= 1
direction = price_diff > 0 ? 1 : -1
brick_movement = direction * bricks_needed * box_size
new_renko_close = renko_close + brick_movement
renko_open := renko_close
renko_close := new_renko_close
renko_trend := direction
Explanation:
When the price moves enough to warrant at least one new brick, the script determines the direction (up or down), calculates the new Renko close, and updates all relevant Renko variables. This enables the indicator to track trend changes and reversals.
3. MACD Calculation on Renko Data
renko_macd = ta.ema(renko_close, fast_length) - ta.ema(renko_close, slow_length)
renko_signal = ta.ema(renko_macd, signal_length)
renko_histogram = renko_macd - renko_signal
Explanation:
Instead of using standard price closes, the MACD is calculated on the simulated Renko close prices. This reduces market noise and provides earlier, more reliable trend signals.
4. Alerts and Visual Markers
macd_cross_up = ta.crossover(renko_macd, renko_signal)
macd_cross_down = ta.crossunder(renko_macd, renko_signal)
Explanation:
These lines detect when the Renko MACD line crosses above or below its signal line. The script uses these events to trigger on-chart markers and TradingView alerts, making it easy to spot trading opportunities.
5. Debug & Display Table (Optional)
table.cell(myTable, 0, 0, "Renko Close: " + str.tostring(renko_close))
table.cell(myTable, 1, 0, "MACD: " + str.tostring(renko_macd))
Explanation:
An optional debug table displays real-time Renko and MACD values directly on the chart, supporting transparency and strategy development.
Advantages
Noise Reduction: By using Renko logic, the indicator filters out insignificant price moves.
Clarity: Trends and reversals become much easier to identify.
Flexibility: Works on all markets and timeframes, with customizable brick size and MACD settings.
Note:
This indicator simulates Renko bricks within standard timeframe charts. While not identical to true Renko charts, it offers highly valuable trend and signal analysis for all types of traders.
Recommended Usage:
Best suited for traders seeking clear, reliable trend signals. Combine with other strategies for optimal results.
Happy Trading!

👽 TIME PERIODS👽 TIME PERIODS v1.15
Visualize key time divisions and session levels on any chart:
• Timezone‐aware session shading
– Highlight active NY session (configurable HHMM–HHMM and days)
– Adjustable background opacity
• Weekly & Monthly Separators
– Toggle on/off
– Custom color, style (solid/dashed/dotted) & width
• Day-of-Week Labels
– Diamonds at session start for M–S
– Toggle on/off
• Session Open Line
– Horizontal line at each session’s open
– Configurable color, width & “distanceRight” in bars
– Always shows current session
• Midpoint Vertical Line
– Plots halfway between session open & close
– Custom color, style & width
– Toggle on/off
▶ All elements grouped for easy parameter tweaking
▶ Fully timezone-configurable (default America/New_York)
▶ Version 1.15 — added distanceRight feature & current session support
Use this to see exactly where your chosen session, weekly/monthly boundaries, and intraday pivot points fall—across any timeframe.

Cryptomath Position CalculatorThe CryptoMath Position Calculator
makes it easy to calculate your position size by simply entering a few basic inputs.
It helps you determine the optimal position size without overcomplicating things
quick, simple, and accurate.

CRYPTOMATH 8 EMA's Indicator for CryptoMath community
This Indicator helps us to takes trades follows our strategy
