ISS V5 Strategy (3, 97, 100)
This is a trend strategy that uses a classic combination of indicators:
MACD to determine the main entry signal (line crossing).
RSI as a filter to confirm the strength of the trend.
ATR for dynamic risk management (setting stop-loss and take-profit orders).
Cycles


Wyckoff Buy/Sell Strategy v6Highlights potential accumulation (Buy) and distribution (Sell) areas.
Uses volume spikes, price ranges, and local pivots for detection.
Adds Buy/Sell labels on chart.
Strategy Tips:
Use with Volume Profile, Ichimoku, or EMAs for extra confirmation.
In scalping, combine with tick volume or delta volume if supported.
Look for Spring/Upthrust behavior after a signal appears.
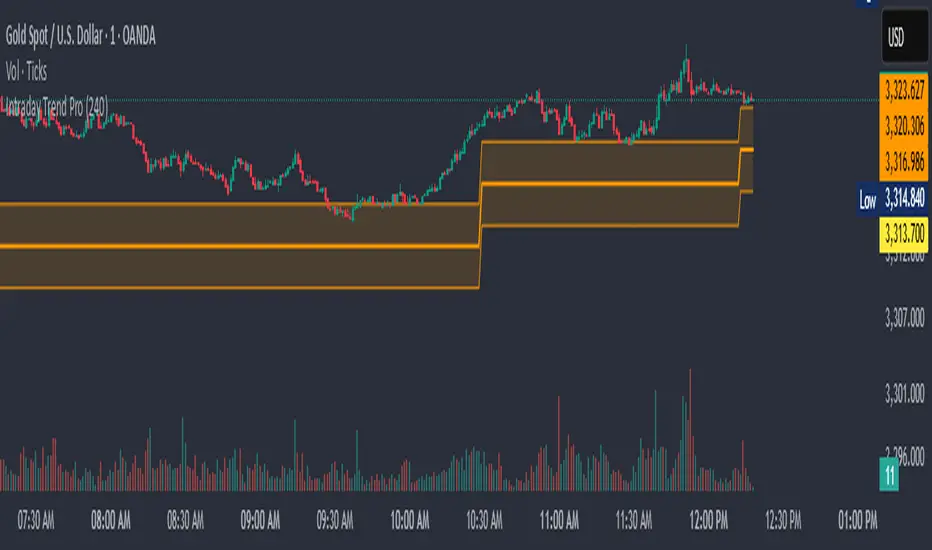
Intraday Trend Pro📈 Intraday Trend Pro — Multi-Timeframe Smart Indicator
Unlock precision in your intraday trading with Intraday Trend Pro, a powerful and versatile indicator built for serious traders. This tool is designed to:
✅ Identify the True Intraday Trend
Quickly and clearly spot bullish or bearish trends using a refined algorithm that filters out noise and false signals.
✅ Smart Entry & Stop Loss Suggestions
The script dynamically suggests optimal entry points and protective stop-loss levels, helping you manage risk and improve trade timing.
✅ Multi-Timeframe Analysis (MTF)
Enable the optional MTF mode to blend higher timeframes with the current chart for a more reliable signal confirmation, enhancing your confidence before entering a trade.
✅ Works Seamlessly Across Assets
Whether you’re trading indices like BankNifty, commodities like XAU/USD, or high-volume stocks, this indicator adjusts to deliver actionable insights.
✅ Customization Made Easy
Input controls allow you to fine-tune the trend settings, select timeframes, and adapt to your unique strategy—whether scalping or holding through the day.
Use Cases:
Confirming trend strength before entering trades
Determining accurate support/resistance for SL placement
Avoiding sideways markets and false breakouts
Aligning trades with higher timeframe momentum
Ideal For:
Intraday traders and scalpers looking for a clean, accurate, and multi-timeframe-aware tool to improve consistency.
Mein Skript//@version=5
indicator("CAN SLIM Filter", overlay=true)
// Beispielhafte Kriterien
eps_growth = input.float(25, "EPS-Wachstum (%)")
rel_volume = input.float(1.5, "Relatives Volumen")
// Simulierte Beispieldaten
mock_eps_growth = ta.rma(close / close - 1, 90) * 100
mock_rel_volume = volume / ta.sma(volume, 50)
plotshape(mock_eps_growth > eps_growth and mock_rel_volume > rel_volume, title="CAN SLIM Match", location=location.belowbar, color=color.green, style=shape.labelup)


Dynamic Volume Flow by smaThe Dynamic Volume Flow (DVF) script blends a refined Volume Flow Indicator with adaptive Support & Resistance zones. It analyzes volume strength relative to price movement and dynamically adjusts key levels using pivot detection and percentile ranges.
Traders can choose between fixed or adaptive zones to better track potential breakout areas and trend shifts. Visual fills make important volume levels easy to interpret.
—
Note: The exact calculation method is proprietary and remains closed-source.

穿越提示策略 + 止盈止损The four kings of the Ha Dog Gang, purely for personal use, are limited to scalp-pulling.


Joey Multi-TF Indicators TableMulti 6EMAs+MTF with RSI signal.
You can ust whole indicator for strong peak bullish price action


Stablecoins $ Growth Rate % [SwissAlgo]🧠 Description
This indicator tracks the percentage growth rate (ROC%) of the global market capitalization in $ of major stablecoins over a configurable lookback period.
It provides a macro view of capital inflows and outflows from stable assets, which may be seen as a potential signal for upcoming crypto market expansions or contractions .
The 1W timeframe is recommended for this indicator to filter out noise.
To see the total market cap of the monitored stablecoins, please use this formula:
CRYPTOCAP:USDT + CRYPTOCAP:USDC + CRYPTOCAP:DAI
💡 How It Works
The script aggregates and monitors the market cap data in $ of the following stablecoins, sourced from TradingView's CRYPTOCAP: tickers:
USDT
USDC
DAI
USDE (Ethena)
USD1 (Mountain Protocol)
USDD
It calculates the rate of change (ROC%) in total stablecoin capitalization over a user-defined period. A positive ROC% may indicate growing confidence or liquidity entering the market. A declining ROC% might precede selloffs or reduced market appetite.
To improve interpretation, the indicator:
1. Includes an optional moving average of the growth rate
2. Colors the background dynamically:
🟢 Light/dark green when growth is increasing or accelerating
🔴 Light/dark red when growth is declining or weakening
3. Displays an info table showing the current ROC%, total stablecoin market cap, and percentage breakdown of each coin
🛎️ Alerts
Built-in alerts will notify you when:
Growth exceeds an upper threshold (default, +5%)
Growth drops below a lower threshold (default, -5%)
These thresholds help identify extreme inflows/outflows that may impact risk-on/risk-off behavior in broader crypto markets.
📈 Use Case
This tool may be helpful for:
Macro traders watching capital rotation trends
Altcoin investors timing entries after stablecoin expansions
Analysts identifying inflection points in crypto sentiment
Quant/systematic traders as a filter for long/short regimes
🛠️ Customization
You can:
Adjust the growth window and the moving average length
Show/hide the MA and zero line
Adjust the upper/lower thresholds for remarkable ROC growth/decline
⚠️ Notes
Due to limited historical data on newer stablecoins (e.g., USDE, USD1), the full growth rate history may appear flat before their launch dates.
This is non-financial advice. Please do your own research before taking investment decisions, and do not risk more than you can afford to lose.
